Sive Morten
Special Consultant to the FPA
- Messages
- 18,699
Fundamentals
U.S. dollar edged lower against a basket of major currencies on Friday after traders were reluctant to buy the greenback ahead of U.S. jobs data next week, and after comments from Federal Reserve Chair Janet Yellen.
Yellen said the Fed is giving "serious consideration" to beginning to reduce its accommodative monetary policy and a rate hike may be warranted later this year, although a downturn in core inflation or wage growth could force it to hold off.
Analysts said the emphasis on considering rate hikes was slightly hawkish and led the dollar to pare some earlier losses, but that the remarks overall reiterated the message from the Fed's March 18 policy statement: that the timeline of the Fed's rate hikes would hinge on U.S. economic data.
Yellen delivered the prepared remarks at a monetary policy conference at the Federal Reserve Bank of San Francisco.
"It turned out to be pretty much a replay" of last week's Fed statement, said Alfonso Esparza, senior currency Strategist at Oanda in Toronto. "They’re waiting for the data," he said in reference to Fed policymakers.
The speech came after the latest Fed policy statement released March 18, which suggested a less aggressive timeline for hiking rates and led most of Wall Street's top banks to push out expectations for the first rate hike to September from June.
The dollar index, which measures the greenback against a basket of six major currencies, posted its second straight weekly loss.
The dollar had lost some ground ahead of the speech on predictions a dovish stance could push the dollar lower. The dollar index rallied over 25 percent from early May last year through March 17, but has since given back some gains since after the Fed's March 18 statement.
Analysts said the long-term uptrend in the dollar remained in place given the likelihood that the Fed will still hike rates this year, but that traders were awaiting key data, including next week's U.S. employment report for March.
"It's still a U.S.-dollar-long environment," said Camilla Sutton, chief currency strategist at Scotiabank in Toronto.
MORE ON FED HIKING…
According to Phantom Consulting and its story was released on Alpha Now resource they still think that Fed will take first hike on September:
Former Fed Chairman Greenspan would no doubt heartily approve of the uncertainty over the interpretation of the statement. The removal of the word ‘patient’ means that the Fed has opened the door to a rate hike by as soon as June. However, at the same time, FOMC members revised down their projections for growth, inflation and interest rates.
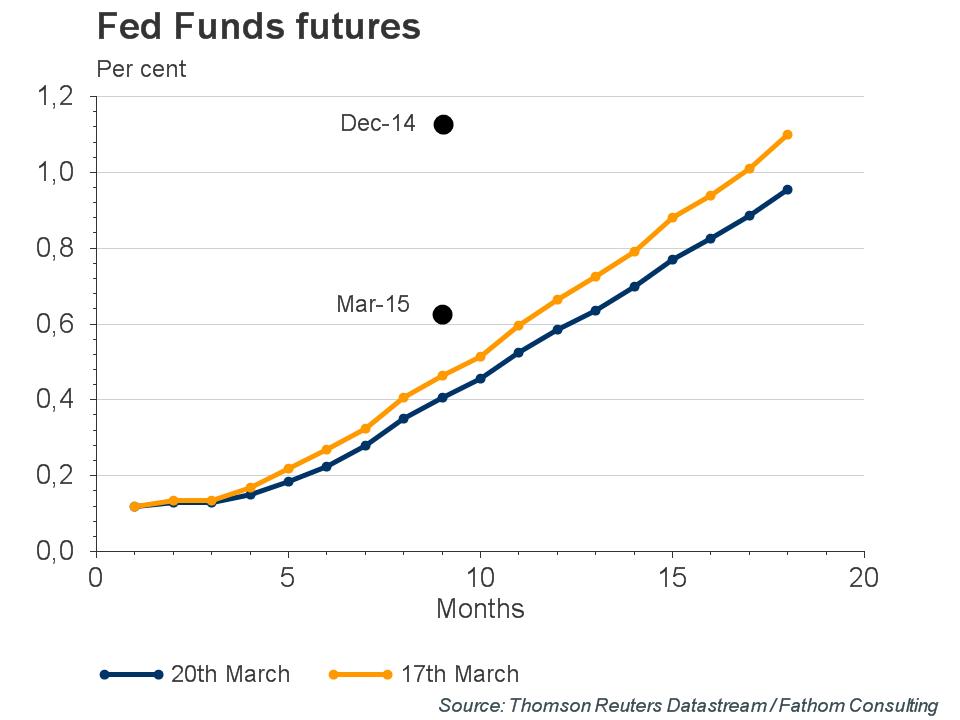 The door is open to a June hike, but they are not compelled to step through it. On balance, markets judged the statement as being slightly dovish – bond yields fell and markets pushed back expectations for a rate hike slightly. We retain our view that the most likely month for the first move in the Fed Funds rate is September – our reading of the Fed has not changed as a result of the March meeting. Our chart shows how the FOMC’s dots – measured as the median of the year-end projections for the Fed Funds rate by the Federal Reserve Board Members and Presidents – has shifted down.
However, all this has done is remove the substantial disconnect between members’ projections and the market (and ourselves).
With the removal of the word ‘patient’, the timing of the rate hike decision will be data dependent. The Committee is clear that it will raise rates if the labour market continues to tighten and it is confident that inflation will move back towards 2%. Our own projections see core CPI inflation reaching 2% by August of this year.
Currently guys we have not big choice among major currencies. Recently we’ve said that CAD stands at the eve of really “big” pattern but it has not been confirmed last week, so we need to wait more. It is not necessary to update our NZD view since we’ve talked about it couple of days ago and our analysis mostly valid. The same we could say on EUR. Thus, we can take a look at GBP.
CFTC data shows massive drop of open positions. Detail analysis shows that drop has happened mostly in speculative positions as short as long approximately at equal amount of 25-30K contracts. Still short positions are almost 2 times greater than long ones. Conversely hedgers positions almost have not changed, just shy closing has happened upon it. This action mostly remains indecision sentiment.
Taking it all together we think that dollar position on recent Fed comments have become weaker. It has become not sufficient any more to feed markets with promising of rate hiking. If couple of months ago strong statistics accompanied by such promises have led to explosive dollar growth, but right now as statistics have become neutral and Yellen said that Fed will watch for data, particularly on inflation and wage cost – dollar position has become weaker as Yellen has put rate hiking process in dependence to statistics. Once it will become worse rate increasing could be postponed even further. This link increases uncertainty on US rate and adds indecision sentiment and review of previous assessment of situation by investors.
Hence, currently we can’t exclude even more solid upward retracement across different dollar-related assets, including FX currencies, gold etc.
Open interest:
 Speculative Shorts:
 Speculative Longs:

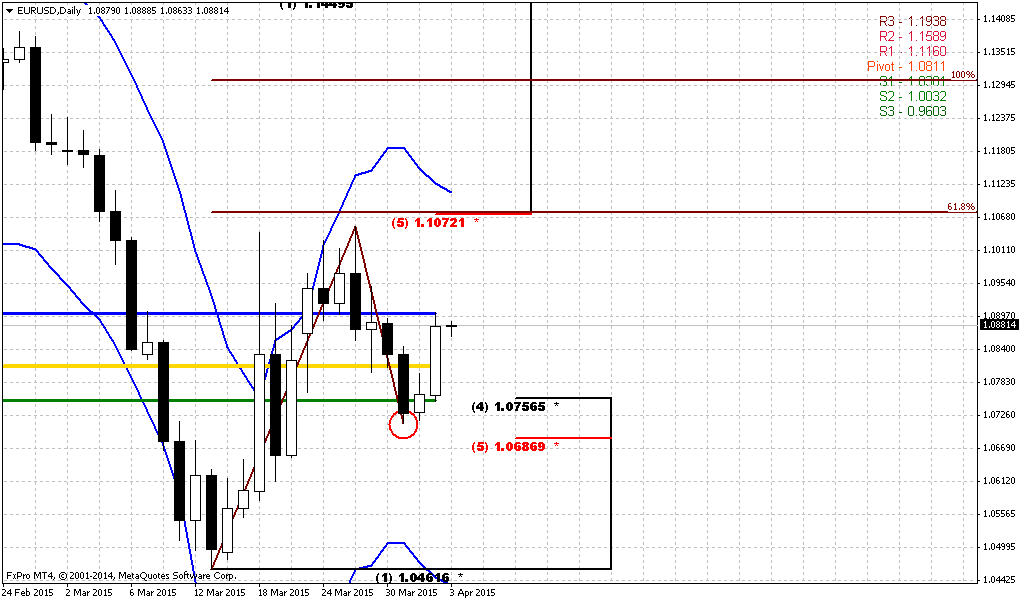
Technicals
Monthly
Since it is still valid – I would like to keep showing you monthly chart and analysis that we’ve made in December 2013 in our Forex Military School Course, where we were learning Elliot Waves technique.
https://www.forexpeacearmy.com/forex-forum/forex-military-school-complete-forex-education-pro-banker/30110-chapter-16-part-v-trading-elliot-waves-page-7-a.html
Our long term analysis was suggested first appearing of new high on 4th wave at ~1.76 level and then starting of last 5th wave down. First condition was accomplished and we’ve got new high, but it was a bit lower – not 1.76 but 1.72. This was and is all time support/resistance area. Now we stand in final part of our journey. According to our 2013 analysis market should reach lows at 1.35 area. Let’s see what additional information we have right now.
Trend is bearish here, but GBP is not at oversold. Couple of weeks ago market has reached strong support area – Yearly Pivot support 1 and 5/8 major monthly Fib level, where we’ve taken our B&B “Sell” trade. As we’ve suggested – move below this level for 200 pips does not necessary mean breakout yet and that’s it, right now GBP has returned right back above it, which means that level is still valid.
In fact here we have just one major destination point. Monthly chart give us just single AB-CD pattern with nearest target at 0.618 extension – 1.3088. Still, here we have another one non-Fib orienteer – lower border of current consolidation. If we will treat it as sideways action then lower border will stand ~1.42-1.43 area. But first we need to get over current support level and see what market could give us here. Currently 1.30-1.31 area looks unbelievable, but if we would suggest parity on EUR/USD and starting rate hiking cycle in US – why not? Still, this is very long-term picture and right now we’re mostly interested in reaction of the market on current support level. First bounce up has happened already. Now the major task is to understand is it possible any greater upside retracement, or we should start preparation for downward breakout.
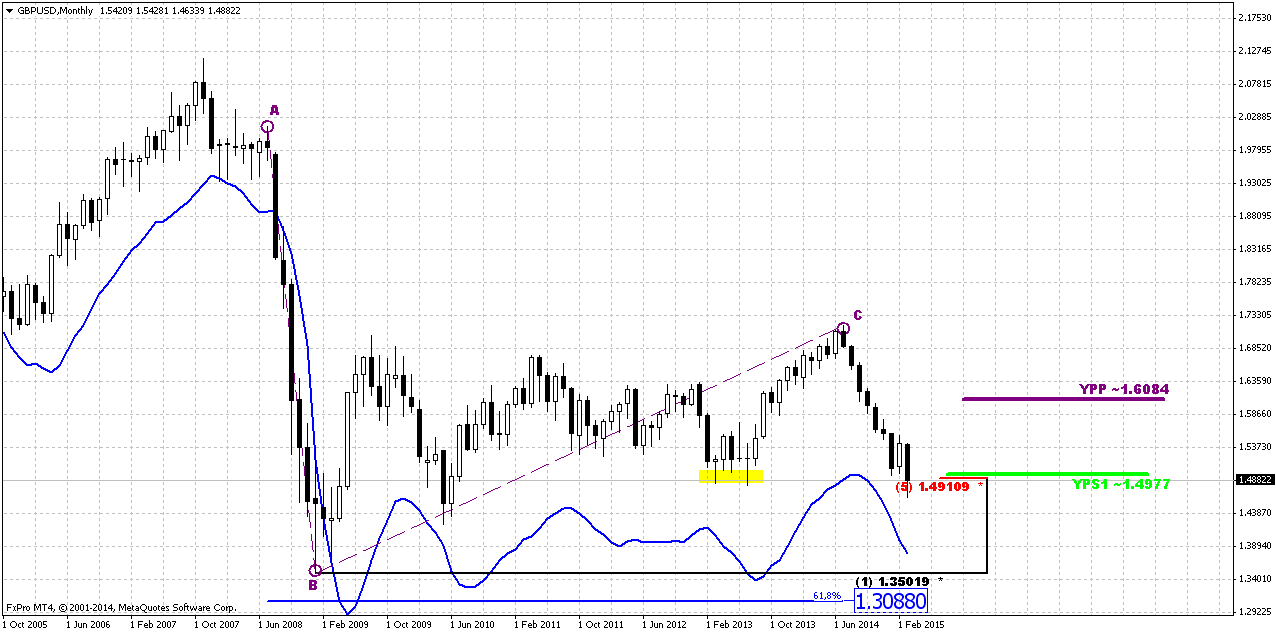
Weekly
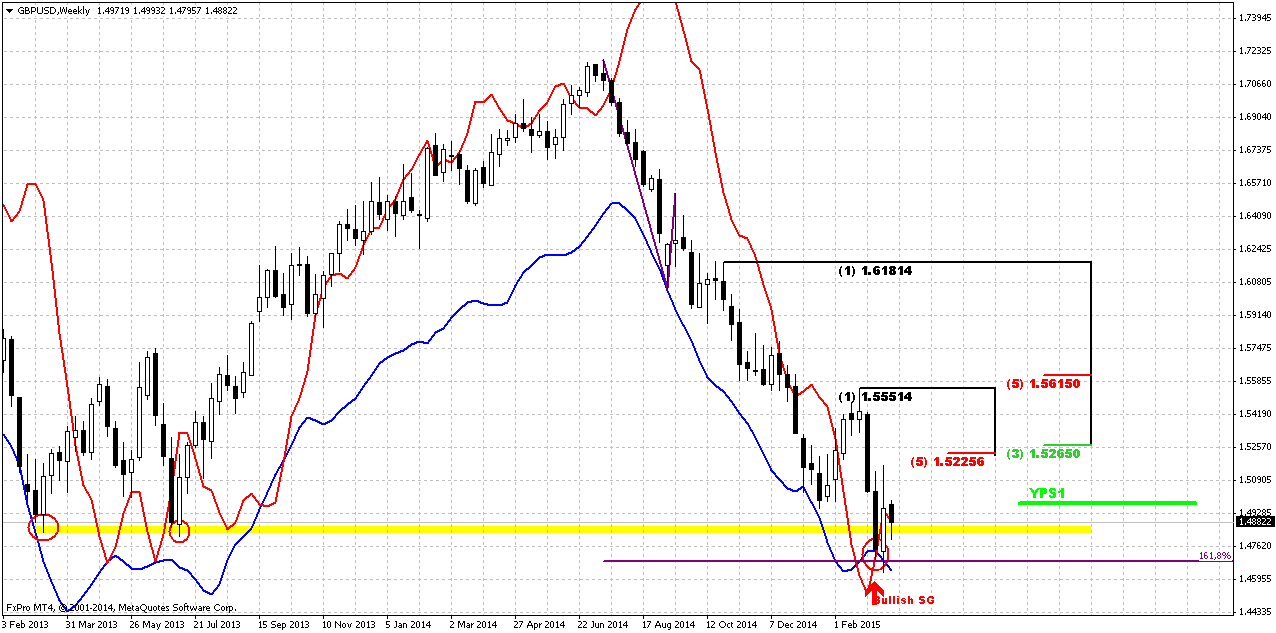
Our major context stands on weekly chart. It seems that shy moving below former lows has happened due existence of 1.618 target of single AB-CD pattern that we have here. Combination of AB-CD objective point, weekly oversold and, take a look, bullish grabber give not bad chances on possible upside retracement. Grabber suggests taking out of previous highs at 1.5550, but two weeks ago we’ve said that it would be nice if market will reach K-resistance and that has happened. Action on previous week was relatively shy – in fact we have inside week. Although trend has turned bearish but both grabbers are still valid, as well as support level. GBP also has returned right back above previous lows of 2013.
The most important thing in weekly analysis could be 1.1618 extension of most recent upside retracement. Theoretically it could lead to appearing of H&S pattern on daily chart that in turn, could trigger greater upside action that we’ve mentioned above. That’s being said recent two weeks bring nothing important to weekly analysis and it shows approximately the same – support still holds as well as chances on upside action.
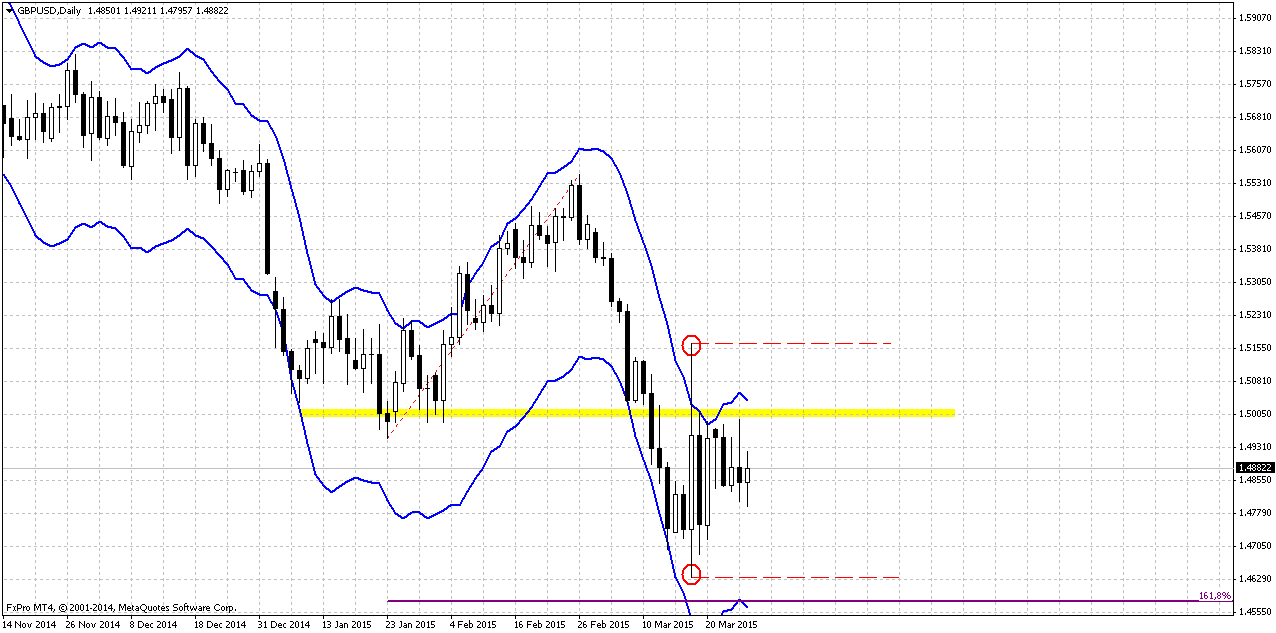
Daily
Here we see why investors have contracted their positions despite of direction. Recall reaction on Fed meeting on previous week. This candle is determinant right now. It’s range holds all recent price action last week. Top of this candle coincides with weekly K-resistance, while bottom stands on strong support area. Common approach to trading this kind of situation is watching for breakout. As market is coiling inside the range of big candle – its building an energy for breakout. Depending on what extreme point of this candle will be taking out – market will continue action in this direction. Here you also can see the half of possible H&S pattern. In the light of recent Fed comments it looks not as impossible as previously.
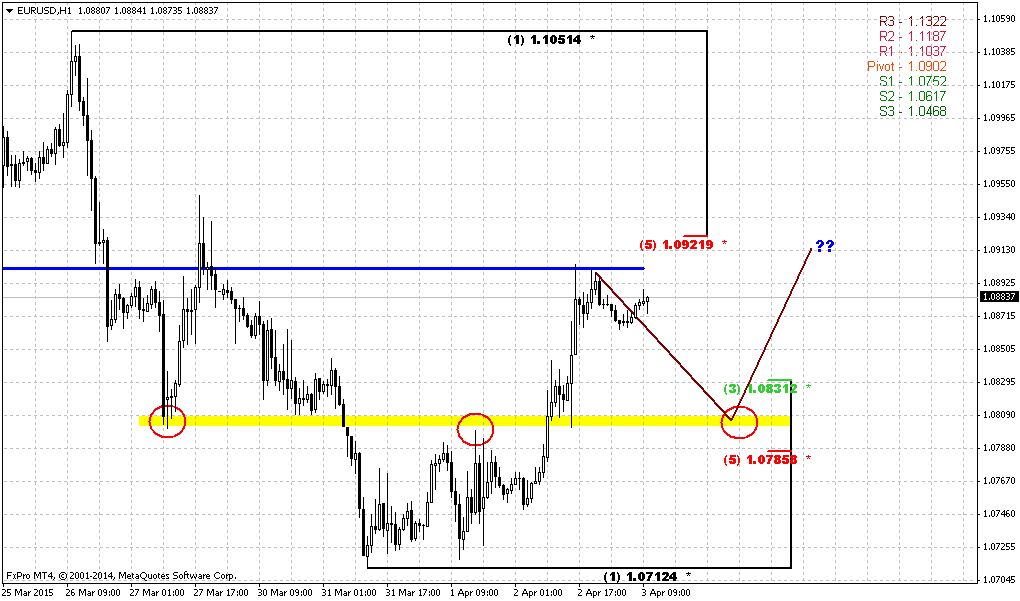
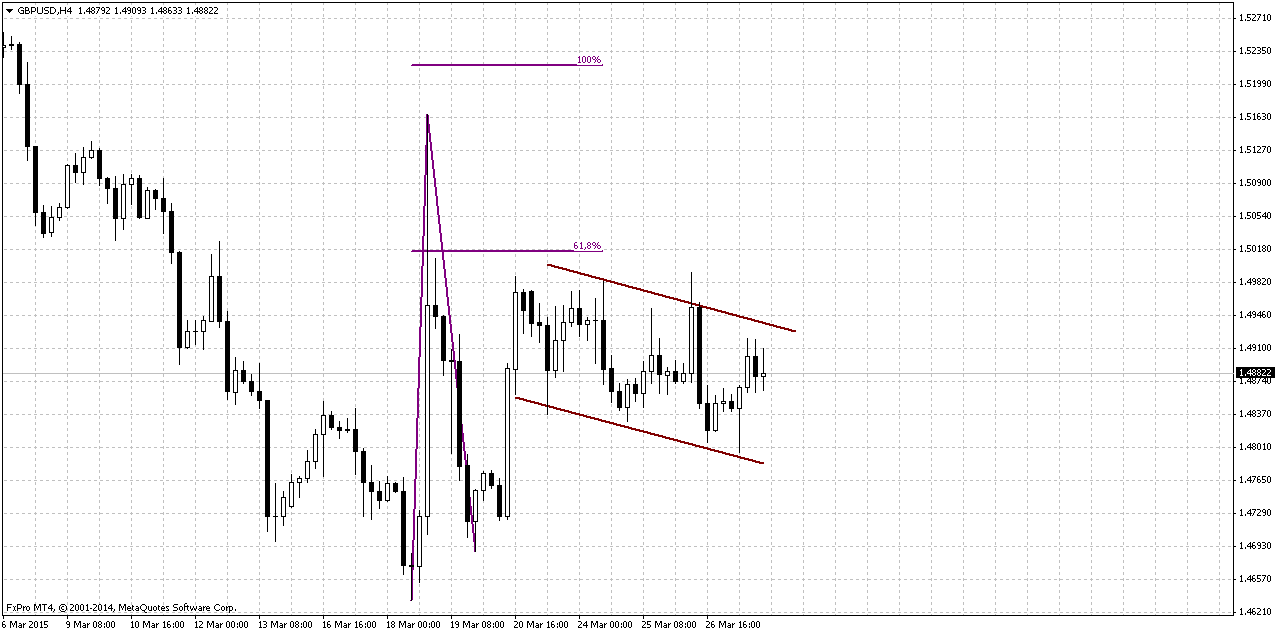
4-hour charts
On Intraday charts picture looks not as impressive as on larger time frames. Still, if we will go through recent action step by step we could find some nuances that could be useful. Action is very choppy. After first rally on Fed meeting, market has tried to erase it by strong deep retracement but was not able to do this and kept initial thrust up valid as background for upside development. As a result of this struggle we’ve got another impulse upside action on recent week. Now we see that bearish response looks much weaker that first one and in fact looks like gradual choppy consolidation that reminds wide bullish flag pattern. This rally also was not erased. Based on this picture probability of upside action looks preferable than downward breakout. Possible targets are based on AB-CD, but currently only 0.618 target is valid, since 1.0 stands above daily overbought and it’s reaching seems not as probable in the beginning of the week.
Still this advance of bullish scenario is not absolute because action is really choppy and heavy.
Conclusion:
In long-term perspective expectation of US rate hike in 2015 and opposite postponing of this procedure in UK on 2016 makes us think that downward action will continue and it seems not impossible reaching of our target 1.30 within 2015-2016.
Meantime in short-term perspective market looks a bit overextended to the downside. Corresponding dovish comments from Fed could make possible compound upside retracement, although it’s development probably will be choppy and heavy.
The technical portion of Sive's analysis owes a great deal to Joe DiNapoli's methods, and uses a number of Joe's proprietary indicators. Please note that Sive's analysis is his own view of the market and is not endorsed by Joe DiNapoli or any related companies.
U.S. dollar edged lower against a basket of major currencies on Friday after traders were reluctant to buy the greenback ahead of U.S. jobs data next week, and after comments from Federal Reserve Chair Janet Yellen.
Yellen said the Fed is giving "serious consideration" to beginning to reduce its accommodative monetary policy and a rate hike may be warranted later this year, although a downturn in core inflation or wage growth could force it to hold off.
Analysts said the emphasis on considering rate hikes was slightly hawkish and led the dollar to pare some earlier losses, but that the remarks overall reiterated the message from the Fed's March 18 policy statement: that the timeline of the Fed's rate hikes would hinge on U.S. economic data.
Yellen delivered the prepared remarks at a monetary policy conference at the Federal Reserve Bank of San Francisco.
"It turned out to be pretty much a replay" of last week's Fed statement, said Alfonso Esparza, senior currency Strategist at Oanda in Toronto. "They’re waiting for the data," he said in reference to Fed policymakers.
The speech came after the latest Fed policy statement released March 18, which suggested a less aggressive timeline for hiking rates and led most of Wall Street's top banks to push out expectations for the first rate hike to September from June.
The dollar index, which measures the greenback against a basket of six major currencies, posted its second straight weekly loss.
The dollar had lost some ground ahead of the speech on predictions a dovish stance could push the dollar lower. The dollar index rallied over 25 percent from early May last year through March 17, but has since given back some gains since after the Fed's March 18 statement.
Analysts said the long-term uptrend in the dollar remained in place given the likelihood that the Fed will still hike rates this year, but that traders were awaiting key data, including next week's U.S. employment report for March.
"It's still a U.S.-dollar-long environment," said Camilla Sutton, chief currency strategist at Scotiabank in Toronto.
MORE ON FED HIKING…
According to Phantom Consulting and its story was released on Alpha Now resource they still think that Fed will take first hike on September:
Former Fed Chairman Greenspan would no doubt heartily approve of the uncertainty over the interpretation of the statement. The removal of the word ‘patient’ means that the Fed has opened the door to a rate hike by as soon as June. However, at the same time, FOMC members revised down their projections for growth, inflation and interest rates.
However, all this has done is remove the substantial disconnect between members’ projections and the market (and ourselves).
With the removal of the word ‘patient’, the timing of the rate hike decision will be data dependent. The Committee is clear that it will raise rates if the labour market continues to tighten and it is confident that inflation will move back towards 2%. Our own projections see core CPI inflation reaching 2% by August of this year.
Currently guys we have not big choice among major currencies. Recently we’ve said that CAD stands at the eve of really “big” pattern but it has not been confirmed last week, so we need to wait more. It is not necessary to update our NZD view since we’ve talked about it couple of days ago and our analysis mostly valid. The same we could say on EUR. Thus, we can take a look at GBP.
CFTC data shows massive drop of open positions. Detail analysis shows that drop has happened mostly in speculative positions as short as long approximately at equal amount of 25-30K contracts. Still short positions are almost 2 times greater than long ones. Conversely hedgers positions almost have not changed, just shy closing has happened upon it. This action mostly remains indecision sentiment.
Taking it all together we think that dollar position on recent Fed comments have become weaker. It has become not sufficient any more to feed markets with promising of rate hiking. If couple of months ago strong statistics accompanied by such promises have led to explosive dollar growth, but right now as statistics have become neutral and Yellen said that Fed will watch for data, particularly on inflation and wage cost – dollar position has become weaker as Yellen has put rate hiking process in dependence to statistics. Once it will become worse rate increasing could be postponed even further. This link increases uncertainty on US rate and adds indecision sentiment and review of previous assessment of situation by investors.
Hence, currently we can’t exclude even more solid upward retracement across different dollar-related assets, including FX currencies, gold etc.
Open interest:
Technicals
Monthly
Since it is still valid – I would like to keep showing you monthly chart and analysis that we’ve made in December 2013 in our Forex Military School Course, where we were learning Elliot Waves technique.
https://www.forexpeacearmy.com/forex-forum/forex-military-school-complete-forex-education-pro-banker/30110-chapter-16-part-v-trading-elliot-waves-page-7-a.html
Our long term analysis was suggested first appearing of new high on 4th wave at ~1.76 level and then starting of last 5th wave down. First condition was accomplished and we’ve got new high, but it was a bit lower – not 1.76 but 1.72. This was and is all time support/resistance area. Now we stand in final part of our journey. According to our 2013 analysis market should reach lows at 1.35 area. Let’s see what additional information we have right now.
Trend is bearish here, but GBP is not at oversold. Couple of weeks ago market has reached strong support area – Yearly Pivot support 1 and 5/8 major monthly Fib level, where we’ve taken our B&B “Sell” trade. As we’ve suggested – move below this level for 200 pips does not necessary mean breakout yet and that’s it, right now GBP has returned right back above it, which means that level is still valid.
In fact here we have just one major destination point. Monthly chart give us just single AB-CD pattern with nearest target at 0.618 extension – 1.3088. Still, here we have another one non-Fib orienteer – lower border of current consolidation. If we will treat it as sideways action then lower border will stand ~1.42-1.43 area. But first we need to get over current support level and see what market could give us here. Currently 1.30-1.31 area looks unbelievable, but if we would suggest parity on EUR/USD and starting rate hiking cycle in US – why not? Still, this is very long-term picture and right now we’re mostly interested in reaction of the market on current support level. First bounce up has happened already. Now the major task is to understand is it possible any greater upside retracement, or we should start preparation for downward breakout.
Weekly
Our major context stands on weekly chart. It seems that shy moving below former lows has happened due existence of 1.618 target of single AB-CD pattern that we have here. Combination of AB-CD objective point, weekly oversold and, take a look, bullish grabber give not bad chances on possible upside retracement. Grabber suggests taking out of previous highs at 1.5550, but two weeks ago we’ve said that it would be nice if market will reach K-resistance and that has happened. Action on previous week was relatively shy – in fact we have inside week. Although trend has turned bearish but both grabbers are still valid, as well as support level. GBP also has returned right back above previous lows of 2013.
The most important thing in weekly analysis could be 1.1618 extension of most recent upside retracement. Theoretically it could lead to appearing of H&S pattern on daily chart that in turn, could trigger greater upside action that we’ve mentioned above. That’s being said recent two weeks bring nothing important to weekly analysis and it shows approximately the same – support still holds as well as chances on upside action.
Daily
Here we see why investors have contracted their positions despite of direction. Recall reaction on Fed meeting on previous week. This candle is determinant right now. It’s range holds all recent price action last week. Top of this candle coincides with weekly K-resistance, while bottom stands on strong support area. Common approach to trading this kind of situation is watching for breakout. As market is coiling inside the range of big candle – its building an energy for breakout. Depending on what extreme point of this candle will be taking out – market will continue action in this direction. Here you also can see the half of possible H&S pattern. In the light of recent Fed comments it looks not as impossible as previously.
4-hour charts
On Intraday charts picture looks not as impressive as on larger time frames. Still, if we will go through recent action step by step we could find some nuances that could be useful. Action is very choppy. After first rally on Fed meeting, market has tried to erase it by strong deep retracement but was not able to do this and kept initial thrust up valid as background for upside development. As a result of this struggle we’ve got another impulse upside action on recent week. Now we see that bearish response looks much weaker that first one and in fact looks like gradual choppy consolidation that reminds wide bullish flag pattern. This rally also was not erased. Based on this picture probability of upside action looks preferable than downward breakout. Possible targets are based on AB-CD, but currently only 0.618 target is valid, since 1.0 stands above daily overbought and it’s reaching seems not as probable in the beginning of the week.
Still this advance of bullish scenario is not absolute because action is really choppy and heavy.
Conclusion:
In long-term perspective expectation of US rate hike in 2015 and opposite postponing of this procedure in UK on 2016 makes us think that downward action will continue and it seems not impossible reaching of our target 1.30 within 2015-2016.
Meantime in short-term perspective market looks a bit overextended to the downside. Corresponding dovish comments from Fed could make possible compound upside retracement, although it’s development probably will be choppy and heavy.
The technical portion of Sive's analysis owes a great deal to Joe DiNapoli's methods, and uses a number of Joe's proprietary indicators. Please note that Sive's analysis is his own view of the market and is not endorsed by Joe DiNapoli or any related companies.