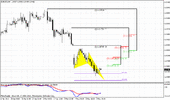
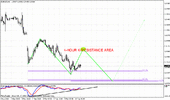
FOREX PRO Weekly May 07-11, 2012

No luck in the the chat room. I just entered and it looks like I'm the only one there... is it an active channel?

there sure is. here: cbe005.chat.mibbit.com
when you get there, type in your FPA username, and the chat room name, which is: #FPASteamroom.
pay attention to the capitalization. all first 4 letters should be capitalized or you'll end up in a different room. :D
 
Thanks Triantus, But Mibbit is taking so long to load. there is no interface to type FPA username or #FPASteamroom. But am I doing wrongly? Its still loading as I write!
there sure is. here: cbe005.chat.mibbit.com

when you get there, type in your FPA username, and the chat room name, which is: #FPASteamroom.

pay attention to the capitalization. all first 4 letters should be capitalized or you'll end up in a different room. :D
 
Still market has formed another stop grabber pattern and it's destination could become a high marked by yellow circle. If you will take a look at hourly chart - you can see that we already have butterfly in progress. If 4-hour Stop grabber will work, then this batterfly will become wider, so, that current price action will become left wing and right wing will just ready to form.
If Stop grabber will fail - well, that hourly butterfly will be in progress. Anyway, despite the shape of butterfly,destination will be the same, since we have the same initial swing for both of them.

Hi Sive, the SG marked by the yellow circle is a bearish one, so I don't understand your analysis based on it. Butterfly should be completed by going down to 1.292 (127%) (ok?), i don´t understand how SG plays with this.
 
Hi Sive, the SG marked by the yellow circle is a bearish one, so I don't understand your analysis based on it. Butterfly should be completed by going down to 1.292 (127%) (ok?), i don´t understand how SG plays with this.

Hi Aldo,
by yellow circle the target of SG was marked, anyway you can forget it, since it has been erased right at the moment, when market took out it's low.

I guess that's the Butterfly complete....and PA has stalled...
will anyone be trying a Long?

This is just first destination point. There is 1.618 around 1.29 as well.
 
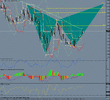
Potential Gartley 222 or Butterfly Sell on M15

guys, take a look at this M15 chart. if market keeps going up, we might have the right wing of a gartley or butterfly sell pattern.

note that the 200 MA comes in right at the FE 100. i haven't overlaid the fib retrace nodes but we have a 61.8 node from the drop from 3037 near FE100 and a few pips above that is the DPP.

H1 MACD also turned bullish and we have divergences on different TIs.
 

Attachments

  • eurusd_m15_gartley-buttterfly_sell.gif
    eurusd_m15_gartley-buttterfly_sell.gif
    54 KB · Views: 54
Last edited:
EUR/USD Daily Update, Thu 10, May 2012

Good morning,
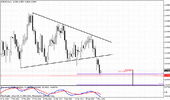
as pilots say - "we on target". Market has reached our support zone 1.29-1.2950, but not quite reached. I'm speaking about targets of two different AB=CD patterns that appeared inside of triangle and their targets stand slightly lower than current market.
That's why I suppose that market should hit it before starting show any reversal/retracement attempts on daily time frame. This is not always happen but as a rule it happens.

On 4-hour TF market has reached 1.27 point of butterfly. Due daily analysis, there is a probability that market should reach 1.618 extension and only after that some reversal/retracement is possible. At the same time we can't exclude some retracement as respect of 1.27 level. Major area to watch is K-resistance around 1.3010-1.3015. If you will take a look at hourly chart you'll see why it is important.

This could shift to 3-Drive buy pattern, if market will show retracement to 1.3010 area. Also we have nice divergence with MACD that is very common for 3-Drives.

So, conclusion is as follows - retracement to 1.3010-1.3015 area is possible, but there is a great probability that market will reach 1.2890-1.2900 area before any solid reversal action (if it will happen at all of cause). If even we will be wrong, market probably still will respect 1.29 area since this is signficant support.
 

Attachments

  • eur_d_10_05_12.gif
    eur_d_10_05_12.gif
    24.2 KB · Views: 75
  • eur_4h_10_05_12.gif
    eur_4h_10_05_12.gif
    23.6 KB · Views: 86
  • eur_1h_10_05_12.gif
    eur_1h_10_05_12.gif
    23.9 KB · Views: 85
conclusion is as follows - retracement to 1.3010-1.3015 area is possible, but there is a great probability that market will reach 1.2890-1.2900 area before any solid reversal action (if it will happen at all of cause). If even we will be wrong, market probably still will respect 1.29 area since this is signficant support.[/QUOTE]


Thank you very much sive sir..
 
Back
Top