Sive Morten
Special Consultant to the FPA
- Messages
- 18,748
Fundamentals
Reuters reports dollar turned higher on Friday, spurred off early losses after a U.S. inflation report that indicated underlying pressures are building bolstered the case for the U.S. Federal Reserve to raise interest rates later this year.
Remarks by Fed Chair Janet Yellen later in the day that a rate increase was on track this year added support for the greenback.
"Stronger inflation, along with stronger growth data, is something that the Fed certainly wants to see," said Brian Daingerfield, currency strategist at the Royal Bank of Scotland in Stamford, Connecticut. "Rate hike expectations have likely been brought forward as a result of some of the stronger data today."
While the U.S. Consumer Price Index gained only 0.1 percent in April, down from the prior month, the core CPI, which strips out volatile food and energy costs, increased 0.3 percent, the largest rise since January 2013, after advancing 0.2 percent in March.
Yellen said she expected the U.S. central bank to raise interest rates this year, as the U.S. economy was on course to bounce back from a sluggish first quarter and headwinds at home and abroad waned.
Demand for U.S. dollars firmed on the speech.
"June appears to be out of the question," Alan Gayle, senior investment strategist at Ridgeworth Investments in Atlanta, said of a possible rate hike. "I think September is still a question mark, but Yellen seems to be confident that the economy will improve enough that the Federal Reserve will safely begin to raise interest rates this year. That is putting a little gas behind the dollar."
CFTC data shows Speculators further scaled back bullish bets on the U.S. dollar in the latest week, pushing the currency's net long position to the lowest over nine months, according to Reuters calculations and data from the Commodity Futures Trading Commission released on Friday.
The value of the dollar's net long position fell to $25.81 billion in the week ended May 19, from $29.11 billion the previous week. Net longs on the dollar declined for a eighth straight week.
CFTC data on EUR shows further drop of net short speculative position, but this drop mostly stands due faster decreasing of shorts compares to longs, rather than longs growth. Both sides have decreased. Open interest mostly grew due hedgers’ position. They have increased shorts. Hedgers take positions against this trend and this action could be treated as relative support of bulls. Still we have to say that overall changes are not really significant meantime.
 Technicals
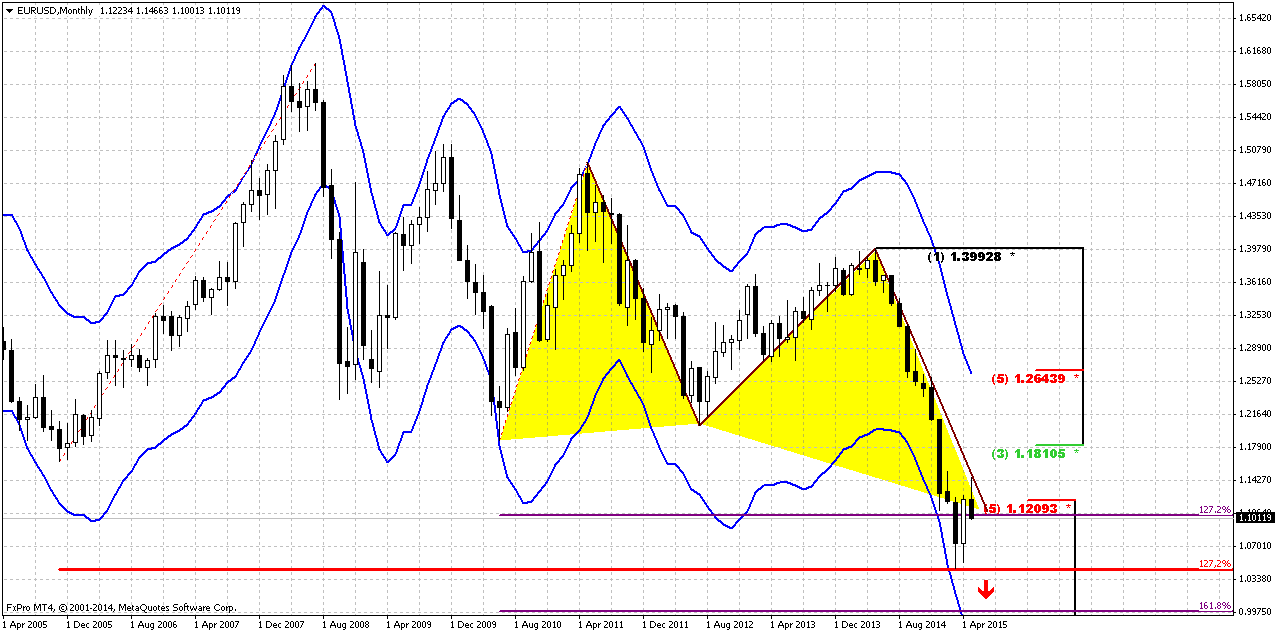
Monthly
As we have estimated previously 1.05 is 1.27 extension of huge upside swing in 2005-2008 that also has created awful butterfly pattern. Recent action does not quite look like normal butterfly wing, but extension is valid and 1.05 is precisely 1.27 ratio. At the same time we have here another supportive targets, as most recent AB=CD, oversold and 1.27 of recent butterfly.
Now think what do we have – market at 1.27 butterfly target and oversold, CFTC data shows overextension of shorts positions, although they were contracted a bit in recent couple of weeks. CFTC data also points on more active short covering positions.
April has closed and confirmed nicely looking bullish engulfing pattern. We know that most probable target of this pattern is length of the bars counted upside. This will give us approximately 3/8 Fib resistance 1.1810 area. Could we call this situation as “Stretch”? By features probably yes, since market is oversold at support, but by letter not quite, since 1.12 level mostly was broken and the area where market stopped was not a Fib level. Still, applying here Stretch target (middle between OB and OS bands) we will get an area of 50% resistance of most recent swing down around 1.22 area.
Another very important moment here is recent thrust down itself. Take a look – it is perfect for DiNapoli directional pattern, say, B&B “Sell”, or even DRPO… but B&B seems more probable. You can imagine what B&B means on monthly chart – large swings, definite direction of trading for weeks. Retracement up has no limitation from monthly overbought level. We think that we need to be focus mostly on B&B from 1.22 area, just because market is oversold. That’s why 3/8 level could not hold upside retracement. In 1.22 area also stand previous lows. But market has not crossed 3x3 in May, so may be we will get something in June.
Still, our next long-term target stands the same – parity as 1.618 completion point of recent butterfly. Currently we should treat this bounce up, even to 1.22 area, only as retracement within bear trend. Yes, tactically fundamentals have become weaker in US, and open door for pause in bearish trend, but overall picture has not changed drastically yet.
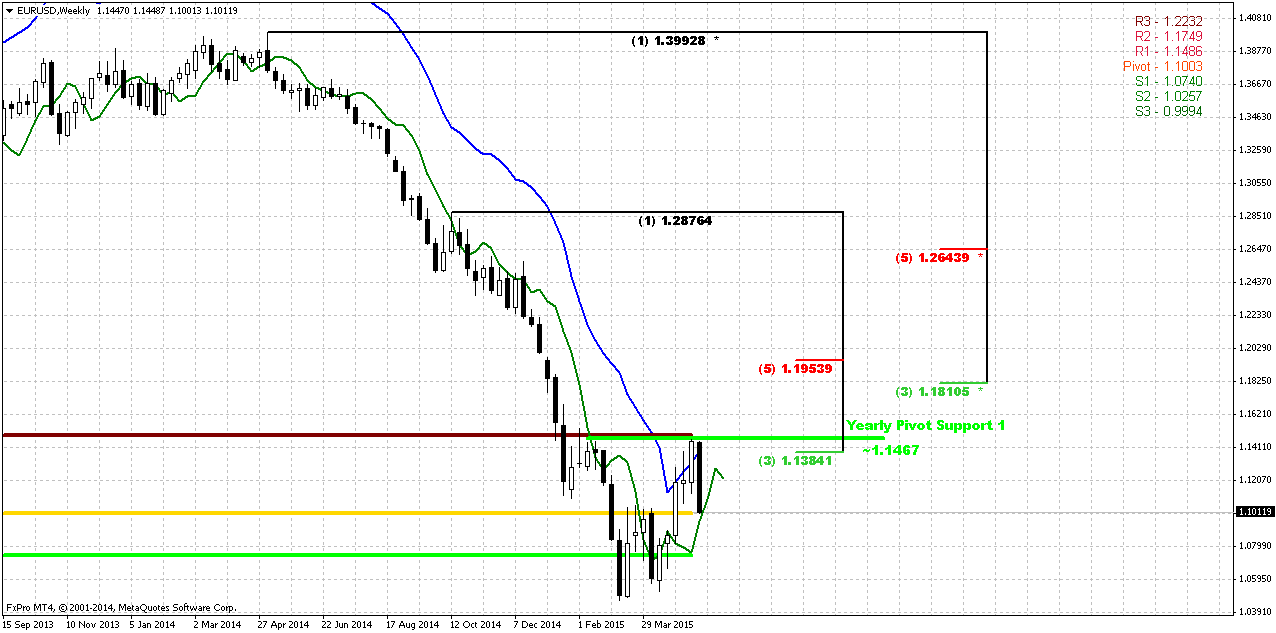
Weekly
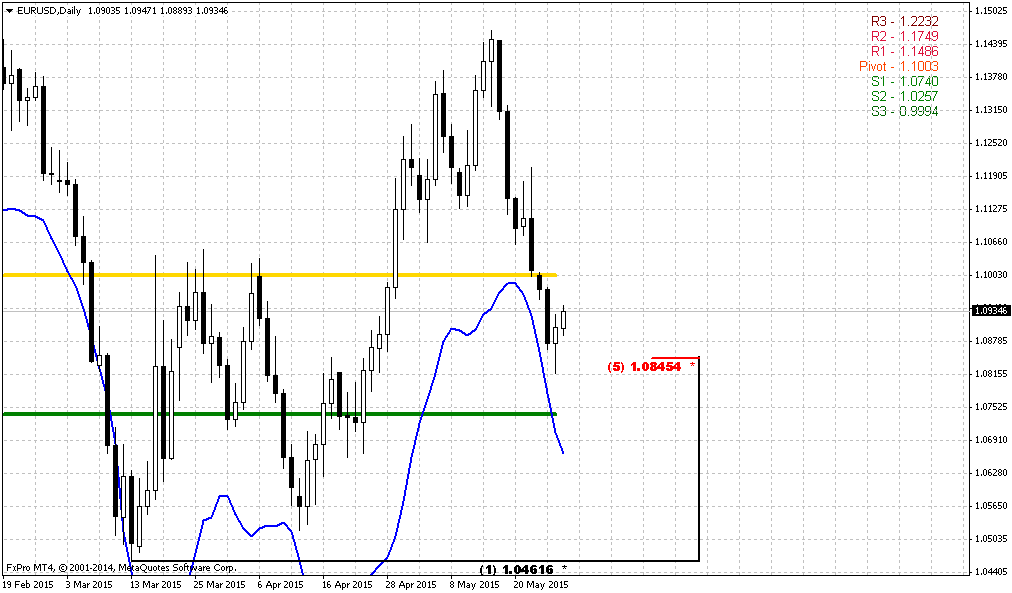
Trend is bullish on weekly chart and as we’ve estimated last week ¬we have confirmed DRPO “Buy” in place. Still our suggestion was correct and market has dropped due existence of strong resistance cluster around 1.14 area that includes Fib level, MPR1, broken YPS1 and Overbought. Second level coincides with monthly one around 1.18-1.20. Weekly chart shows that it will be also K-area. And this area approximately coincides with 50% level of DPRO thrust that is the target of this pattern. So, as monthly picture as weekly one point on high probability of reaching 1.18-1.20 area in medium term perspective. But as we’ve said previously – “action to this area should start after retracement down. This retracement, in turn, will be major object of our attention since we’re looking chance for taking long position here.”
Now this retracement is on the way, but we can’t say yet whether it has been finished or not. Drop down was really fast that erased the range of previous 2 weeks. Speaking from large picture point of view, bullish setup will be valid until monthly engulfing will be valid. And this will last till market stands above recent lows. Because engulfing pattern treats as valid, until market stands above its lows. It means that here EUR could show different depth of retracement. Right now it mostly at 3/8-1/2 Fib support, but it could reach 5/8 as well, because it was at overbought and retracement could become deeper.
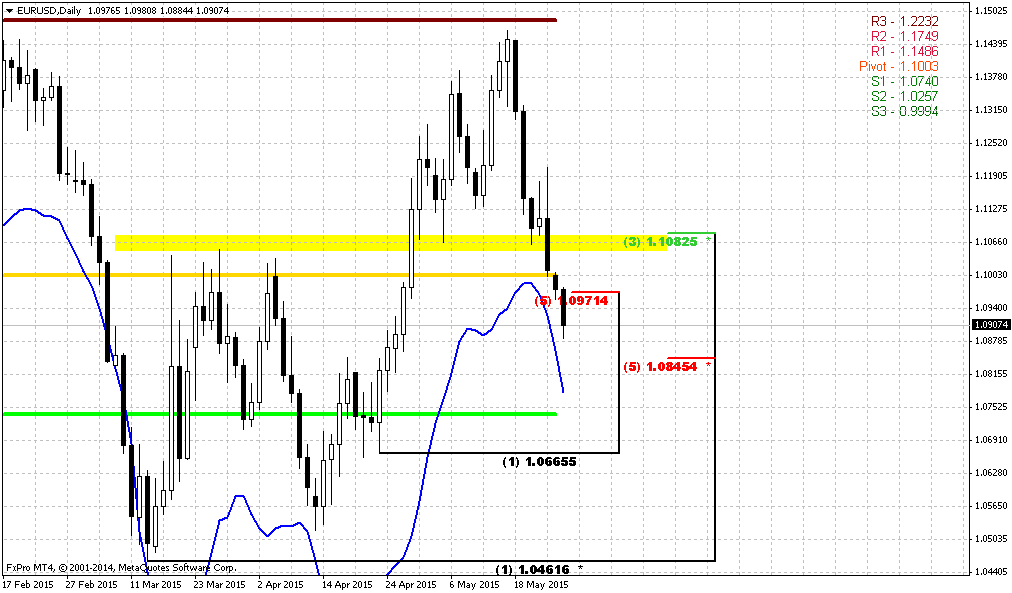
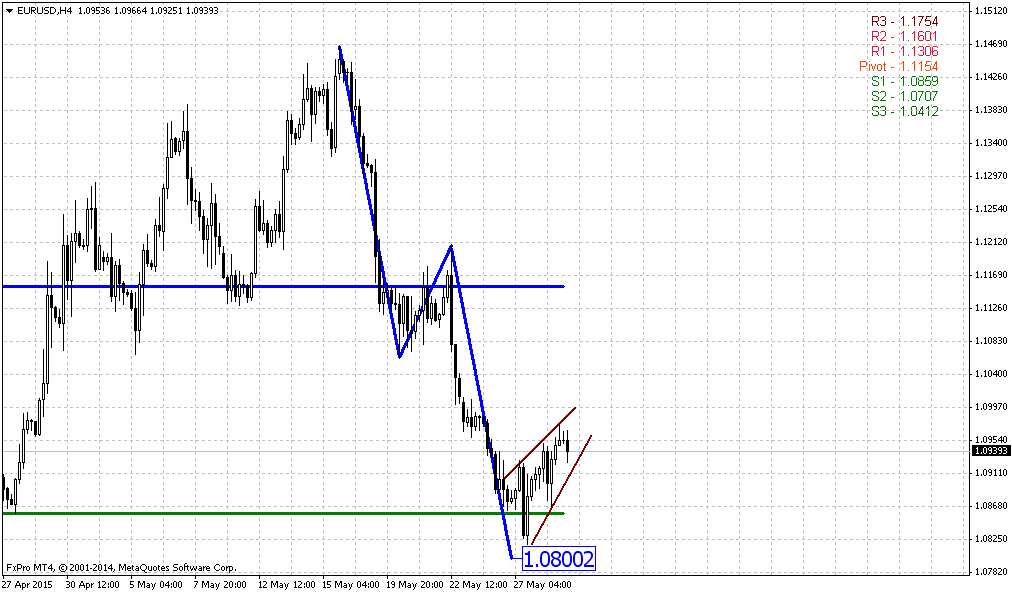
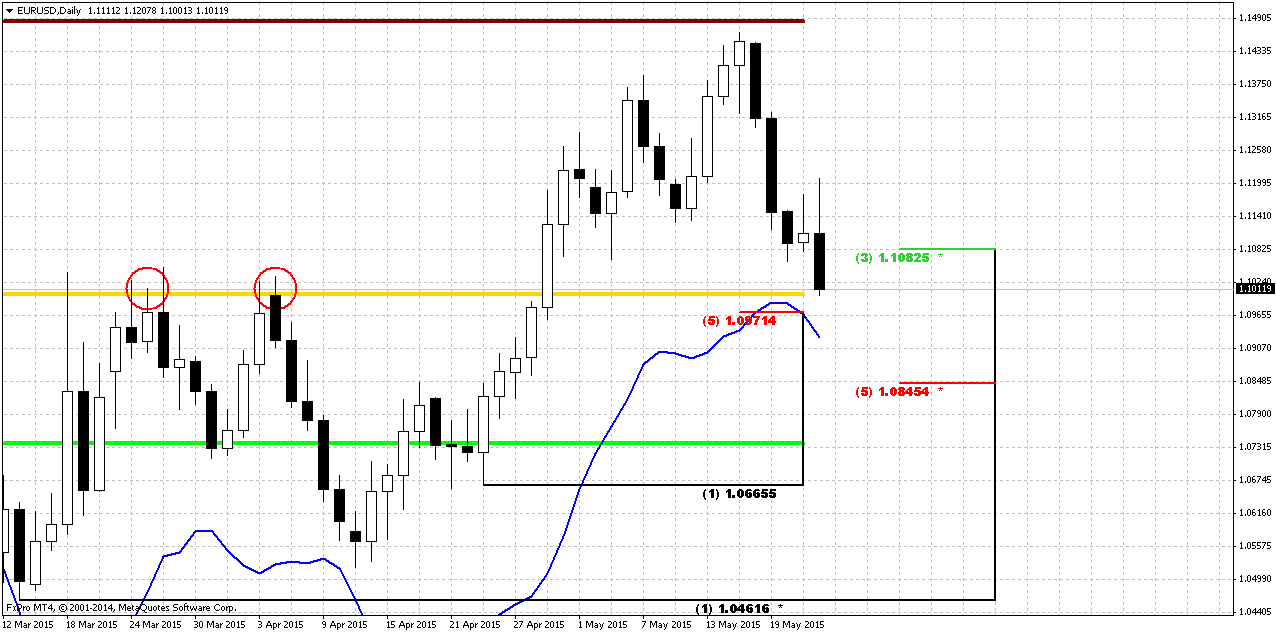
Daily
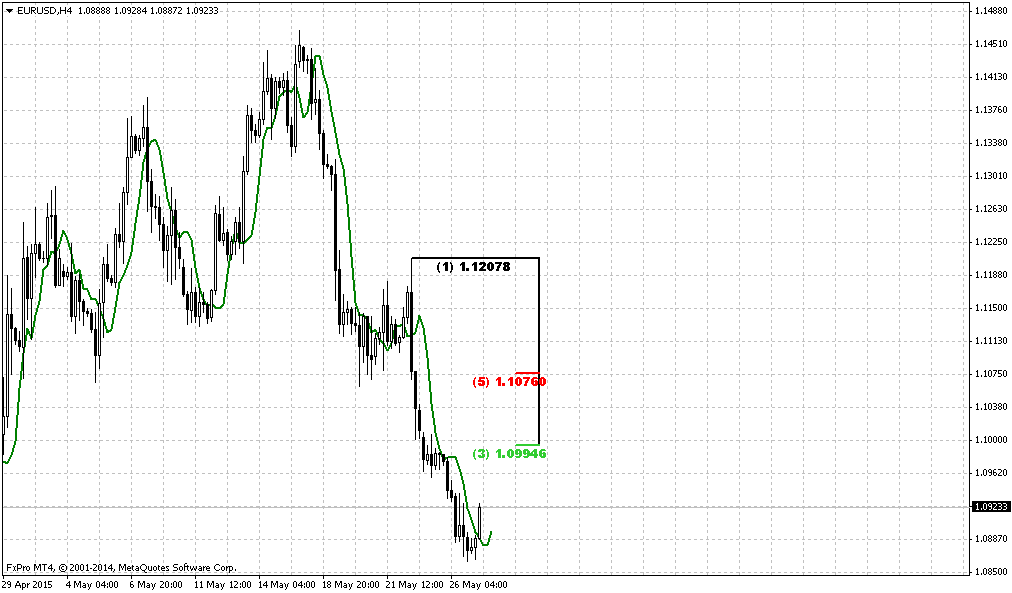
So, trading plan of previous week has been completed – market now stands at 1.10 area. Our 3-Drive pattern was completed as well. Currently the major question is whether market will continue move lower or not? Let’s see what support we have from both sides. In favor of deeper downward action stands overbought on weekly chart, the pace of downward action and reversal swing here. DRPO pattern that was formed on 4-hour chart has failed on CPI release. Upward reversal here is supported by strong K-level, MPP. Market also stands near daily oversold. This combination of factors makes possible compound AB=CD move down. It means that soon we should see some upward bounce out from this support area, but it could be just BC leg, while later downward action could continue with CD-leg extension. But you can ask: “How do we know that this will be just BC leg but not reversal up?” Yes, this is major problem. That’s why we could apply following trading plan. It’s a bit complex, but I do not see any other solution in current situation.
So, as market stands at strong support and theoretically (although chances are not really great) it could reverse up we should watch for reversal patterns on lower time frames. As soon as we will get it – we could try to take long position. As soon as possible – at first respect of this strong support we will have to move stops to breakeven. If market will continue move lower – we will loose nothing and be watching for next entry area. Next area probably will be somewhere around 5/8 Fib support and MPS1 1.0730-1.0840. We think that chances on deeper AB=CD retracement are greater rather than on immediate upside reversal, because market has formed reversal swing. It leads to compound retracement in most cases.
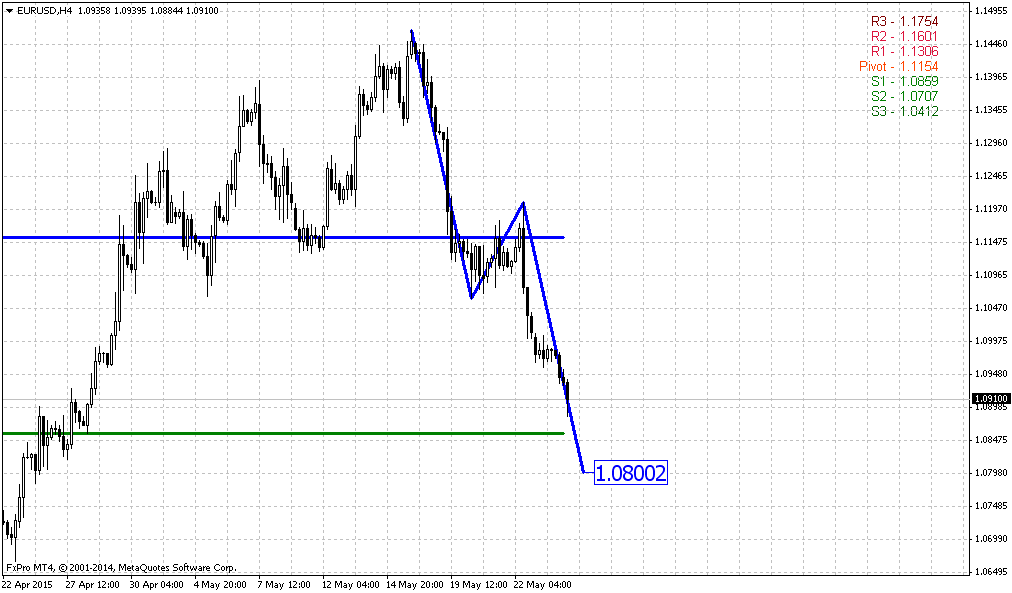
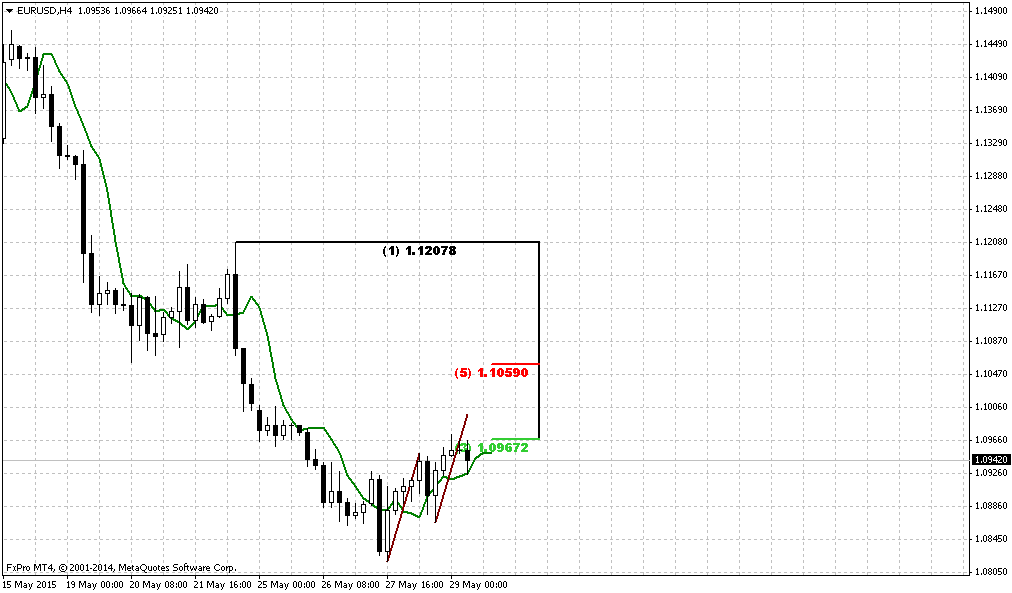
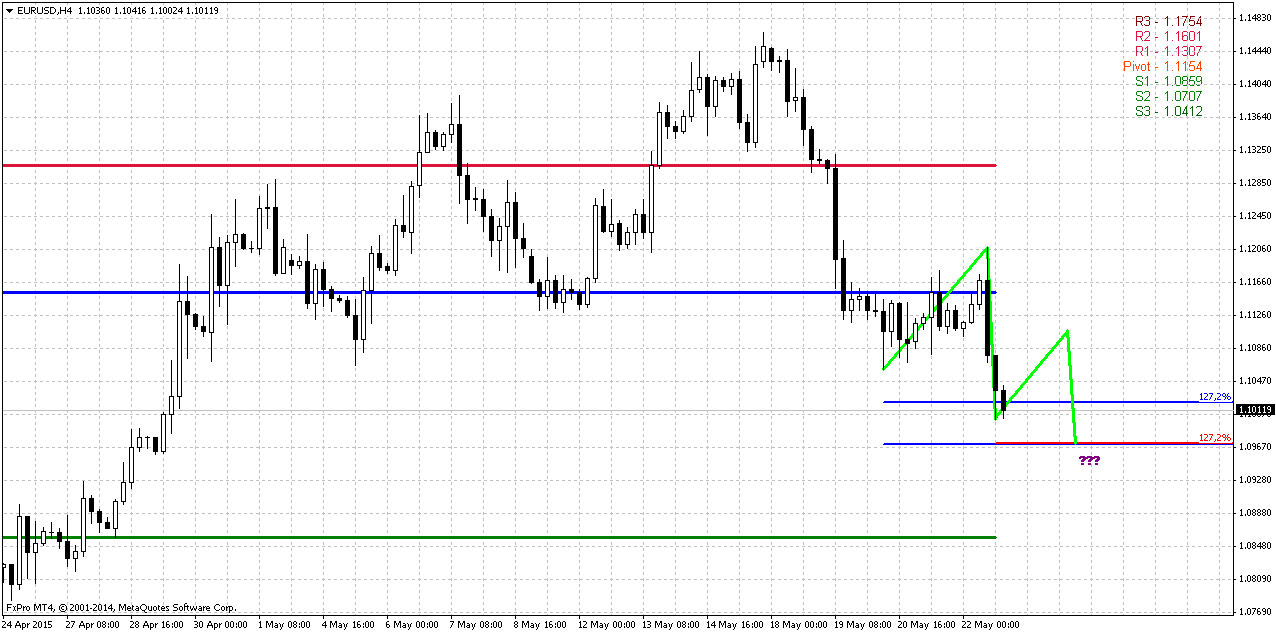
4-Hour
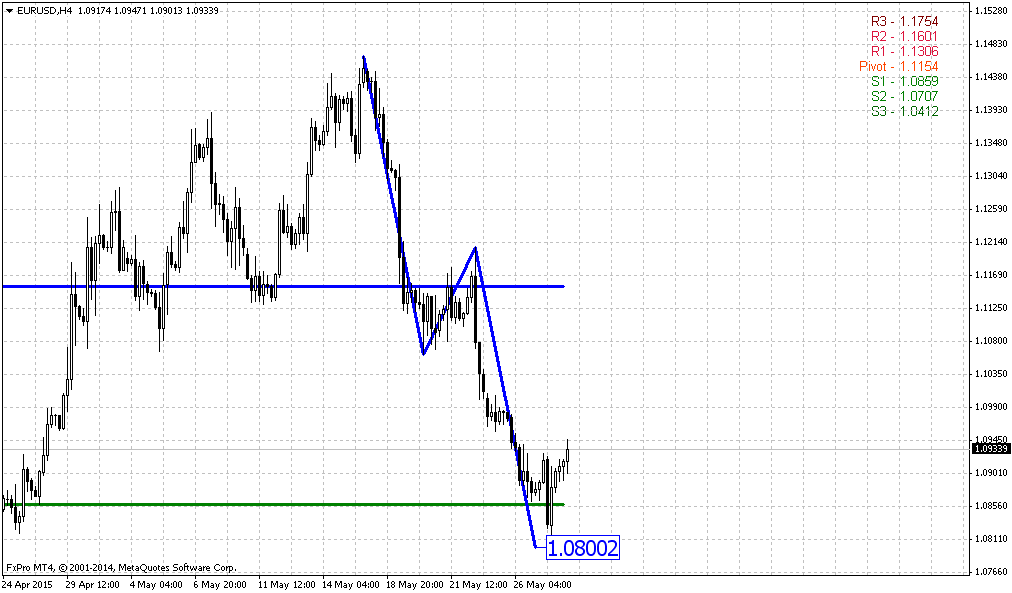
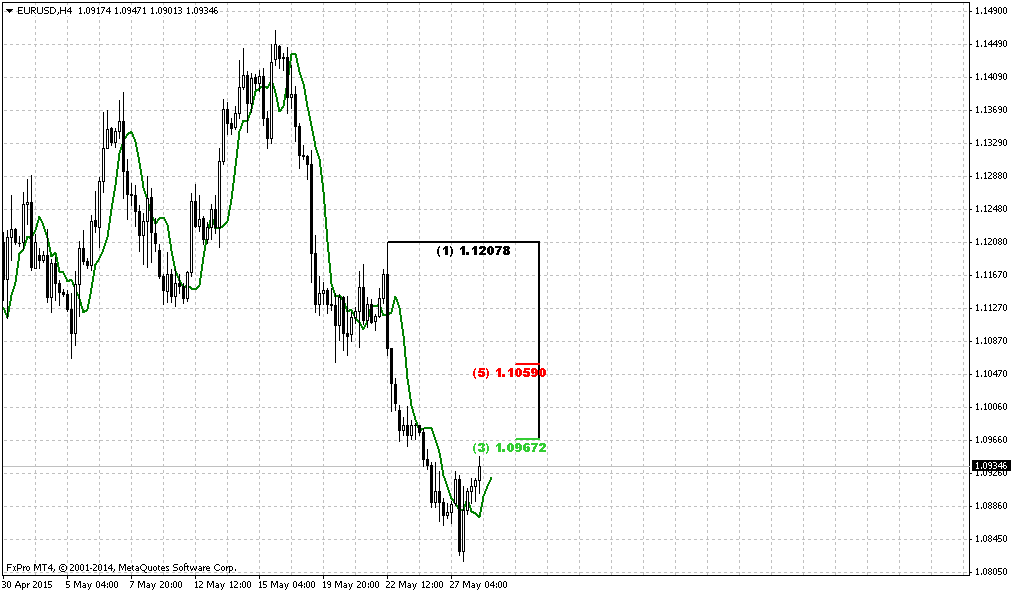
So, here the only pattern that we could imagine right now is 3-Drive ‘Buy’. Destination point coincides with 1.0967 level on daily chart. But, guys, downward action is too fast for reversal. That’s why the shape of pattern is a bit steep and skewed down. May be market will form something else later in the week. Anyway conclusion here is simple – no pattern means no long entry.
Conclusion:
EUR could turn to solid upside retracement that will be notified even on monthly chart. For us it will mean clear direction of trading for considerable period.
Still, major fundamental factors are still valid and even action to 1.20 should be treated as retracement…
In short-term perspective EUR has accomplished first stage of our long-term trading plan and has reached 1.10 area. Now we’re coming to second stage – searching pattern for long entry. At the same time recent action (as it was rather fast) makes more probable deeper retracement down, even to 1.08 area.
The technical portion of Sive's analysis owes a great deal to Joe DiNapoli's methods, and uses a number of Joe's proprietary indicators. Please note that Sive's analysis is his own view of the market and is not endorsed by Joe DiNapoli or any related companies.
Reuters reports dollar turned higher on Friday, spurred off early losses after a U.S. inflation report that indicated underlying pressures are building bolstered the case for the U.S. Federal Reserve to raise interest rates later this year.
Remarks by Fed Chair Janet Yellen later in the day that a rate increase was on track this year added support for the greenback.
"Stronger inflation, along with stronger growth data, is something that the Fed certainly wants to see," said Brian Daingerfield, currency strategist at the Royal Bank of Scotland in Stamford, Connecticut. "Rate hike expectations have likely been brought forward as a result of some of the stronger data today."
While the U.S. Consumer Price Index gained only 0.1 percent in April, down from the prior month, the core CPI, which strips out volatile food and energy costs, increased 0.3 percent, the largest rise since January 2013, after advancing 0.2 percent in March.
Yellen said she expected the U.S. central bank to raise interest rates this year, as the U.S. economy was on course to bounce back from a sluggish first quarter and headwinds at home and abroad waned.
Demand for U.S. dollars firmed on the speech.
"June appears to be out of the question," Alan Gayle, senior investment strategist at Ridgeworth Investments in Atlanta, said of a possible rate hike. "I think September is still a question mark, but Yellen seems to be confident that the economy will improve enough that the Federal Reserve will safely begin to raise interest rates this year. That is putting a little gas behind the dollar."
CFTC data shows Speculators further scaled back bullish bets on the U.S. dollar in the latest week, pushing the currency's net long position to the lowest over nine months, according to Reuters calculations and data from the Commodity Futures Trading Commission released on Friday.
The value of the dollar's net long position fell to $25.81 billion in the week ended May 19, from $29.11 billion the previous week. Net longs on the dollar declined for a eighth straight week.
CFTC data on EUR shows further drop of net short speculative position, but this drop mostly stands due faster decreasing of shorts compares to longs, rather than longs growth. Both sides have decreased. Open interest mostly grew due hedgers’ position. They have increased shorts. Hedgers take positions against this trend and this action could be treated as relative support of bulls. Still we have to say that overall changes are not really significant meantime.
Monthly
As we have estimated previously 1.05 is 1.27 extension of huge upside swing in 2005-2008 that also has created awful butterfly pattern. Recent action does not quite look like normal butterfly wing, but extension is valid and 1.05 is precisely 1.27 ratio. At the same time we have here another supportive targets, as most recent AB=CD, oversold and 1.27 of recent butterfly.
Now think what do we have – market at 1.27 butterfly target and oversold, CFTC data shows overextension of shorts positions, although they were contracted a bit in recent couple of weeks. CFTC data also points on more active short covering positions.
April has closed and confirmed nicely looking bullish engulfing pattern. We know that most probable target of this pattern is length of the bars counted upside. This will give us approximately 3/8 Fib resistance 1.1810 area. Could we call this situation as “Stretch”? By features probably yes, since market is oversold at support, but by letter not quite, since 1.12 level mostly was broken and the area where market stopped was not a Fib level. Still, applying here Stretch target (middle between OB and OS bands) we will get an area of 50% resistance of most recent swing down around 1.22 area.
Another very important moment here is recent thrust down itself. Take a look – it is perfect for DiNapoli directional pattern, say, B&B “Sell”, or even DRPO… but B&B seems more probable. You can imagine what B&B means on monthly chart – large swings, definite direction of trading for weeks. Retracement up has no limitation from monthly overbought level. We think that we need to be focus mostly on B&B from 1.22 area, just because market is oversold. That’s why 3/8 level could not hold upside retracement. In 1.22 area also stand previous lows. But market has not crossed 3x3 in May, so may be we will get something in June.
Still, our next long-term target stands the same – parity as 1.618 completion point of recent butterfly. Currently we should treat this bounce up, even to 1.22 area, only as retracement within bear trend. Yes, tactically fundamentals have become weaker in US, and open door for pause in bearish trend, but overall picture has not changed drastically yet.
Weekly
Trend is bullish on weekly chart and as we’ve estimated last week ¬we have confirmed DRPO “Buy” in place. Still our suggestion was correct and market has dropped due existence of strong resistance cluster around 1.14 area that includes Fib level, MPR1, broken YPS1 and Overbought. Second level coincides with monthly one around 1.18-1.20. Weekly chart shows that it will be also K-area. And this area approximately coincides with 50% level of DPRO thrust that is the target of this pattern. So, as monthly picture as weekly one point on high probability of reaching 1.18-1.20 area in medium term perspective. But as we’ve said previously – “action to this area should start after retracement down. This retracement, in turn, will be major object of our attention since we’re looking chance for taking long position here.”
Now this retracement is on the way, but we can’t say yet whether it has been finished or not. Drop down was really fast that erased the range of previous 2 weeks. Speaking from large picture point of view, bullish setup will be valid until monthly engulfing will be valid. And this will last till market stands above recent lows. Because engulfing pattern treats as valid, until market stands above its lows. It means that here EUR could show different depth of retracement. Right now it mostly at 3/8-1/2 Fib support, but it could reach 5/8 as well, because it was at overbought and retracement could become deeper.
Daily
So, trading plan of previous week has been completed – market now stands at 1.10 area. Our 3-Drive pattern was completed as well. Currently the major question is whether market will continue move lower or not? Let’s see what support we have from both sides. In favor of deeper downward action stands overbought on weekly chart, the pace of downward action and reversal swing here. DRPO pattern that was formed on 4-hour chart has failed on CPI release. Upward reversal here is supported by strong K-level, MPP. Market also stands near daily oversold. This combination of factors makes possible compound AB=CD move down. It means that soon we should see some upward bounce out from this support area, but it could be just BC leg, while later downward action could continue with CD-leg extension. But you can ask: “How do we know that this will be just BC leg but not reversal up?” Yes, this is major problem. That’s why we could apply following trading plan. It’s a bit complex, but I do not see any other solution in current situation.
So, as market stands at strong support and theoretically (although chances are not really great) it could reverse up we should watch for reversal patterns on lower time frames. As soon as we will get it – we could try to take long position. As soon as possible – at first respect of this strong support we will have to move stops to breakeven. If market will continue move lower – we will loose nothing and be watching for next entry area. Next area probably will be somewhere around 5/8 Fib support and MPS1 1.0730-1.0840. We think that chances on deeper AB=CD retracement are greater rather than on immediate upside reversal, because market has formed reversal swing. It leads to compound retracement in most cases.
4-Hour
So, here the only pattern that we could imagine right now is 3-Drive ‘Buy’. Destination point coincides with 1.0967 level on daily chart. But, guys, downward action is too fast for reversal. That’s why the shape of pattern is a bit steep and skewed down. May be market will form something else later in the week. Anyway conclusion here is simple – no pattern means no long entry.
Conclusion:
EUR could turn to solid upside retracement that will be notified even on monthly chart. For us it will mean clear direction of trading for considerable period.
Still, major fundamental factors are still valid and even action to 1.20 should be treated as retracement…
In short-term perspective EUR has accomplished first stage of our long-term trading plan and has reached 1.10 area. Now we’re coming to second stage – searching pattern for long entry. At the same time recent action (as it was rather fast) makes more probable deeper retracement down, even to 1.08 area.
The technical portion of Sive's analysis owes a great deal to Joe DiNapoli's methods, and uses a number of Joe's proprietary indicators. Please note that Sive's analysis is his own view of the market and is not endorsed by Joe DiNapoli or any related companies.