Sive Morten
Special Consultant to the FPA
- Messages
- 18,776
Monthly
The euro fell to a three-month low against the dollar and a 17-month trough against the pound on Friday after a disappointing report on German business sentiment supported the view the European Central Bank will cut interest rates next month. Concerns that Sunday's European Union election results could destabilize some euro zone governments also weighed on the euro. Germany's leading indicator of business confidence, the Ifo index, pointed to slower growth in Europe's largest economy as the index hit its lowest level this year in May. "That put pressure on the euro. It reinforces expectations the ECB will ease policy sooner rather than later," said Eric Viloria, currency strategist at Wells Fargo Securities in New York.
Trading volume, as expected, faded faster than usual before the weekend. There is a U.K. bank holiday on Monday while U.S. financial markets will be closed for Memorial Day. Investors also trimmed euro holdings before EU election results due at about 2100 GMT on Sunday, traders said. A strong showing by fringe parties would highlight the anti-euro and anti-austerity sentiment in countries like Italy and Greece that have regained market confidence. "There are some concerns about the extremist parties gaining ground," said Alan Ruskin, global head of G19 currency strategy with Deutsche Bank in New York.
Weaker euro zone members have shown progress in managing their high debt loads. Earlier, Standard & Poor's upgraded Spain's credit rating by a notch to BBB, helping to stem euro's fall and to spur a rally in peripheral euro zone debt.
DOLLAR STEADY
The euro's modest losses boosted the dollar index, which tracks the greenback against a basket of major currencies, to its highest in six weeks at 80.443 before easing to 80.364. The benchmark U.S. 10-year yield finished at 2.536 percent, down 2 basis points on the day despite a stronger-than-expected new home sales report. It touched a 1-1/2 week high of 2.566 percent on Thursday, almost 10 basis points above the 6-1/2 month low set last week.
Technical
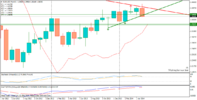
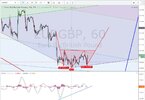
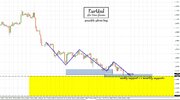
Although April was upward month, but overall action mostly should be classified as “inside” one to March range. Almost whole April price has spent in the same range. At the same time May action is starting to show its power. Although this has happened not quite independently but having ECB hand in EUR dynamic, still, technically we see attempt of reversal on monthly chart and recent EU fundamental data just have added more power to it. We saw something cognate on February action, but it didn’t lead to any downward continuation. At the same time, currently situation is slightly different because there was no solid upward action in April, and now we have a month candle that has moved above April high. If May will close below April low – we will get monthly reversal bar and this could lead at least to some downward continuation. Part of this work has been done already and is continued on recent week. As May stands close to an end – this could become a reality very soon. It is also interesting that we have confirmation from other currencies of this action on different time frames. Thus, CHF shows double bottom, while GBP gives perfect bearish AB=CD, accompanied by stop grabber on daily.
By looking at bigger picture, market stands in tight range since 2014. Thus, 1.33-1.3850 is an area of “indecision”. While market stands inside of it we can talk about neither upward breakout nor downward reversal. At least, reversal identification could be done with yearly pivot – if market will move below it, this could be early sign of changing sentiment. But, as you can see, nothing among this issues have happened yet.
Speaking about upward continuation, market mechanics does not allow price to show any deep retracement any more. Any move of this kind should be treated as market weakness and it will increase probability of reversal down. Take a look that as market has hit minor 0.618 AB-CD extension target right at former rock hard resistance – Fib level and Agreement and former yearly PR1, it has shown reasonable bounce down to 1.33. As retracement after 0.618 target already has happened, it is unlogical and unreasonable to see another deep bounce and if it will happen - it will look suspicious.
So, speaking about monthly upside targets... If we will get finally real break through resistance, we have two major targets – AB=CD one around 1.44 and Yearly PR1 = 1.4205. But right now it doesn’t look like upward breakout could happen soon.
Finally, price is coverging with MACD line, it will be interesting if they will meet somewhere around Yearly Pivot.
That’s being said, to change really big picture and long-term sentiment market will have to leave 1.3350-1.3850 area in one or other direction. While appearing of reversal May bar will give us confidence to suggest further downward action inside of 1.3350-1.3850 range by far.

Weekly
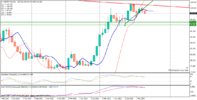
On weekly chart we have full pack of bearish signs. It’s a bit uncomfortable that they are too obvious, but they are facts that we can’t ingore still. Besides, fundamentally EUR/USD pair also has reasons to move lower. Although Lutz Karpowitz, a currency strategist with Commerzbank in Frankfurt said: “As long as quantitative easing continues in the U.S., we expect the dollar to remain under pressure”, - but currently it’s not quite the same QE. It was contracted twice and dollar supply has decreased. At the same time ECB stands near stopping of its liquidity sterilization action and this should increase the supply of EUR, or, at least it should stop contracting it. These opposite measures play in favor of EUR/USD downward action probably. Recent EU data also increases chances on dovish policy from ECB.
By looking at technical issues, we have a lot of bearish signs – some of them are still valid others – hit targets already. Butterfly “Sell” at MPR1, accompanied by bearish wedge and divergence with MACD. Grabber has hit the target already. At the same time we have reversal bar and W&R on previous top – they have extremely importance on daily chart, as we will see a bit later.
Thus, I will not dare to speak about long-term reversal, but at least minor continuation should follow. Nearest support stands around 1.35-1.3520 area and includes two major points – Fib support and YPP at 1.3475. Also if we build extension of the tops – we will get 1.618 support extension right in the same area. This is also minimum butterfly target and right now we do not see reasons on weekly chart, why this area couldn’t be reached. Right now market is not at oversold and there is no significant support that could hold it from downward action.

Daily
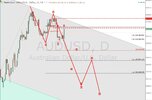
Partially, we’ve started this discussion on Friday. So, we have double top pattern that has target around 1.34 area. This pattern could lead us to serious consecutives, because action around 1.34 suggests moving below YPP and that could mean shift in a long-term sentiment. Other currencies, such as CHF and GBP also suggest downward action on next week, especially GBP. There are two very important issues here. First is W&R of first top. This is very typical for Double Top pattern and adds reliability to it. Second – price stands below MPS1. This means that may be new bear trend is born.
Also, guys, I intentionally keep this 5/8 Fib support to show you, that there is no significant support below the market any more. And although market stands close to OS but it is not oversold right now. So, in fact nothing prevents market from downward continuation. Neckline is also broken already.

1-hour
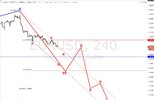
Although we’ve come to bearish conclusion on EUR – it is not absolutely neccesary that market should immediately drop down. In fact, it seems that price could re-test broken neckline. This happens rather often. Take a look at hourly picture. We have butterfly “Buy” reversal pattern. As market too fast has come to 1.27 target – candle too long and strong, very probable that EUR will proceed right to 1.618 target. After that some retracement is possible. As an objective point of retracement we could look on neckline and WPP point range – 1.3660-1.3670. If price will move above 1.3734 – this could lead to failure of Double Top pattern.

Conclusion:
While price stands in 1.33-1.38 area we can’t speak either on upward or downward breakout. To change really big picture market should have to show breakout out of it.
In May we will be watching for possible reversal months appearing. Price already has created new high and now the question is whether it will close below April’s lows. If this will happen – this will encourage us on expectation of more solid downward action inside 1.33-1.38 range.
In short-term perspective market is forming Double Top pattern that suggests reaching of 1.34 area in medium term perspective. GBP and CHF also shows patterns that suggest USD strength.
The technical portion of Sive's analysis owes a great deal to Joe DiNapoli's methods, and uses a number of Joe's proprietary indicators. Please note that Sive's analysis is his own view of the market and is not endorsed by Joe DiNapoli or any related companies.
The euro fell to a three-month low against the dollar and a 17-month trough against the pound on Friday after a disappointing report on German business sentiment supported the view the European Central Bank will cut interest rates next month. Concerns that Sunday's European Union election results could destabilize some euro zone governments also weighed on the euro. Germany's leading indicator of business confidence, the Ifo index, pointed to slower growth in Europe's largest economy as the index hit its lowest level this year in May. "That put pressure on the euro. It reinforces expectations the ECB will ease policy sooner rather than later," said Eric Viloria, currency strategist at Wells Fargo Securities in New York.
Trading volume, as expected, faded faster than usual before the weekend. There is a U.K. bank holiday on Monday while U.S. financial markets will be closed for Memorial Day. Investors also trimmed euro holdings before EU election results due at about 2100 GMT on Sunday, traders said. A strong showing by fringe parties would highlight the anti-euro and anti-austerity sentiment in countries like Italy and Greece that have regained market confidence. "There are some concerns about the extremist parties gaining ground," said Alan Ruskin, global head of G19 currency strategy with Deutsche Bank in New York.
Weaker euro zone members have shown progress in managing their high debt loads. Earlier, Standard & Poor's upgraded Spain's credit rating by a notch to BBB, helping to stem euro's fall and to spur a rally in peripheral euro zone debt.
DOLLAR STEADY
The euro's modest losses boosted the dollar index, which tracks the greenback against a basket of major currencies, to its highest in six weeks at 80.443 before easing to 80.364. The benchmark U.S. 10-year yield finished at 2.536 percent, down 2 basis points on the day despite a stronger-than-expected new home sales report. It touched a 1-1/2 week high of 2.566 percent on Thursday, almost 10 basis points above the 6-1/2 month low set last week.
Technical
Although April was upward month, but overall action mostly should be classified as “inside” one to March range. Almost whole April price has spent in the same range. At the same time May action is starting to show its power. Although this has happened not quite independently but having ECB hand in EUR dynamic, still, technically we see attempt of reversal on monthly chart and recent EU fundamental data just have added more power to it. We saw something cognate on February action, but it didn’t lead to any downward continuation. At the same time, currently situation is slightly different because there was no solid upward action in April, and now we have a month candle that has moved above April high. If May will close below April low – we will get monthly reversal bar and this could lead at least to some downward continuation. Part of this work has been done already and is continued on recent week. As May stands close to an end – this could become a reality very soon. It is also interesting that we have confirmation from other currencies of this action on different time frames. Thus, CHF shows double bottom, while GBP gives perfect bearish AB=CD, accompanied by stop grabber on daily.
By looking at bigger picture, market stands in tight range since 2014. Thus, 1.33-1.3850 is an area of “indecision”. While market stands inside of it we can talk about neither upward breakout nor downward reversal. At least, reversal identification could be done with yearly pivot – if market will move below it, this could be early sign of changing sentiment. But, as you can see, nothing among this issues have happened yet.
Speaking about upward continuation, market mechanics does not allow price to show any deep retracement any more. Any move of this kind should be treated as market weakness and it will increase probability of reversal down. Take a look that as market has hit minor 0.618 AB-CD extension target right at former rock hard resistance – Fib level and Agreement and former yearly PR1, it has shown reasonable bounce down to 1.33. As retracement after 0.618 target already has happened, it is unlogical and unreasonable to see another deep bounce and if it will happen - it will look suspicious.
So, speaking about monthly upside targets... If we will get finally real break through resistance, we have two major targets – AB=CD one around 1.44 and Yearly PR1 = 1.4205. But right now it doesn’t look like upward breakout could happen soon.
Finally, price is coverging with MACD line, it will be interesting if they will meet somewhere around Yearly Pivot.
That’s being said, to change really big picture and long-term sentiment market will have to leave 1.3350-1.3850 area in one or other direction. While appearing of reversal May bar will give us confidence to suggest further downward action inside of 1.3350-1.3850 range by far.

Weekly
On weekly chart we have full pack of bearish signs. It’s a bit uncomfortable that they are too obvious, but they are facts that we can’t ingore still. Besides, fundamentally EUR/USD pair also has reasons to move lower. Although Lutz Karpowitz, a currency strategist with Commerzbank in Frankfurt said: “As long as quantitative easing continues in the U.S., we expect the dollar to remain under pressure”, - but currently it’s not quite the same QE. It was contracted twice and dollar supply has decreased. At the same time ECB stands near stopping of its liquidity sterilization action and this should increase the supply of EUR, or, at least it should stop contracting it. These opposite measures play in favor of EUR/USD downward action probably. Recent EU data also increases chances on dovish policy from ECB.
By looking at technical issues, we have a lot of bearish signs – some of them are still valid others – hit targets already. Butterfly “Sell” at MPR1, accompanied by bearish wedge and divergence with MACD. Grabber has hit the target already. At the same time we have reversal bar and W&R on previous top – they have extremely importance on daily chart, as we will see a bit later.
Thus, I will not dare to speak about long-term reversal, but at least minor continuation should follow. Nearest support stands around 1.35-1.3520 area and includes two major points – Fib support and YPP at 1.3475. Also if we build extension of the tops – we will get 1.618 support extension right in the same area. This is also minimum butterfly target and right now we do not see reasons on weekly chart, why this area couldn’t be reached. Right now market is not at oversold and there is no significant support that could hold it from downward action.

Daily
Partially, we’ve started this discussion on Friday. So, we have double top pattern that has target around 1.34 area. This pattern could lead us to serious consecutives, because action around 1.34 suggests moving below YPP and that could mean shift in a long-term sentiment. Other currencies, such as CHF and GBP also suggest downward action on next week, especially GBP. There are two very important issues here. First is W&R of first top. This is very typical for Double Top pattern and adds reliability to it. Second – price stands below MPS1. This means that may be new bear trend is born.
Also, guys, I intentionally keep this 5/8 Fib support to show you, that there is no significant support below the market any more. And although market stands close to OS but it is not oversold right now. So, in fact nothing prevents market from downward continuation. Neckline is also broken already.

1-hour
Although we’ve come to bearish conclusion on EUR – it is not absolutely neccesary that market should immediately drop down. In fact, it seems that price could re-test broken neckline. This happens rather often. Take a look at hourly picture. We have butterfly “Buy” reversal pattern. As market too fast has come to 1.27 target – candle too long and strong, very probable that EUR will proceed right to 1.618 target. After that some retracement is possible. As an objective point of retracement we could look on neckline and WPP point range – 1.3660-1.3670. If price will move above 1.3734 – this could lead to failure of Double Top pattern.

Conclusion:
While price stands in 1.33-1.38 area we can’t speak either on upward or downward breakout. To change really big picture market should have to show breakout out of it.
In May we will be watching for possible reversal months appearing. Price already has created new high and now the question is whether it will close below April’s lows. If this will happen – this will encourage us on expectation of more solid downward action inside 1.33-1.38 range.
In short-term perspective market is forming Double Top pattern that suggests reaching of 1.34 area in medium term perspective. GBP and CHF also shows patterns that suggest USD strength.
The technical portion of Sive's analysis owes a great deal to Joe DiNapoli's methods, and uses a number of Joe's proprietary indicators. Please note that Sive's analysis is his own view of the market and is not endorsed by Joe DiNapoli or any related companies.


