Sive Morten
Special Consultant to the FPA
- Messages
- 18,732
Monthly
Weekly Forex Tading Report prepared by Sive Morten exclusively for ForexPeaceArmy.com
According to Reuters news dollar climbed to a more than four-year peak on Friday after a report showing the U.S. economy created more jobs than expected last month, which suggested that the U.S. recovery was on a stable path.
The dollar index, a gauge of the greenback's value against six major currencies, was on track for its best yearly gain in nine years. The index was up 8 percent so far in 2014, posting weekly gains for a record 12 straight weeks.
Data from the Labor Department on Friday showed U.S. non-farm payrolls rose 248,000 last month and the jobless rate fell to 5.9 percent, the lowest since July 2008.
The only sore point, however, was the small growth in wages. Average hourly earnings rose just 2.0 percent. Before the last recession, hourly earnings often rose at above 3 percent per year.
"The U.S. economy is the only place that's growing. That's why the U.S. dollar is appreciating because there's very little confidence that U.S. growth is spreading anywhere else," said Roger Sadewsky, investment director for multi-asset investing at Standard Life Investments in Edinburgh, Scotland. Standard manages $337 billion in assets.
Still, the robust U.S. jobs report may not be a game-changer for the Federal Reserve. Some market participants still expect the Fed to hold fire when it comes to raising interest rates.
"I don't think this report will be enough to persuade the Fed to raise rates sooner than expected," said Sireen Haraji, currency strategist, at Mizuho Corporate Bank in New York.
"The fact that wage growth is flat suggests very little inflation and gives the Fed more time to be patient with hiking interest rates."
In the interest rate futures market, however, traders boosted bets the Fed could raise interest rates slightly earlier in 2015.
Rate futures contracts still show traders are betting the first Fed rate hike will come in July 2015, based on CME FedWatch, which tracks rate hike expectations using its Fed funds futures contracts.
But traders now see a 40 percent chance rates could rise as early as June 2015, up from 34 percent before the non-farm payrolls report.
Recent CFTC report shows gradual contraction of speculators short positions, but at the same time open interest stands flat, probably due corresponding changes in hedgers’ positions. It means that some changes in market sentiment are started, but they are not quite clear yet. Anyway reducing speculating shorts stands in our favor since we expect B&B “Buy” trade on monthly chart…
Non-Commercial Shorts:

Technical
We know that a lot of our forumers expect to get some update on EUR situation. That’s why in the beginning of this research we will say couple of words and why we do not prepare weekly researches on EUR? There are some reasons for that. The point is EUR is interesting right now only on long term picture and our target is the same as we’ve specified it 3 weeks ago – 1.2170. So keep long-term shorts. In short term perspective tactic is very simple. As market is oversold on daily and weekly chart and has passed through all targets and Fib levels – use retracement for short entry and take profits at lows of former day/week, depending on your trading time frame.
Today we again will take a look at GBP, since situation could seem curious as we’ve discussed chances on long entry but market has miserably fell on NFP data. Here we will try to explain why we think that setup is still valid and what we have to watch for.
As we’ve said on previous week, Scotland referendum has made an impact and adjusted normal market’s behavior. As political turmoil has gone to history market will try to correct the skew that was made by political impact. This in turn, could give us promising setups on different time scales. At the same time we agree that setups that we will discuss today mostly tactical, although they could last for considerable period of time. Also we understand that Scotland’s referendum has changed political sentiment and will lead to changes in domestic political process. The fact that political reasons were existed for referendum and referendum itself has happened – already is negative for Kingdom currency. That’s why we are not count that GBP will return soon at the same top as it was before referendum.
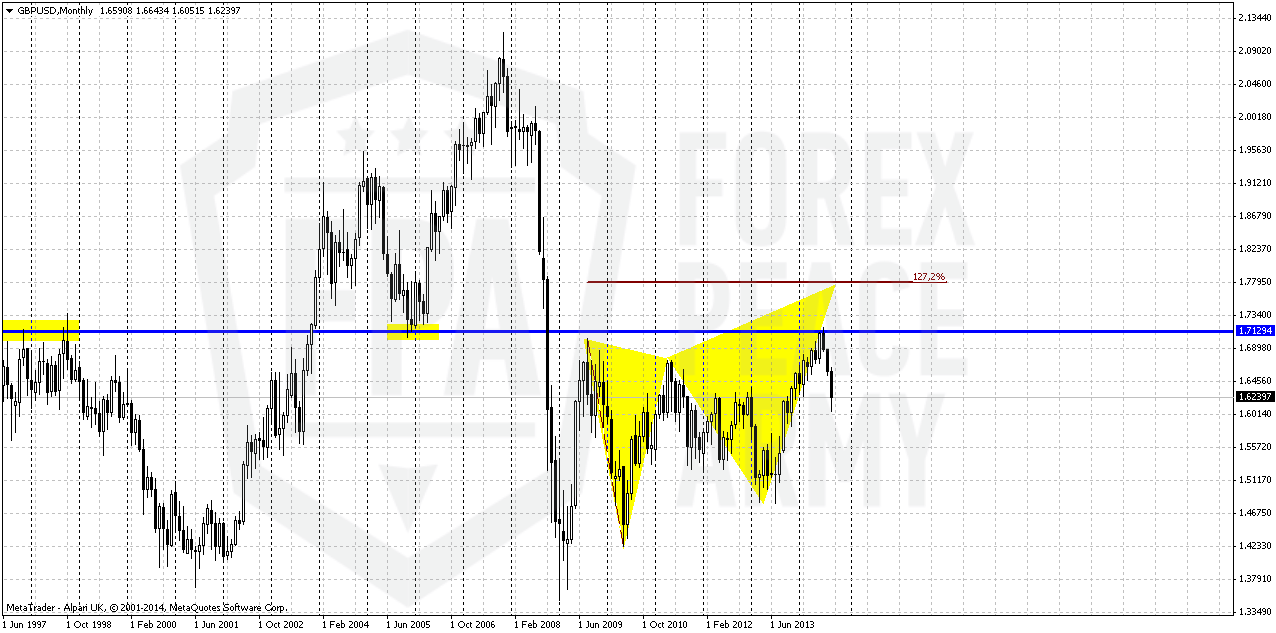
First of all take a look at long-term GBP chart. Here is long time 1.70-1.71 natural support/resistance area. Recall that before shadow of referendum has risen upon Great Britain – pound sterling was on nice upward march. BoE was at the eve of rate hiking and this has led to tremendous upside rally. In general market moves north longer than a whole year and has reached 1.70-1.71:
Rumors around Scotland voting have not appeared suddenly but previously they weren’t treated seariously as they should to. On autumn of 2014 public opinion surveys start to show that percent of “Yes” voters are not really small and approaches to 50%. And this has started to worry investors and logically has led to negative impact on GB currency.
As political force was eliminated after voting – we see that market logically should return to previous action and at least return some previous looses. Besides, pure technical view suggests existing of previous upside momentum that has not dissapeared but was temporally muted by political mess. This leads to appearing of monthly DiNapoli B&B “Buy” setup, as it is shown no second chart:

And here we need some update on our former view. No, we do not want to say that pattern has failed. First – it makes sense to remind B&B rules. Market has to reach some significant Fib support level within 3 periods of closing below 3x3 DMA. Although we previously expected that B&B has chances to start from 3/8 Fib support, but this has not happened. But following to rules – market can start B&B as from 50% Fib level as from 5/8.The major condition - this level has to be reached within 3 periods after 3x3 DMA has been crossed. And you can see that October is a third period. Hence – we know that B&B will start in October, but we do not know from which level – 50% or 5/8. Right now GBP stands at 50% support.
The target of this pattern is 5/8 Fib resistance of total move down after thrust up. As you will see later - right now this is 1.6717 area.
Although B&B is very reliable pattern because it is based not on some trader’s view or opinion or some men-invented patterns, but on real market mechanics, sometimes it still could fail. That’s why reaching of strong support and completion of other conditions are not enough to take position. Since this is monthly pattern – upward action should be visible on lower time frames and probably should start from some clear upside reversal pattern on daily chart. Advantage of this one B&B stands also with its political background – there was a “problem” that now is mostly gone, although some consecquences probably will remain. Anyway this should let market to return previous positions, at least partially and 5/8 upside retracement looks really as a mite and rather realistic target.
Last week, you have been able to verify the need for a reversal pattern. If we took a long position blindly, only with the support - we would now be in a very uncomfortable situation.
Weekly
On weekly chart trend is bearish. We do not have many clues here. Previously we’ve mentioned high wave pattern that has appeared right after voting and we’ve said depending on breakout direction market will follow in the same one. In fact, right now we have simple task – understand from which level B&B will start. Right now here is GBP at MPS1 and 50% support, level of oversold coinsides with 5/8 Fib level. Let’s see, whether B&B will start from here...

Daily
Here market does not give us anything interesting. We see that market strongly oversold at MPS1 and 50% weekly support level. May be we could treat it as DiNapoli Stretch pattern again. Trend has turned bearish.

4-hour
This time frame gives us very important pattern – butterfly “Buy”. 1.27 level coincides with 50% Fib support, 1.618 extenison coincides with weekly 5/8 Fi support. It means that despite what level B&B will start – butterfly could become a reason for that. Now we need to assess which level to choose and how to act.
First – let’s discuss what we know about current level – 1.59-1.60. This is MPS1, weekly 50% level, butterfly 1.27 extension and daily oversold. Really it’s not bad, right? The only one negative moment here – acceleration down right to 1.27 extension. Usually when butterfly accelerates to 1.27 – it has more chances to proceed to 1.618.
Second – 1.618, this is butterfly ultimate extension, weekly oversold and Fib support. And what is more important, this is, in fact, final “important” Fib support where B&B could start. If this will not happen – it means that B&B will fail.
That’s being said, what our trading plan here? First, we think that we can try to take long position at 1.27 extension of butterfly. Support is strong and if even market will continue move down later – some retracement, at least 3/8 should happen. This will let us to protect position with breakeven stop and take second attempt later if market will drop to 1.5750 area.
But if market will start move up right from 1.27 – that’s all that we want...

Conclusion:
So, we are tempted by appetite setup on monthly chart of GBP that looks promising, at least right now. Since this pattern is forming on big picture – it could lasts for weeks and particularly by this reason it looks attractive. Currently we’ve estimated the target of this pattern at 1.6717
In shorter-term perspective we need to catch the moment of upside reversal and here we will act with our trading plan.
The technical portion of Sive's analysis owes a great deal to Joe DiNapoli's methods, and uses a number of Joe's proprietary indicators. Please note that Sive's analysis is his own view of the market and is not endorsed by Joe DiNapoli or any related companies.
Weekly Forex Tading Report prepared by Sive Morten exclusively for ForexPeaceArmy.com
According to Reuters news dollar climbed to a more than four-year peak on Friday after a report showing the U.S. economy created more jobs than expected last month, which suggested that the U.S. recovery was on a stable path.
The dollar index, a gauge of the greenback's value against six major currencies, was on track for its best yearly gain in nine years. The index was up 8 percent so far in 2014, posting weekly gains for a record 12 straight weeks.
Data from the Labor Department on Friday showed U.S. non-farm payrolls rose 248,000 last month and the jobless rate fell to 5.9 percent, the lowest since July 2008.
The only sore point, however, was the small growth in wages. Average hourly earnings rose just 2.0 percent. Before the last recession, hourly earnings often rose at above 3 percent per year.
"The U.S. economy is the only place that's growing. That's why the U.S. dollar is appreciating because there's very little confidence that U.S. growth is spreading anywhere else," said Roger Sadewsky, investment director for multi-asset investing at Standard Life Investments in Edinburgh, Scotland. Standard manages $337 billion in assets.
Still, the robust U.S. jobs report may not be a game-changer for the Federal Reserve. Some market participants still expect the Fed to hold fire when it comes to raising interest rates.
"I don't think this report will be enough to persuade the Fed to raise rates sooner than expected," said Sireen Haraji, currency strategist, at Mizuho Corporate Bank in New York.
"The fact that wage growth is flat suggests very little inflation and gives the Fed more time to be patient with hiking interest rates."
In the interest rate futures market, however, traders boosted bets the Fed could raise interest rates slightly earlier in 2015.
Rate futures contracts still show traders are betting the first Fed rate hike will come in July 2015, based on CME FedWatch, which tracks rate hike expectations using its Fed funds futures contracts.
But traders now see a 40 percent chance rates could rise as early as June 2015, up from 34 percent before the non-farm payrolls report.
Recent CFTC report shows gradual contraction of speculators short positions, but at the same time open interest stands flat, probably due corresponding changes in hedgers’ positions. It means that some changes in market sentiment are started, but they are not quite clear yet. Anyway reducing speculating shorts stands in our favor since we expect B&B “Buy” trade on monthly chart…
Non-Commercial Shorts:
Technical
We know that a lot of our forumers expect to get some update on EUR situation. That’s why in the beginning of this research we will say couple of words and why we do not prepare weekly researches on EUR? There are some reasons for that. The point is EUR is interesting right now only on long term picture and our target is the same as we’ve specified it 3 weeks ago – 1.2170. So keep long-term shorts. In short term perspective tactic is very simple. As market is oversold on daily and weekly chart and has passed through all targets and Fib levels – use retracement for short entry and take profits at lows of former day/week, depending on your trading time frame.
Today we again will take a look at GBP, since situation could seem curious as we’ve discussed chances on long entry but market has miserably fell on NFP data. Here we will try to explain why we think that setup is still valid and what we have to watch for.
As we’ve said on previous week, Scotland referendum has made an impact and adjusted normal market’s behavior. As political turmoil has gone to history market will try to correct the skew that was made by political impact. This in turn, could give us promising setups on different time scales. At the same time we agree that setups that we will discuss today mostly tactical, although they could last for considerable period of time. Also we understand that Scotland’s referendum has changed political sentiment and will lead to changes in domestic political process. The fact that political reasons were existed for referendum and referendum itself has happened – already is negative for Kingdom currency. That’s why we are not count that GBP will return soon at the same top as it was before referendum.
First of all take a look at long-term GBP chart. Here is long time 1.70-1.71 natural support/resistance area. Recall that before shadow of referendum has risen upon Great Britain – pound sterling was on nice upward march. BoE was at the eve of rate hiking and this has led to tremendous upside rally. In general market moves north longer than a whole year and has reached 1.70-1.71:
Rumors around Scotland voting have not appeared suddenly but previously they weren’t treated seariously as they should to. On autumn of 2014 public opinion surveys start to show that percent of “Yes” voters are not really small and approaches to 50%. And this has started to worry investors and logically has led to negative impact on GB currency.
As political force was eliminated after voting – we see that market logically should return to previous action and at least return some previous looses. Besides, pure technical view suggests existing of previous upside momentum that has not dissapeared but was temporally muted by political mess. This leads to appearing of monthly DiNapoli B&B “Buy” setup, as it is shown no second chart:
And here we need some update on our former view. No, we do not want to say that pattern has failed. First – it makes sense to remind B&B rules. Market has to reach some significant Fib support level within 3 periods of closing below 3x3 DMA. Although we previously expected that B&B has chances to start from 3/8 Fib support, but this has not happened. But following to rules – market can start B&B as from 50% Fib level as from 5/8.The major condition - this level has to be reached within 3 periods after 3x3 DMA has been crossed. And you can see that October is a third period. Hence – we know that B&B will start in October, but we do not know from which level – 50% or 5/8. Right now GBP stands at 50% support.
The target of this pattern is 5/8 Fib resistance of total move down after thrust up. As you will see later - right now this is 1.6717 area.
Although B&B is very reliable pattern because it is based not on some trader’s view or opinion or some men-invented patterns, but on real market mechanics, sometimes it still could fail. That’s why reaching of strong support and completion of other conditions are not enough to take position. Since this is monthly pattern – upward action should be visible on lower time frames and probably should start from some clear upside reversal pattern on daily chart. Advantage of this one B&B stands also with its political background – there was a “problem” that now is mostly gone, although some consecquences probably will remain. Anyway this should let market to return previous positions, at least partially and 5/8 upside retracement looks really as a mite and rather realistic target.
Last week, you have been able to verify the need for a reversal pattern. If we took a long position blindly, only with the support - we would now be in a very uncomfortable situation.
Weekly
On weekly chart trend is bearish. We do not have many clues here. Previously we’ve mentioned high wave pattern that has appeared right after voting and we’ve said depending on breakout direction market will follow in the same one. In fact, right now we have simple task – understand from which level B&B will start. Right now here is GBP at MPS1 and 50% support, level of oversold coinsides with 5/8 Fib level. Let’s see, whether B&B will start from here...
Daily
Here market does not give us anything interesting. We see that market strongly oversold at MPS1 and 50% weekly support level. May be we could treat it as DiNapoli Stretch pattern again. Trend has turned bearish.
4-hour
This time frame gives us very important pattern – butterfly “Buy”. 1.27 level coincides with 50% Fib support, 1.618 extenison coincides with weekly 5/8 Fi support. It means that despite what level B&B will start – butterfly could become a reason for that. Now we need to assess which level to choose and how to act.
First – let’s discuss what we know about current level – 1.59-1.60. This is MPS1, weekly 50% level, butterfly 1.27 extension and daily oversold. Really it’s not bad, right? The only one negative moment here – acceleration down right to 1.27 extension. Usually when butterfly accelerates to 1.27 – it has more chances to proceed to 1.618.
Second – 1.618, this is butterfly ultimate extension, weekly oversold and Fib support. And what is more important, this is, in fact, final “important” Fib support where B&B could start. If this will not happen – it means that B&B will fail.
That’s being said, what our trading plan here? First, we think that we can try to take long position at 1.27 extension of butterfly. Support is strong and if even market will continue move down later – some retracement, at least 3/8 should happen. This will let us to protect position with breakeven stop and take second attempt later if market will drop to 1.5750 area.
But if market will start move up right from 1.27 – that’s all that we want...
Conclusion:
So, we are tempted by appetite setup on monthly chart of GBP that looks promising, at least right now. Since this pattern is forming on big picture – it could lasts for weeks and particularly by this reason it looks attractive. Currently we’ve estimated the target of this pattern at 1.6717
In shorter-term perspective we need to catch the moment of upside reversal and here we will act with our trading plan.
The technical portion of Sive's analysis owes a great deal to Joe DiNapoli's methods, and uses a number of Joe's proprietary indicators. Please note that Sive's analysis is his own view of the market and is not endorsed by Joe DiNapoli or any related companies.


