Sive Morten
Special Consultant to the FPA
- Messages
- 18,673
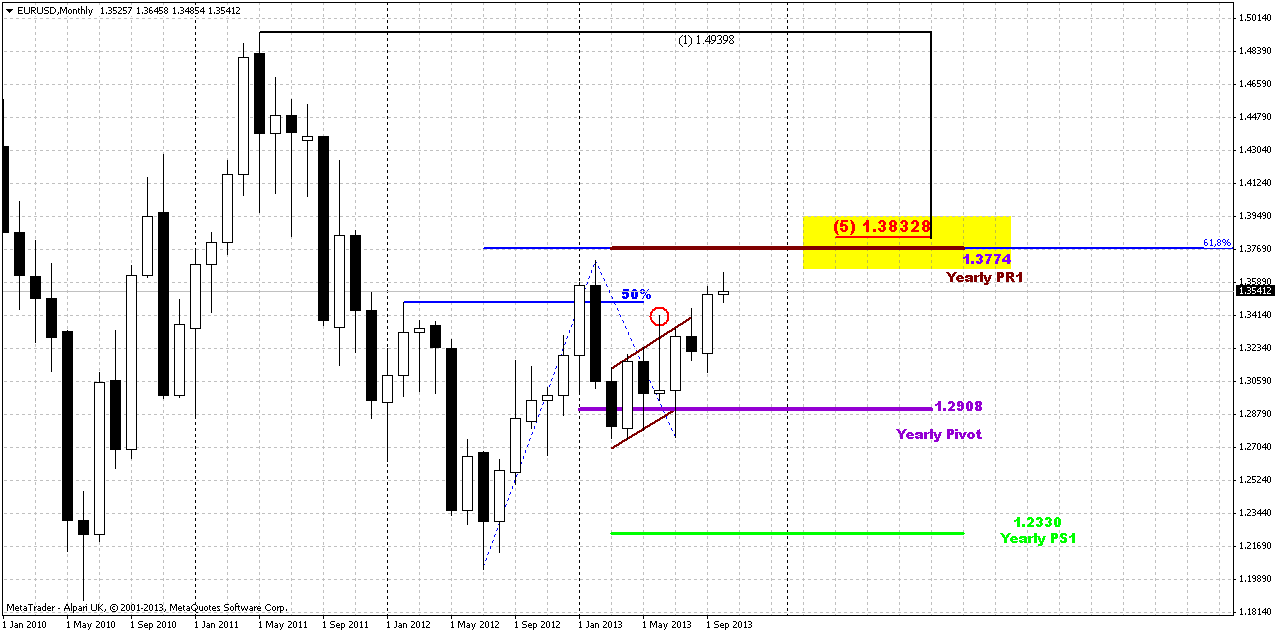
Monthly
I do not know, guys, how useful analysis will be on coming week, since we have long Columbus holidays and then just 2 days till X-point. I can’t exclude situation when markets will just freeze, expecting the solution of debt ceil and budget agreement. By the way, some big funds, as Fidelity have sold US bonds with maturity on 24th of October and in beginning of November and the yield of Treasury bills with similar maturity days has increased 3 times. “We do not expect the default, but we’re preparing to it. Other words, if you want a peace prepare for war...” Today I want to say just few words concerning 17th of October and possible default and to dispel an illusion, that if default will happen, then it will be strict edge between “before” and “after”. Actually, this is not quite correct. US debt has strick dates of maturity and if even default will happen it absolutely does not mean that government will stop attempts to come to conlcusion and sooner or later they will come. What does it mean? It means that they probably will pay what they have to with some delay, but not default totally. Second is, other issues of debt will not fall under default. So, if they come to agreement on debt ceil, say, 28 of October, 24th maturity date will default, but others with maturity in November will not. I will not talk about other consequences as increasing of government’s borrow rate, possible results for economy in general, yes this is true. Now I just want to clarify technical side of possible default, since if even this default will happen – this will be mostly political issue, but not solvency trouble. America can pay, ultimately and theoretically they can print as much dollars as they want and pay off totally all $15 Trln immediately (if they will need it), since American debt doesn’t carry currency risk, right? Thus, from the technical point of view this should not become an armageddon for financial world. Total collapse will be if this will become a real default – they will not print money to pay off debt and they will not increase debt ceil. But even in this case the whole burden of default will care mostly by UAE, Japan and China and it will appear that US has consumed all goods and services for free within previous decades. But this hardly will happen now...
By taking a look at technical picture, I’ve decided to hold with EUR on current week, although we could get very interesting setups on JPY, AUD, GBP and NZD in nearest future. I do not discuss it right now, since they have not been totally formed yet and we will talk about it as soon as it will happen. Actually, you even could proceed with NZD by yourself, since we’ve made long-term plan and it still holds by far.
On monthly chart of EUR the difference between previous week close and current one is just 15 pips. Besides, October candle is very small by far, although price holds above key level that was broken previously. Since current move up in fact is extension of intial swing, then when you’re dealing with extensions you count at list on minium 0.618 one. Market is moving to it, but the steep of this move is slower than intial swing. You can expect decreasing of steepness when market moves to 100% extension, but when market shows flatter action on move to just 0.618, this tells that this level will become solid resistance and downward reversal has significant probability there. In our case this is not just 0.618 extension but also yearly Pivot resistance 1 and major 5/8 Fib resistance around 1.38 area. Thus, if market will not show significant acceleration in nearest time, then we should be ready to downward reversal, even if it will somehow climb to 1.38 first.
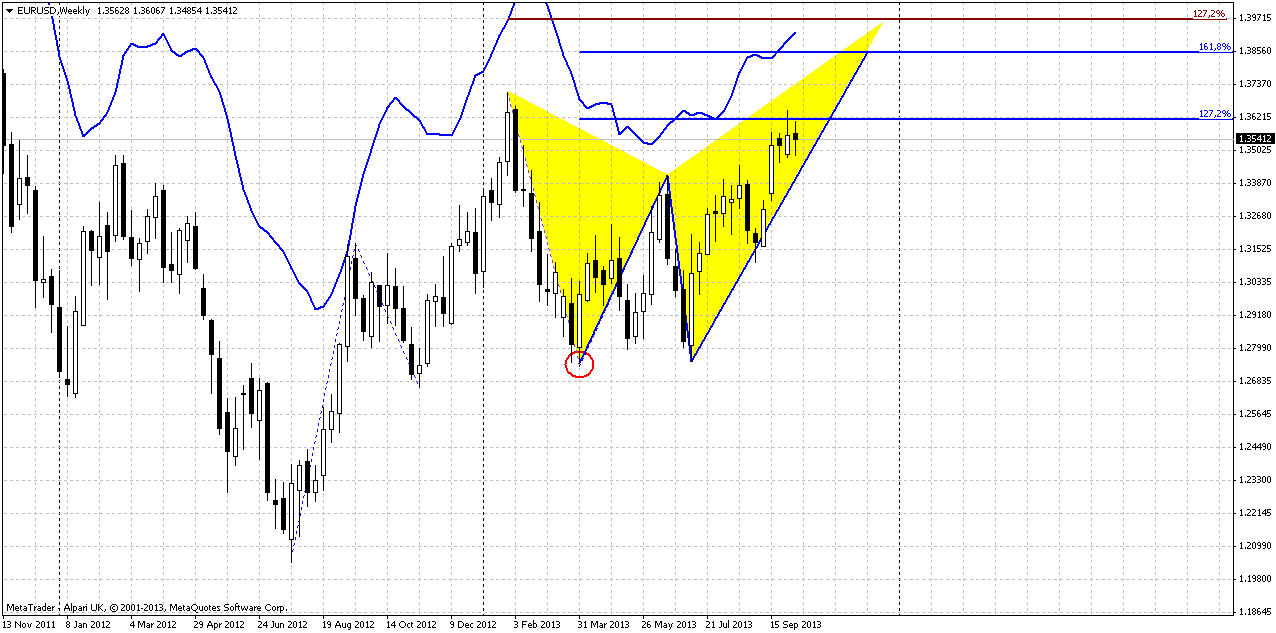
Weekly
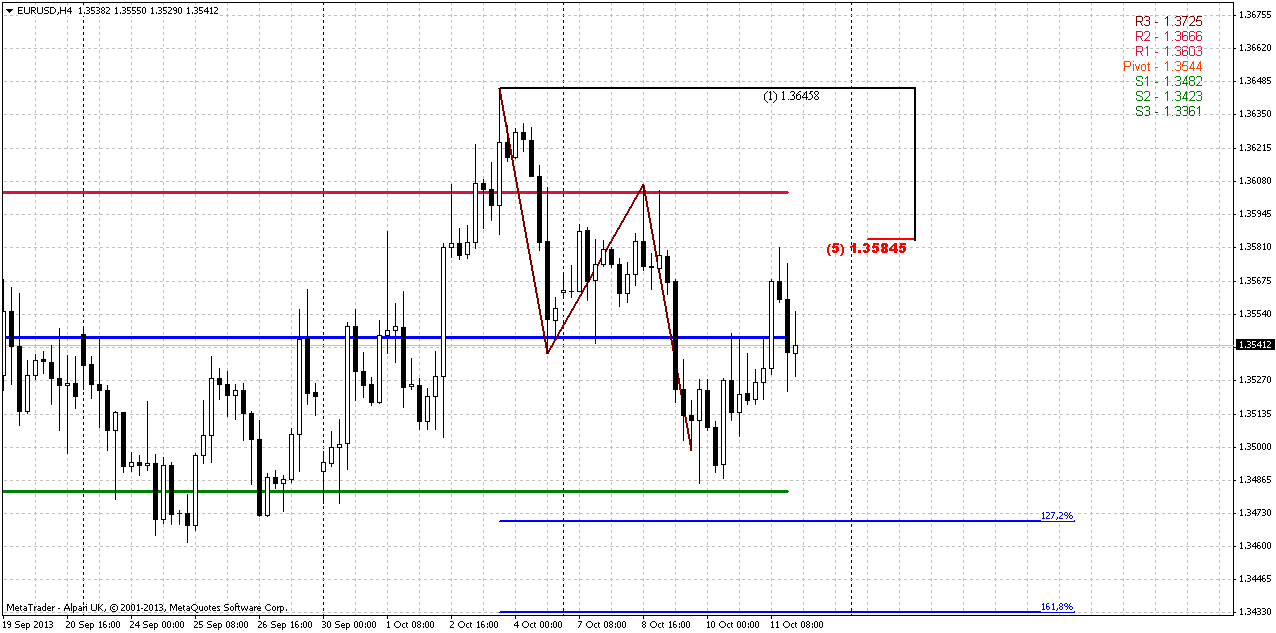
After reaching of 1.27 extension of AB=CD pattern price has created inside small candle of previous week. This is absolutely normal action after reaching target and resistance. So, our weekly analysis remains the same.
Trend is still bullish here. Currently we have the only pattern here and this is butterfly “sell” and we still use AB=CD extension on monthly chart. As market has passed through as MPR1 as MPR2 of September and now it stands above MPP – it is solid challenge on continuation and it looks like we should see it, at least from technical point of view, since we do not know what else surprises could come from shut down. Long term invalidation point is a low of butterlfy (in red circle). If market will move below it – it will not only erase butterfly but also put under question our monthly AB=CD. Trend also will shift bearish probably around this level. Take a look that we have really huge resistance cluster at 1.38-1.39 area. Recall monthly target and Fib level and now add 1.27 butterfly target, weekly overbought and inner 1.618 AB=CD target. But fortunately we have pretty a lot of room till this area.
The thing that we do not want to see is a deep and stable return below previous highs around 1.3450 by reasons that we’ve discussed many times on daily time frame.
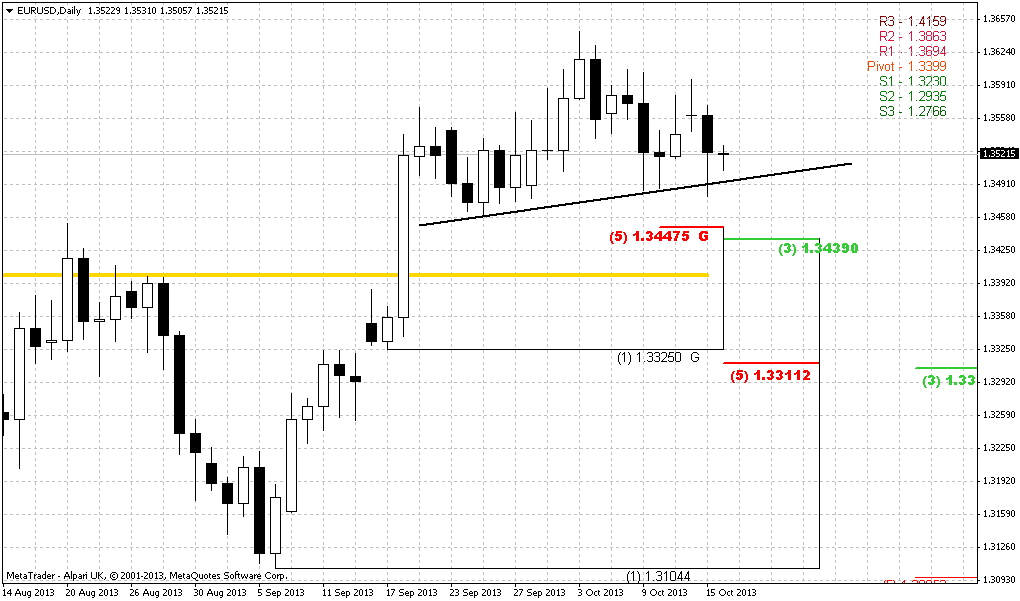
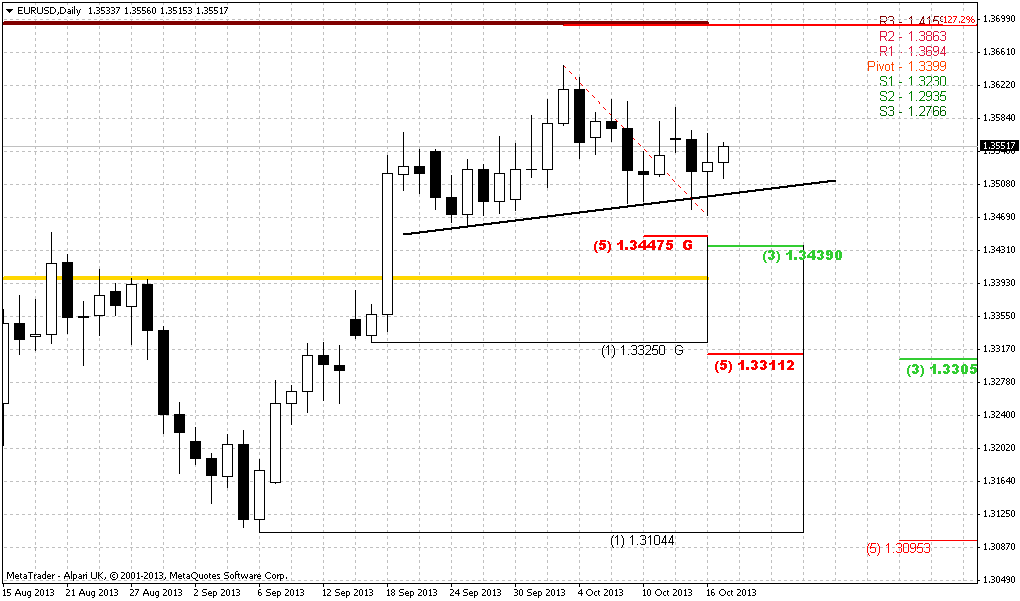
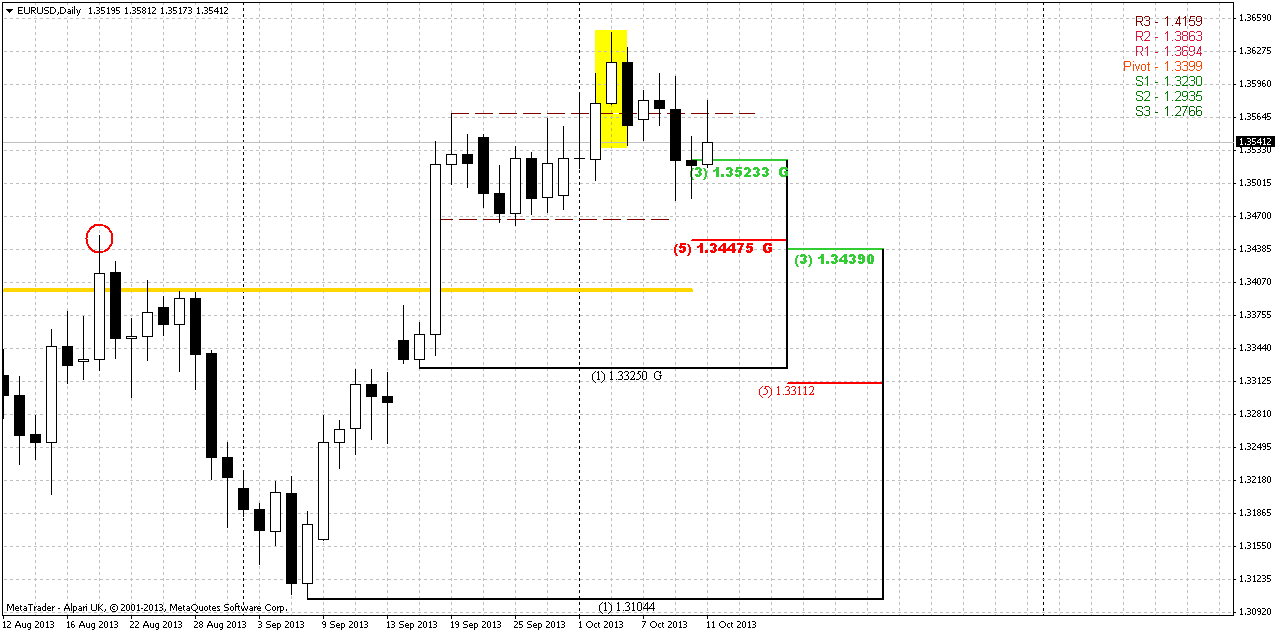
Daily
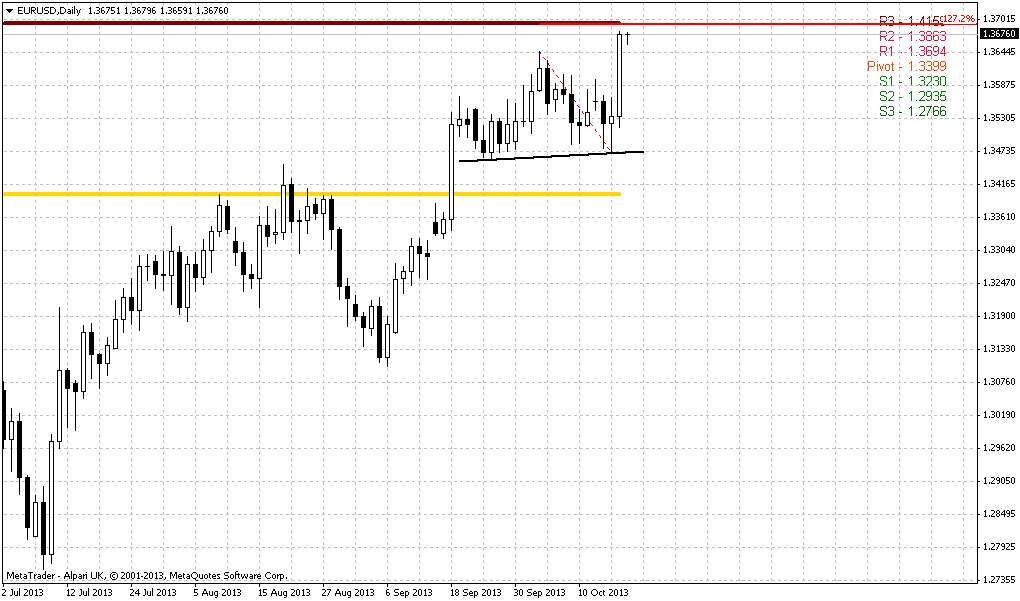
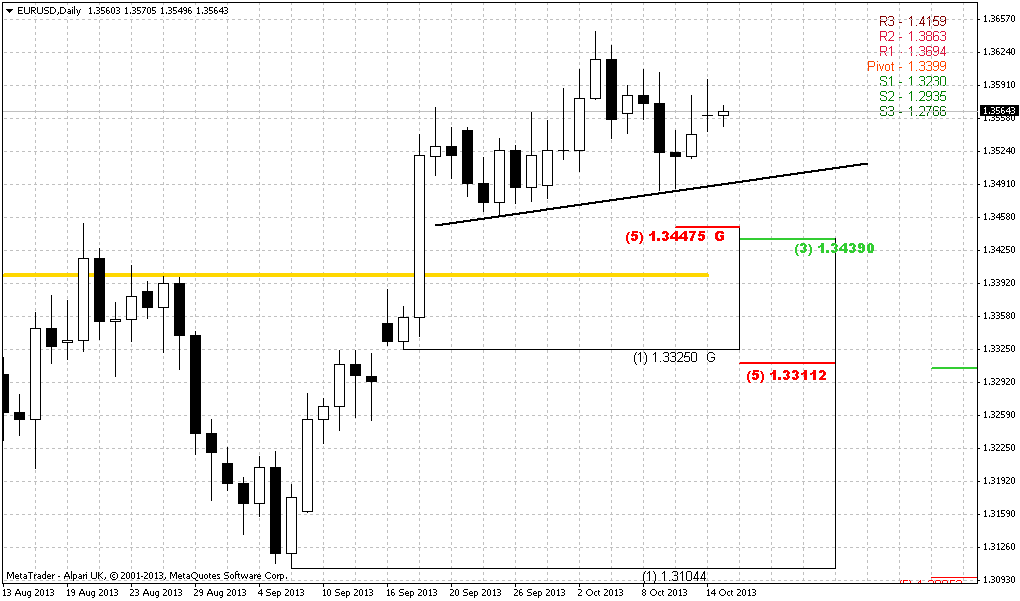
So, guys here you see our previous analysis and trading plan that was based on bearish engulfing pattern and what has happened next. Fortunately or unfortunately, but price action currently is rather slow. Trend has turned bearish and market has triggered engulfing pattern, returned right back in previous consolidation but on Friday has made failed effort to return right back above it. Thus, looks like we will have to extend the validity of previous analysis on next week. Anyway, current action we treat as retracement, based on pattern. Target is the same – daily K-support, previous swing high and MPP around 1.34-1.3450. Also it seems that some indecision shrouds market action, but probably this is normal in current situation.
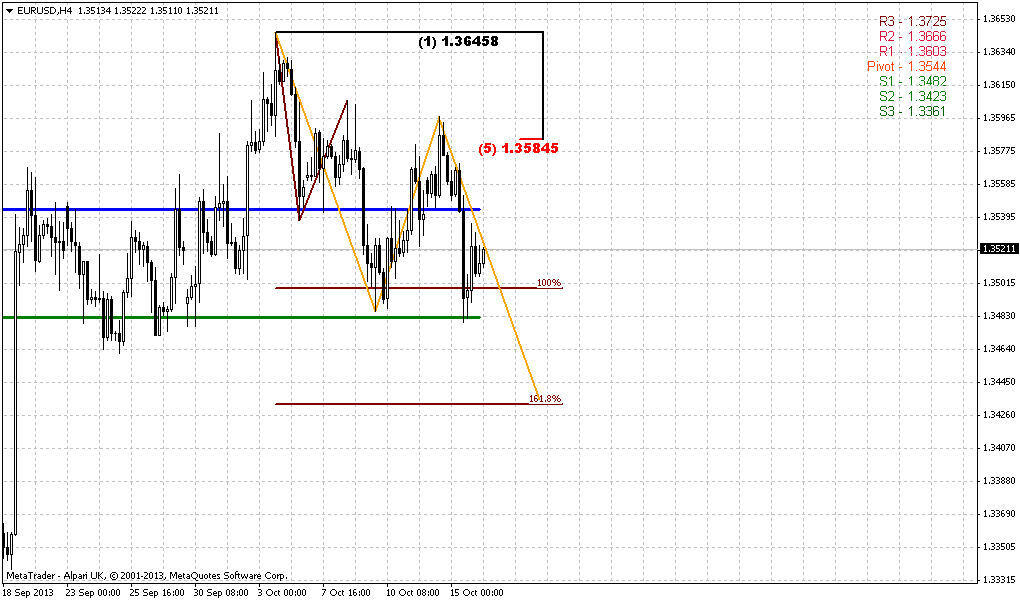
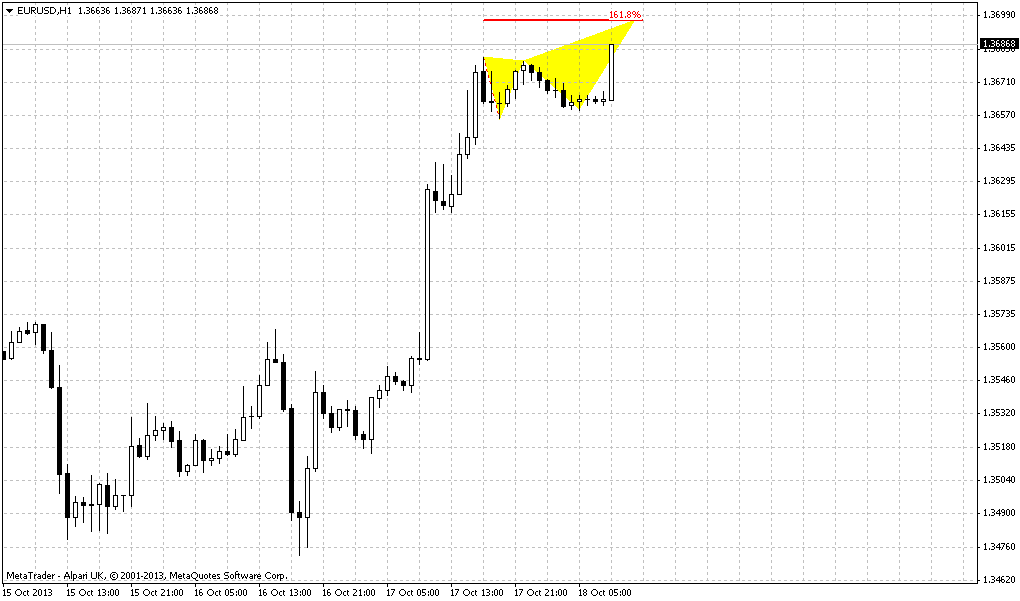
4-hour
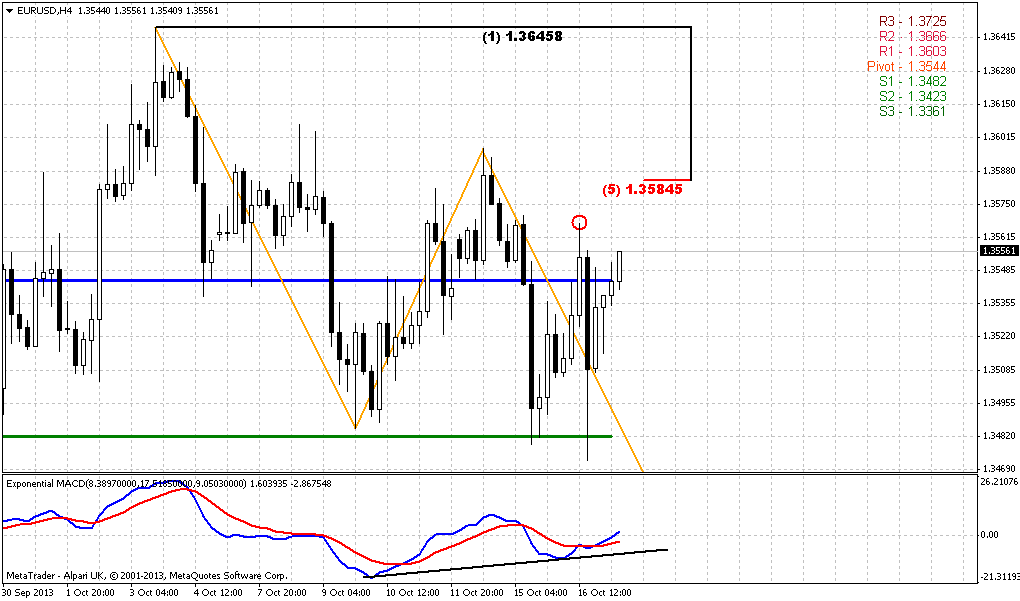
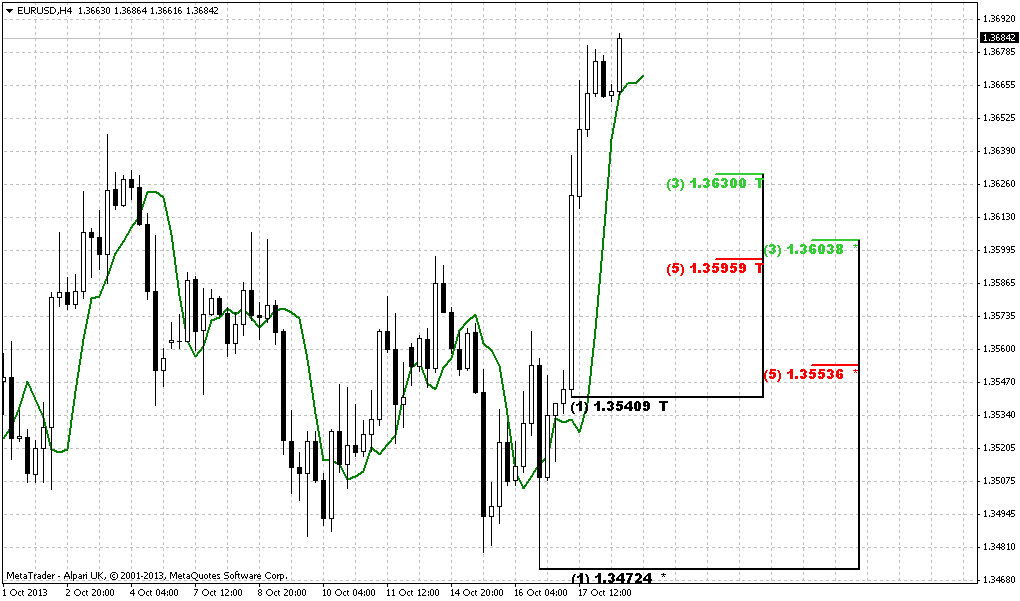
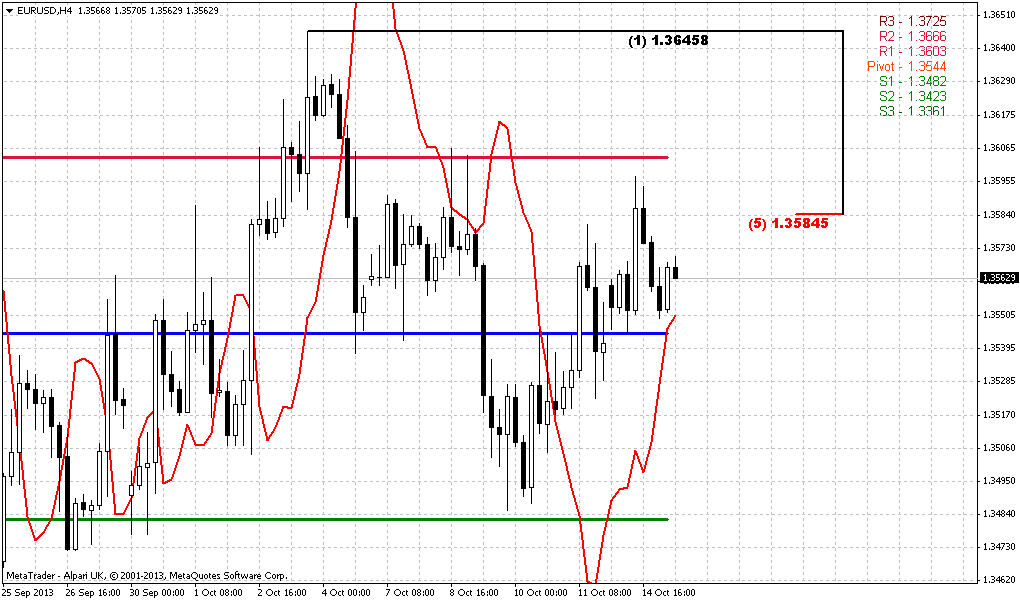
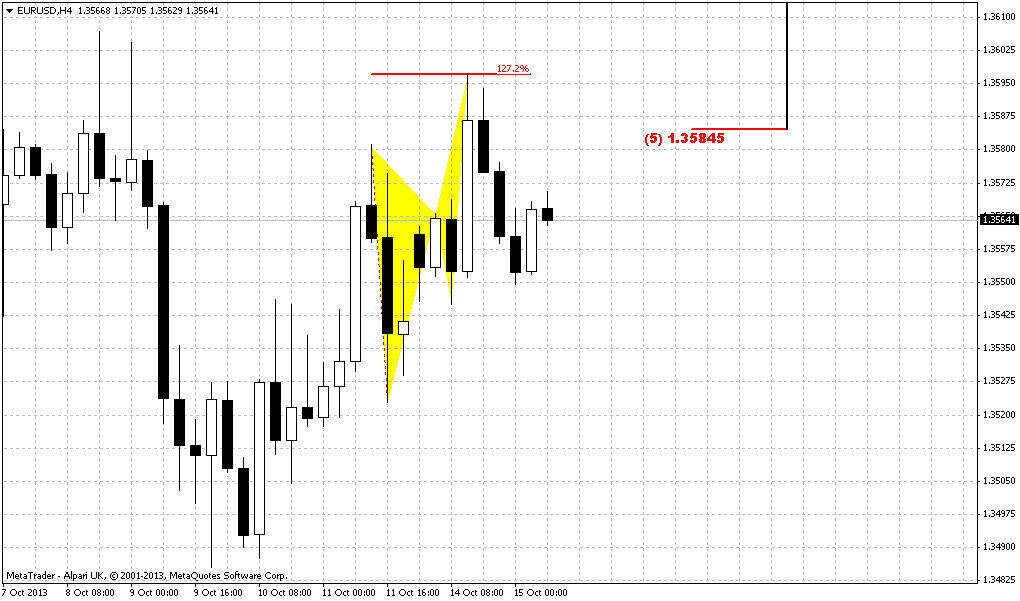
Trend holds bullish here. Looks like market has decided not to stop at K-resistance that we had previously but proceed right to major 5/8 resistance. Anyway, this retracement is reasonable for AB=CD pattern. Pattern itself is very harmonic – the speed of legs is equal. Theory tells that price can show any retracement after completion of AB=CD pattern as high as 5/8 Fib level and that has happened. But here we come to major point. If this is really just retracement and market really intends to continue move down, price should not move above this resistance. That’s the major point that we will monitor on coming week here. The downward target is the same and we’ve discussed it already – we have big target/support area in 1.34-1.3450 as on daily as on 4-hour chart.
Conclusion:
On big picture market still has chances to move in 1.38 area and. At least, currently it looks so, although shut down could easily correct technical picture, since markets now stand in extraordinary action and are driven by absolutely different factors.
In such environment it is better to stick with some clear patterns that could give us clear entry, risk points and risk/reward ratio. Thus, on daily we will continue to trade based on engulfing pattern and our first task in the beginning of the week will get assurance that current move up is just a retracement and price will continue move lower. Market could be really thin in the first half of the week.
The technical portion of Sive's analysis owes a great deal to Joe DiNapoli's methods, and uses a number of Joe's proprietary indicators. Please note that Sive's analysis is his own view of the market and is not endorsed by Joe DiNapoli or any related companies.
I do not know, guys, how useful analysis will be on coming week, since we have long Columbus holidays and then just 2 days till X-point. I can’t exclude situation when markets will just freeze, expecting the solution of debt ceil and budget agreement. By the way, some big funds, as Fidelity have sold US bonds with maturity on 24th of October and in beginning of November and the yield of Treasury bills with similar maturity days has increased 3 times. “We do not expect the default, but we’re preparing to it. Other words, if you want a peace prepare for war...” Today I want to say just few words concerning 17th of October and possible default and to dispel an illusion, that if default will happen, then it will be strict edge between “before” and “after”. Actually, this is not quite correct. US debt has strick dates of maturity and if even default will happen it absolutely does not mean that government will stop attempts to come to conlcusion and sooner or later they will come. What does it mean? It means that they probably will pay what they have to with some delay, but not default totally. Second is, other issues of debt will not fall under default. So, if they come to agreement on debt ceil, say, 28 of October, 24th maturity date will default, but others with maturity in November will not. I will not talk about other consequences as increasing of government’s borrow rate, possible results for economy in general, yes this is true. Now I just want to clarify technical side of possible default, since if even this default will happen – this will be mostly political issue, but not solvency trouble. America can pay, ultimately and theoretically they can print as much dollars as they want and pay off totally all $15 Trln immediately (if they will need it), since American debt doesn’t carry currency risk, right? Thus, from the technical point of view this should not become an armageddon for financial world. Total collapse will be if this will become a real default – they will not print money to pay off debt and they will not increase debt ceil. But even in this case the whole burden of default will care mostly by UAE, Japan and China and it will appear that US has consumed all goods and services for free within previous decades. But this hardly will happen now...
By taking a look at technical picture, I’ve decided to hold with EUR on current week, although we could get very interesting setups on JPY, AUD, GBP and NZD in nearest future. I do not discuss it right now, since they have not been totally formed yet and we will talk about it as soon as it will happen. Actually, you even could proceed with NZD by yourself, since we’ve made long-term plan and it still holds by far.
On monthly chart of EUR the difference between previous week close and current one is just 15 pips. Besides, October candle is very small by far, although price holds above key level that was broken previously. Since current move up in fact is extension of intial swing, then when you’re dealing with extensions you count at list on minium 0.618 one. Market is moving to it, but the steep of this move is slower than intial swing. You can expect decreasing of steepness when market moves to 100% extension, but when market shows flatter action on move to just 0.618, this tells that this level will become solid resistance and downward reversal has significant probability there. In our case this is not just 0.618 extension but also yearly Pivot resistance 1 and major 5/8 Fib resistance around 1.38 area. Thus, if market will not show significant acceleration in nearest time, then we should be ready to downward reversal, even if it will somehow climb to 1.38 first.
Weekly
After reaching of 1.27 extension of AB=CD pattern price has created inside small candle of previous week. This is absolutely normal action after reaching target and resistance. So, our weekly analysis remains the same.
Trend is still bullish here. Currently we have the only pattern here and this is butterfly “sell” and we still use AB=CD extension on monthly chart. As market has passed through as MPR1 as MPR2 of September and now it stands above MPP – it is solid challenge on continuation and it looks like we should see it, at least from technical point of view, since we do not know what else surprises could come from shut down. Long term invalidation point is a low of butterlfy (in red circle). If market will move below it – it will not only erase butterfly but also put under question our monthly AB=CD. Trend also will shift bearish probably around this level. Take a look that we have really huge resistance cluster at 1.38-1.39 area. Recall monthly target and Fib level and now add 1.27 butterfly target, weekly overbought and inner 1.618 AB=CD target. But fortunately we have pretty a lot of room till this area.
The thing that we do not want to see is a deep and stable return below previous highs around 1.3450 by reasons that we’ve discussed many times on daily time frame.
Daily
So, guys here you see our previous analysis and trading plan that was based on bearish engulfing pattern and what has happened next. Fortunately or unfortunately, but price action currently is rather slow. Trend has turned bearish and market has triggered engulfing pattern, returned right back in previous consolidation but on Friday has made failed effort to return right back above it. Thus, looks like we will have to extend the validity of previous analysis on next week. Anyway, current action we treat as retracement, based on pattern. Target is the same – daily K-support, previous swing high and MPP around 1.34-1.3450. Also it seems that some indecision shrouds market action, but probably this is normal in current situation.
4-hour
Trend holds bullish here. Looks like market has decided not to stop at K-resistance that we had previously but proceed right to major 5/8 resistance. Anyway, this retracement is reasonable for AB=CD pattern. Pattern itself is very harmonic – the speed of legs is equal. Theory tells that price can show any retracement after completion of AB=CD pattern as high as 5/8 Fib level and that has happened. But here we come to major point. If this is really just retracement and market really intends to continue move down, price should not move above this resistance. That’s the major point that we will monitor on coming week here. The downward target is the same and we’ve discussed it already – we have big target/support area in 1.34-1.3450 as on daily as on 4-hour chart.
Conclusion:
On big picture market still has chances to move in 1.38 area and. At least, currently it looks so, although shut down could easily correct technical picture, since markets now stand in extraordinary action and are driven by absolutely different factors.
In such environment it is better to stick with some clear patterns that could give us clear entry, risk points and risk/reward ratio. Thus, on daily we will continue to trade based on engulfing pattern and our first task in the beginning of the week will get assurance that current move up is just a retracement and price will continue move lower. Market could be really thin in the first half of the week.
The technical portion of Sive's analysis owes a great deal to Joe DiNapoli's methods, and uses a number of Joe's proprietary indicators. Please note that Sive's analysis is his own view of the market and is not endorsed by Joe DiNapoli or any related companies.
")