Sive Morten
Special Consultant to the FPA
- Messages
- 18,708
Fundamentals
Today in fundamental part of our research we will take a look at perspectives of US recession in 2020, which also, as usual could impact on the global market. There are some interesting coincidences in markets on EU and US, that could increase effect.
In short-term, we see dollar reversal again. As Reuters reports this has happened due to upbeat U.S. economic data and safe-haven demand on reports U.S. President Donald Trump wants to slap duties on $200 billion of Chinese goods. Higher Treasury yields also lifted the dollar with the 10-year yield touching 3 percent for the first time in six weeks.
Reports that Trump told aides to proceed with tariffs on Chinese goods came after Chinese officials welcomed an invitation from Treasury Secretary Steven Mnuchin for new talks to resolve the Sino-U.S. trade conflict. The reports pushed China’s offshore yuan even lower after initially falling on mixed economic data.
“Generally today’s data showed strong results, which are supporting the dollar,” said Brian Daingerfield, macro strategist at NatWest Securities in Stamford, Connecticut.
U.S. domestic retail sales rose 0.1 percent in August, the smallest gain in six months, but July figures were revised higher, supporting the view of solid consumer spending in the third quarter.
The University of Michigan’s U.S. consumer sentiment data in early September and last month’s industrial output gain also proved to be bright spots.
“You’re just going to get a stronger dollar. It’s not going to be temporary,” said Alicia Levine, BNY Mellon Investment Management’s chief strategist in New York.
Friday’s data offset this week’s disappointing inflation data, which caused traders to cut their bets inflation is accelerating but did not change their view the Federal Reserve would raise interest rates later this month, analysts said.
Chicago Fed President Charles Evans on Friday cautioned the central bank’s rate hikes would take a toll on U.S. growth by 2019.
The first of three Brexit summits are set in the coming week, where EU leaders hope to settle an agreement for departing Britain within the next two months.
Now let's gradually turn to our major topic, probable US crisis in 2020. Now we get very positive data from US across the board - employment, inflation, consumption and sentiment are looks very strong. Rate is rising. GDP shows unbelievable pace for developed country - above 3%. Now the major question is - how long this party will last...
We're not smart enough to take in consideration all fundamental and statistical issues, so let's see what professionals think about it.
Thus, Fathom consulting supports idea of US and dollar domination during nearest 1-2 years probably, but crisis, as they think will happen due US economy overheating.
The new article from Fathom, that dedicated to this issue explains everything in details. Here we bring some extractions from the article.
The event began with a presentation of Fathom’s central, or most likely scenario, which sees the US economy begin to overheat after several years of above trend growth, triggering a recession in 2020. This is not a rerun of the global financial crisis, rather it is a story of good old-fashioned boom and bust. With most of the advanced economies unable to loosen materially either monetary or fiscal policy, the US takes much of the global economy down with it.

The difficulty, as we see it, is that the US economy is growing and is set to continue to grow at a rate that is unsustainable. In our judgement, the trend rate of growth of the US economy is somewhere in the range 1.0%-1.5%
If we are right, both about the starting point for the output gap at the end of last year, and about the pace of economic growth in the US relative to trend both this year and next, then output will move substantially above potential over the next year or two. Other things equal, that will cause US inflation to rise over the coming months. There are already signs in the New York Fed’s underlying inflation gauge, which tends to lead both core and headline CPI measures by a year or two, that pressures are building.

We have developed our own model of recessions, not just in the US but across 17 advanced economies. It includes, in addition to the slope of the yield curve, a range of other macroeconomic and financial market indicators, such as the level of debt in the economy relative to GDP, and our own estimate of the output gap. Feeding in our forecasts for these indicator variables we find that, by the end of 2019, the chances of a US recession will be as high as they have been in the past 60 or more years. This empirical analysis supports the decision we took three months ago to make a US-led global recession in 2020 our central macroeconomic scenario.
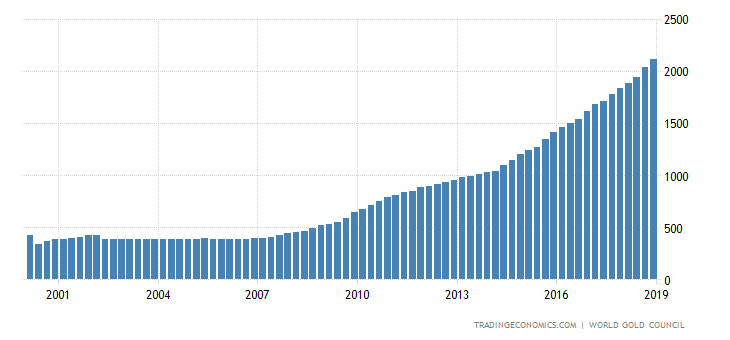
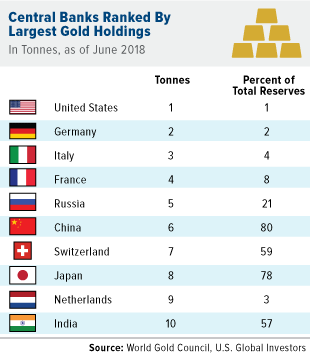
What other signs we see that could confirm or deny this issue. Well, last week we've talked about massive gold buying by emerging markets and repatriating of gold reserves by developed ones. Hardly this is just occasion.
You do not read our gold reports guys ") , but last week we've talked about China and another report by Fathom, which forecasts China economy chill out to the pace around 3%, which is more typical for developed countries, due fall of consumption.
, but last week we've talked about China and another report by Fathom, which forecasts China economy chill out to the pace around 3%, which is more typical for developed countries, due fall of consumption.
If we take a look at statistics of money flow on equity funds and US government bonds funds, then we see real tendency of inflow to bond funds:
Interestingly, fund investors have injected some $39.5 billion net YTD into government-Treasury funds (consisting of the Lipper classifications below), in line to be the largest one-year net inflows into this group on record. Despite learning that wage growth in the recently released nonfarm-payrolls report for August had accelerated (often considered to be a precursor to inflation and generally a drag on fixed income fund valuations), investors continued to pad the coffers of Lipper’s Short U.S. Treasury Funds (+$14.1 billion net), Inflation-Protected Securities Funds (+$11.6 billion), and General U.S. Treasury Funds (+$13.8 billion) classifications.
So, despite the strong YTD returns for equities, we continue to see taxable bond funds (+$115.7 billion net) handily outdrawing equity funds (+$59.4 billion). Investors are taking a more cautious stance, with the most recent bull market’s advance being in its ninth year—the longest bull market since World War II.

Italy will have to re-finance 30% of its national debt in 2020. This really could lead to big problems if problems with liquidity will come. Even now, Italian debt volatility is rising and this is warning sign.
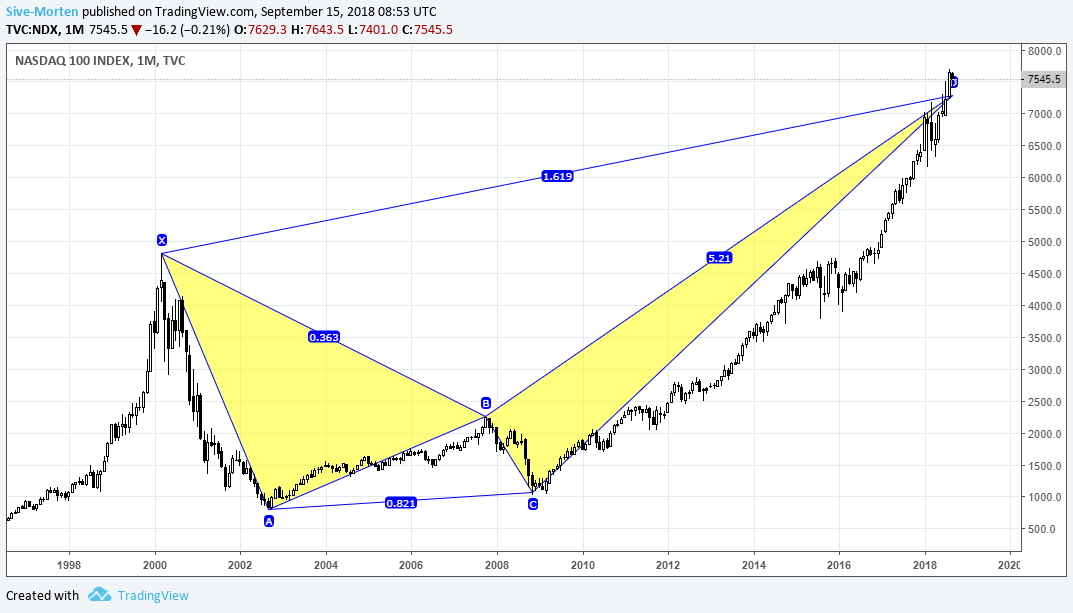
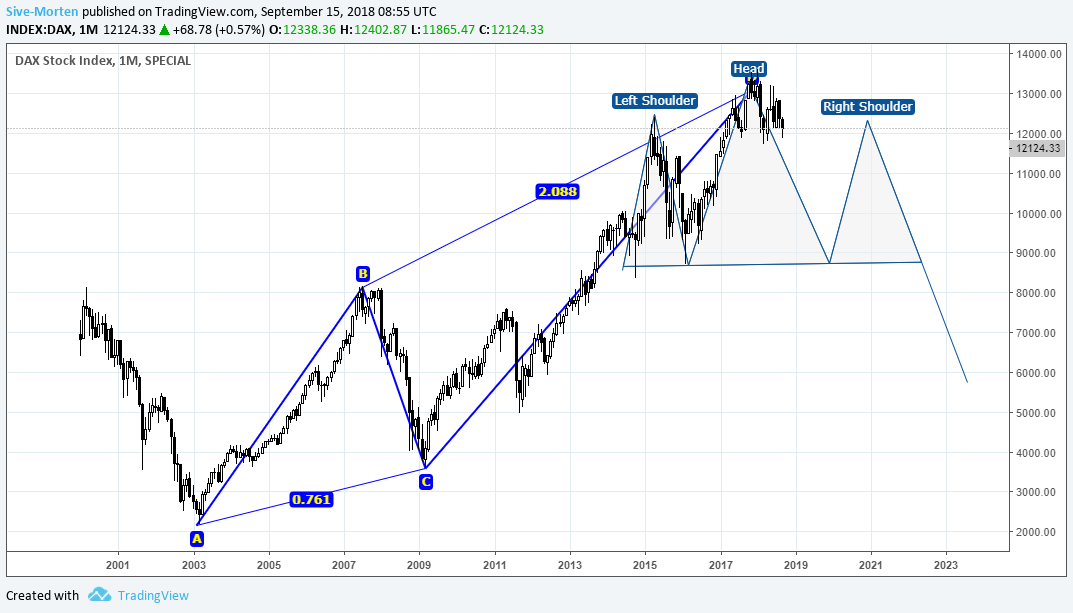
Finally, we could add some technical pictures here. Once I already have shown you German DAX and NASDAQ index, which have completed all time long-term targets.
Here is NASDAQ:
German DAX - completed all time XOP and forming huge H&S pattern, with small H&S on weekly chart at the top of the head.
Finally, my favorite DJIA chart, which I'm looking right now:
DRPO "Sell" right at top of large AB=CD pattern, which could be finalized by weekly butterfly "Sell" pattern:
All these thoughts are just a hypothesis, of course, but since we have a lot of issues of different kind, it is definitely worthy to keep on eye on this scenario.
COT Report
Recent CFTC data shows increasing of positive view on EUR perspectives. At least net position turns positive again for 11K contracts, but open interest has dropped for 9K. Again, as last week, growth is achieved by short covering of speculative positions, rather than new money inflow in long EUR positions.
Monthly
Monthly chart brings nothing new to technical picture yet, as September is started as inside month.
So price still stands at yearly Pivot and we said that this is more the range rather than precise number. Now we see that price feels some gravitation around it and it will be particular interesting and important what reaction price will show on it. This is major 50% Support area as well.
In general reaction that we see within recent 1-2 weeks was not bad and it seems that our expectations are started to realize by price action. This level is important not just because of YPP. Take a look - this is upper border of former 1.05-1.14 consolidation. If price will drop back inside it - it will open road to the bottom of 1.05 area. Price has problems with breaking borders of any consolidation, but it has no barriers inside and could freely move from up to bottom.
Another important moment here - our pennant. In fact, EUR shows right now failure breakout, "bearish trap". Usually it least to opposite breakout, which corresponds to our view on weekly chart.
On Friday EUR has got solid hit, and now we need to estimate either this was a knockdown or it will become a knockout .

Weekly
As we've mentioned last week, EUR shows pullback inside "Morning star" pattern body. This is common practice that happens in 80% cases, when morning star or engulfing pattern been formed. We have mixed result of two weeks action. EUR still can't break through 1.1750 resistance, but, at the same time, it doesn't show deeper pullback and stands around 3/8 Fib support area, which is good.
As we've mentioned previously once bearish reversal swing has been formed - market turned to reasonable upside bounce from major 50% Fib support, weekly Oversold. Last week we recognized here morning star pattern, which suggests upside continuation in a shape of AB-CD pattern on lower time frames. Our approximate target of this action is at least to 1.19 area.

Daily
So, drop on Friday was not a surprise for us. In our Friday update we've said that market has reached multiple intraday targets and could show a pullback on profit taking. At the same time, the speed of drop is a bit greater than we've expected and it doesn't look purely like retracement.
On daily we almost have got reversal session. This drop is too fast for common reaction on intraday targets, which could mean that something else stands behind it.
Particular this doubts make us think that we could get deeper drop and AB=CD action down, which in result could give us "222" Buy pattern.

Intraday
We could accept this reaction if EUR, say, would reach COP target, or at least wash out previous top, but nothing of this kind has happened. On 4H chart we need to keep an eye on triangle trend line. If market will break it down again - this will be important sign that confirms "222" daily idea.

Hourly chart shows more bearish signs. Market as broken our K-support, and, what is more important, natural support/resistance area around 1.1650. Action is straight down, that totally erase previous upside candle. Now market stands at 50% support (not shown) and trendline, it also will open right at WPP - this could lead to minor upside bounce for 30 pips probably. But taking it all together, I suspect that chances on drop back to 1.15 or even lower, to 1.1465 major 5/8 area are extremely high.

Conclusion:
Long situation has not changed much. Our monthly and weekly trading plan stands without big changes by far.
In shorter-term, although EUR keeps bullish context valid, we expect deeper pullback and appearing of different pattern on daily chart now.
The technical portion of Sive's analysis owes a great deal to Joe DiNapoli's methods, and uses a number of Joe's proprietary indicators. Please note that Sive's analysis is his own view of the market and is not endorsed by Joe DiNapoli or any related companies.
Today in fundamental part of our research we will take a look at perspectives of US recession in 2020, which also, as usual could impact on the global market. There are some interesting coincidences in markets on EU and US, that could increase effect.
In short-term, we see dollar reversal again. As Reuters reports this has happened due to upbeat U.S. economic data and safe-haven demand on reports U.S. President Donald Trump wants to slap duties on $200 billion of Chinese goods. Higher Treasury yields also lifted the dollar with the 10-year yield touching 3 percent for the first time in six weeks.
Reports that Trump told aides to proceed with tariffs on Chinese goods came after Chinese officials welcomed an invitation from Treasury Secretary Steven Mnuchin for new talks to resolve the Sino-U.S. trade conflict. The reports pushed China’s offshore yuan even lower after initially falling on mixed economic data.
“Generally today’s data showed strong results, which are supporting the dollar,” said Brian Daingerfield, macro strategist at NatWest Securities in Stamford, Connecticut.
U.S. domestic retail sales rose 0.1 percent in August, the smallest gain in six months, but July figures were revised higher, supporting the view of solid consumer spending in the third quarter.
The University of Michigan’s U.S. consumer sentiment data in early September and last month’s industrial output gain also proved to be bright spots.
“You’re just going to get a stronger dollar. It’s not going to be temporary,” said Alicia Levine, BNY Mellon Investment Management’s chief strategist in New York.
Friday’s data offset this week’s disappointing inflation data, which caused traders to cut their bets inflation is accelerating but did not change their view the Federal Reserve would raise interest rates later this month, analysts said.
Chicago Fed President Charles Evans on Friday cautioned the central bank’s rate hikes would take a toll on U.S. growth by 2019.
The first of three Brexit summits are set in the coming week, where EU leaders hope to settle an agreement for departing Britain within the next two months.
Now let's gradually turn to our major topic, probable US crisis in 2020. Now we get very positive data from US across the board - employment, inflation, consumption and sentiment are looks very strong. Rate is rising. GDP shows unbelievable pace for developed country - above 3%. Now the major question is - how long this party will last...
We're not smart enough to take in consideration all fundamental and statistical issues, so let's see what professionals think about it.
Thus, Fathom consulting supports idea of US and dollar domination during nearest 1-2 years probably, but crisis, as they think will happen due US economy overheating.
The new article from Fathom, that dedicated to this issue explains everything in details. Here we bring some extractions from the article.
The event began with a presentation of Fathom’s central, or most likely scenario, which sees the US economy begin to overheat after several years of above trend growth, triggering a recession in 2020. This is not a rerun of the global financial crisis, rather it is a story of good old-fashioned boom and bust. With most of the advanced economies unable to loosen materially either monetary or fiscal policy, the US takes much of the global economy down with it.
If we are right, both about the starting point for the output gap at the end of last year, and about the pace of economic growth in the US relative to trend both this year and next, then output will move substantially above potential over the next year or two. Other things equal, that will cause US inflation to rise over the coming months. There are already signs in the New York Fed’s underlying inflation gauge, which tends to lead both core and headline CPI measures by a year or two, that pressures are building.
What other signs we see that could confirm or deny this issue. Well, last week we've talked about massive gold buying by emerging markets and repatriating of gold reserves by developed ones. Hardly this is just occasion.
, but last week we've talked about China and another report by Fathom, which forecasts China economy chill out to the pace around 3%, which is more typical for developed countries, due fall of consumption.If we take a look at statistics of money flow on equity funds and US government bonds funds, then we see real tendency of inflow to bond funds:
Interestingly, fund investors have injected some $39.5 billion net YTD into government-Treasury funds (consisting of the Lipper classifications below), in line to be the largest one-year net inflows into this group on record. Despite learning that wage growth in the recently released nonfarm-payrolls report for August had accelerated (often considered to be a precursor to inflation and generally a drag on fixed income fund valuations), investors continued to pad the coffers of Lipper’s Short U.S. Treasury Funds (+$14.1 billion net), Inflation-Protected Securities Funds (+$11.6 billion), and General U.S. Treasury Funds (+$13.8 billion) classifications.
So, despite the strong YTD returns for equities, we continue to see taxable bond funds (+$115.7 billion net) handily outdrawing equity funds (+$59.4 billion). Investors are taking a more cautious stance, with the most recent bull market’s advance being in its ninth year—the longest bull market since World War II.
Finally, we could add some technical pictures here. Once I already have shown you German DAX and NASDAQ index, which have completed all time long-term targets.
Here is NASDAQ:
German DAX - completed all time XOP and forming huge H&S pattern, with small H&S on weekly chart at the top of the head.
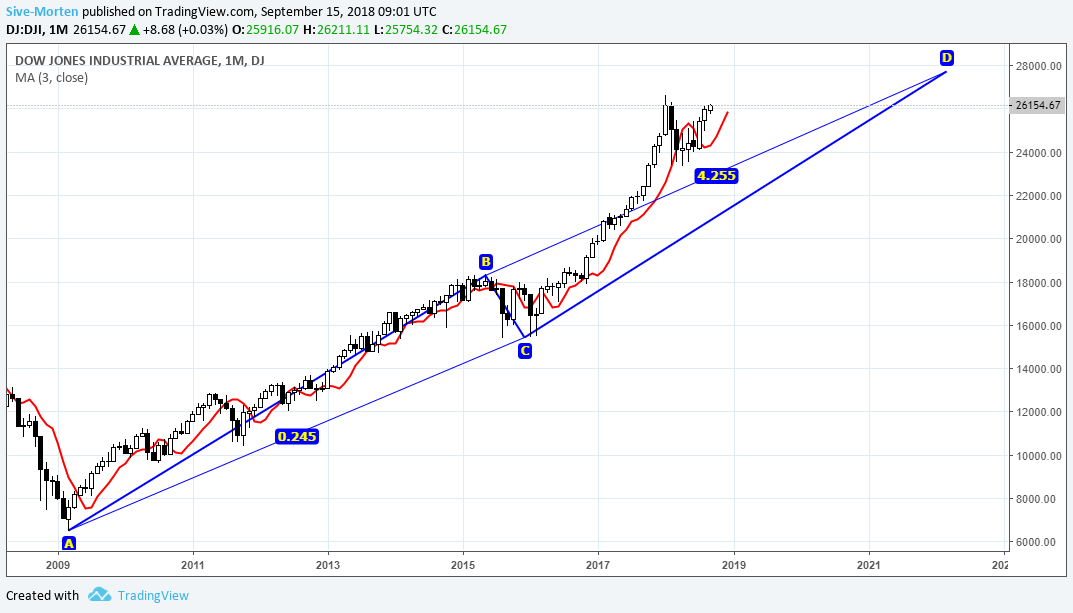
Finally, my favorite DJIA chart, which I'm looking right now:
DRPO "Sell" right at top of large AB=CD pattern, which could be finalized by weekly butterfly "Sell" pattern:
COT Report
Recent CFTC data shows increasing of positive view on EUR perspectives. At least net position turns positive again for 11K contracts, but open interest has dropped for 9K. Again, as last week, growth is achieved by short covering of speculative positions, rather than new money inflow in long EUR positions.
TechnicalsMonthly
Monthly chart brings nothing new to technical picture yet, as September is started as inside month.
So price still stands at yearly Pivot and we said that this is more the range rather than precise number. Now we see that price feels some gravitation around it and it will be particular interesting and important what reaction price will show on it. This is major 50% Support area as well.
In general reaction that we see within recent 1-2 weeks was not bad and it seems that our expectations are started to realize by price action. This level is important not just because of YPP. Take a look - this is upper border of former 1.05-1.14 consolidation. If price will drop back inside it - it will open road to the bottom of 1.05 area. Price has problems with breaking borders of any consolidation, but it has no barriers inside and could freely move from up to bottom.
Another important moment here - our pennant. In fact, EUR shows right now failure breakout, "bearish trap". Usually it least to opposite breakout, which corresponds to our view on weekly chart.
On Friday EUR has got solid hit, and now we need to estimate either this was a knockdown or it will become a knockout .
Weekly
As we've mentioned last week, EUR shows pullback inside "Morning star" pattern body. This is common practice that happens in 80% cases, when morning star or engulfing pattern been formed. We have mixed result of two weeks action. EUR still can't break through 1.1750 resistance, but, at the same time, it doesn't show deeper pullback and stands around 3/8 Fib support area, which is good.
As we've mentioned previously once bearish reversal swing has been formed - market turned to reasonable upside bounce from major 50% Fib support, weekly Oversold. Last week we recognized here morning star pattern, which suggests upside continuation in a shape of AB-CD pattern on lower time frames. Our approximate target of this action is at least to 1.19 area.
Daily
So, drop on Friday was not a surprise for us. In our Friday update we've said that market has reached multiple intraday targets and could show a pullback on profit taking. At the same time, the speed of drop is a bit greater than we've expected and it doesn't look purely like retracement.
On daily we almost have got reversal session. This drop is too fast for common reaction on intraday targets, which could mean that something else stands behind it.
Particular this doubts make us think that we could get deeper drop and AB=CD action down, which in result could give us "222" Buy pattern.
Intraday
We could accept this reaction if EUR, say, would reach COP target, or at least wash out previous top, but nothing of this kind has happened. On 4H chart we need to keep an eye on triangle trend line. If market will break it down again - this will be important sign that confirms "222" daily idea.
Hourly chart shows more bearish signs. Market as broken our K-support, and, what is more important, natural support/resistance area around 1.1650. Action is straight down, that totally erase previous upside candle. Now market stands at 50% support (not shown) and trendline, it also will open right at WPP - this could lead to minor upside bounce for 30 pips probably. But taking it all together, I suspect that chances on drop back to 1.15 or even lower, to 1.1465 major 5/8 area are extremely high.
Conclusion:
Long situation has not changed much. Our monthly and weekly trading plan stands without big changes by far.
In shorter-term, although EUR keeps bullish context valid, we expect deeper pullback and appearing of different pattern on daily chart now.
The technical portion of Sive's analysis owes a great deal to Joe DiNapoli's methods, and uses a number of Joe's proprietary indicators. Please note that Sive's analysis is his own view of the market and is not endorsed by Joe DiNapoli or any related companies.