Sive Morten
Special Consultant to the FPA
- Messages
- 18,699
Monthly
Weekly FX Tading Report prepared by Sive Morten exclusively for ForexPeaceArmy.com
As Reuters reports The dollar posted an 11th straight week of gains against a basket of major currencies on Friday, extending the longest winning streak since its 1971 free float under President Richard Nixon.
The dollar index got extra lift from upwardly revised U.S. gross domestic product data, adding 0.5 percent and hitting a fresh four-year peak of 85.655 even as strategists and traders predicted a pullback in the dollar rally.
Currency rallies rarely run uninterrupted, with just a handful having lasted beyond eight weeks since the 1970s, according to currencies strategist Martin Schwerdtfeger at TD Securities in Toronto.
"Given the impressive rally in the dollar we have seen over the last 2-1/2 months, we wouldn't be surprised if we see a little bit of a pause," Schwerdtfeger said. "That doesn't mean we will have any significant retracement."
A growing divergence of market interest rates on either side of the Atlantic also favors the dollar. Its gains on Friday widened after the U.S. Commerce Department reported the U.S. economy grew at its strongest rate in 2-1/2 years during April, May and June. Department economists raised GDP estimates to show the economy expanded at a 4.6 percent annual rate during the second quarter, the strongest performance since the fourth quarter of 2011.
The data reflected a faster pace of business spending and sturdier export growth than previously estimated, providing a firmer base for third-quarter growth. "This should help soothe some investor worries that U.S. growth momentum would have trouble being sustained, as other major economies remain stuck in the mud," Gennadiy Goldberg, U.S. strategist for TD Securities in New York, told clients.
As add-on to these comments let’s take a look at following chart – forecast of US wages, based on survey by NFIB. Relation between real wages and survey results are solid and this brings confidence with this perspective:
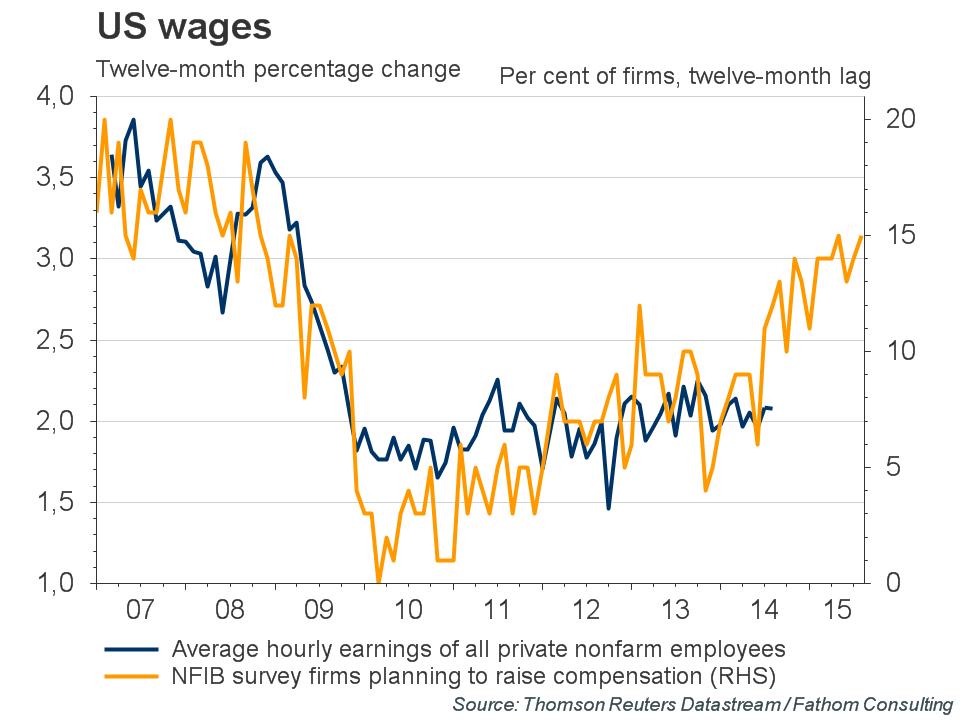
It seems important for us, because, if you remember, major Fed concern on US growth was anemic inflation and no wage dynamic. All other signs of improving already were announced – NFP data, Industry growth, real estate market, consumption etc. Right now it seems that we will see inflation growth soon. Hence, rate hiking is just a question of time and dollar probably will stay on march.
Technical
Today we will take a look at GBP because Scotland referendum has made an impact and adjusted normal market’s behavior. As political turmoil has gone to history market will try to correct the skew that was made by political impact. This in turn, could give us promising setups on different time scales. At the same time we agree that setups that we will discuss today mostly tactical, although they could last for considerable period of time.
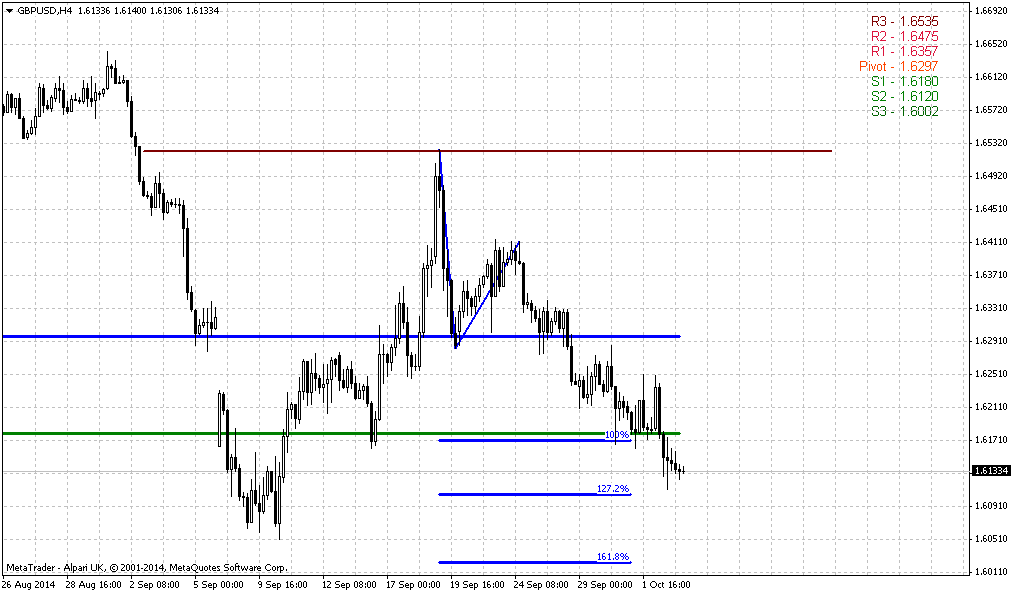
First of all take a look at long-term GBP chart. Here is long time 1.70-1.71 natural support/resistance area. Recall that before shadow of referendum has risen upon Great Britain – pound sterling was on nice upward march. BoE was at the eve of rate hiking and this has led to tremendous upside rally. In general market moves north longer than a whole year and has reached 1.70-1.71:
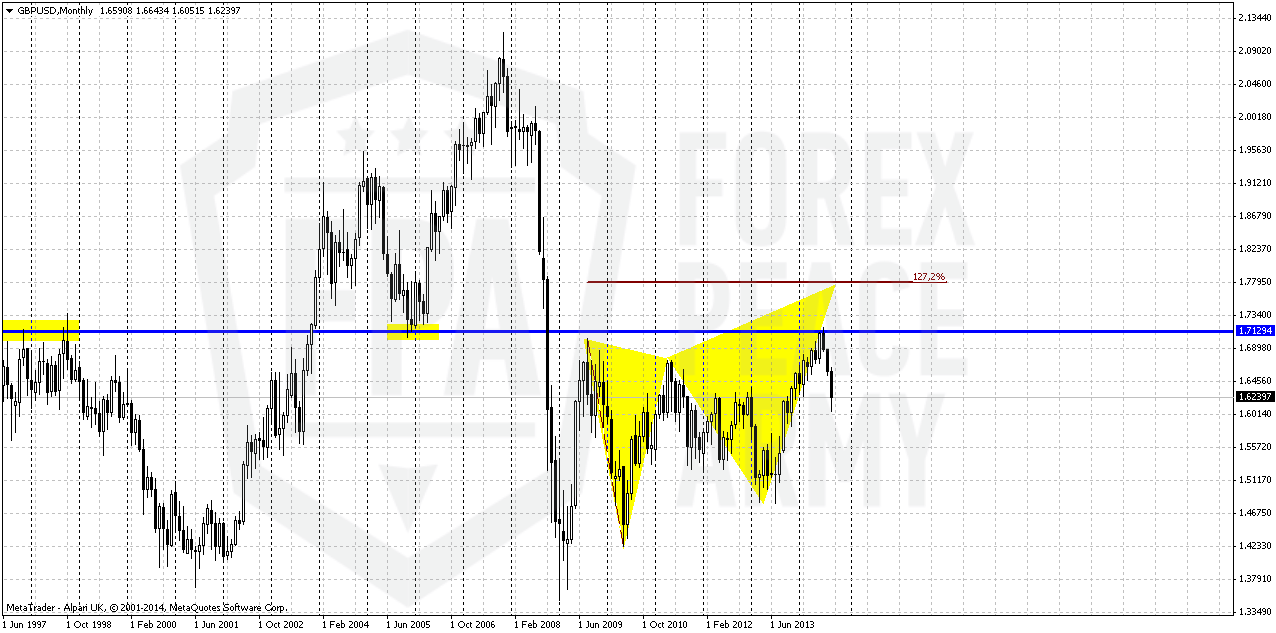
Rumors around Scotland voting have not appeared suddenly but previously they weren’t treated seariously as they should to. On autumn of 2014 public opinion surveys start to show that percent of “Yes” voters are not really small and approaches to 50%. And this has started to worry investors and logically has led to negative impact on GB currency.
As political force was eliminated after voting – we see that market logically should return to previous action and at least return some previous looses. Besides, pure technical view suggests existing of previous upside momentum that has not dissapeared but was temporally muted by political mess. This leads to appearing of monthly DiNapoli B&B “Buy” setup, as it is shown no second chart:
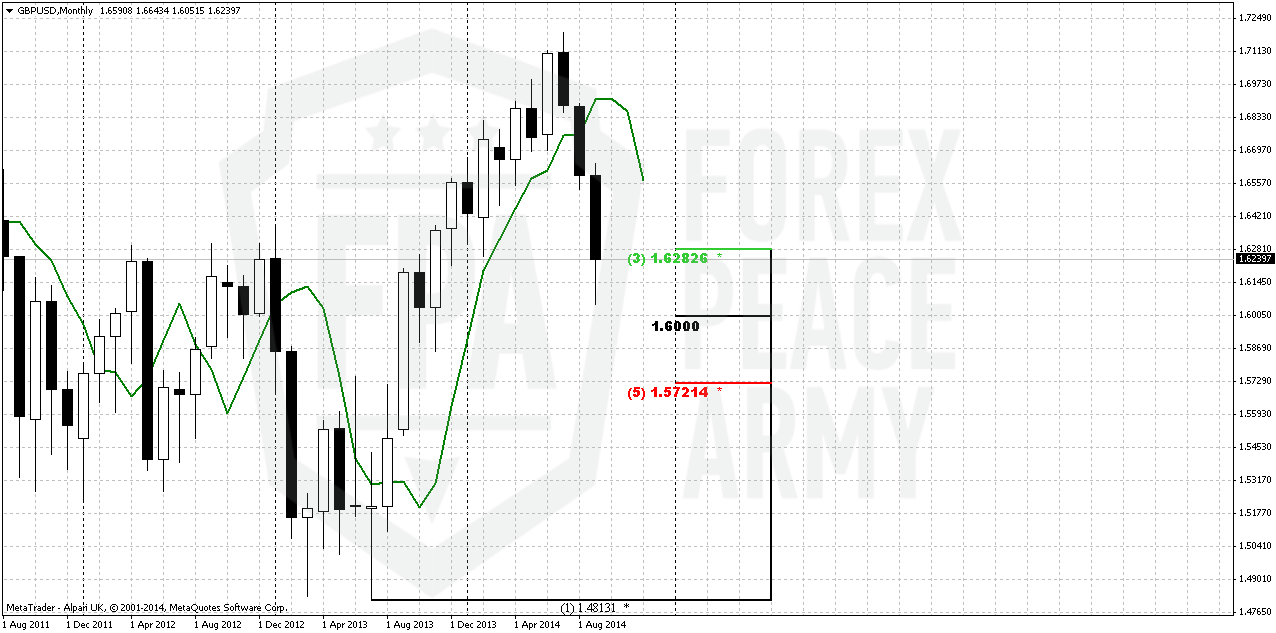
Setup looks perfect. Nice thrust up, close below 3x3 DMA, price has reached significant Fib support (treat it as 3/8 or may be better 50%) within 2 closes below 3x3. Since this is Directional pattern – we do not need trend here, because due DiNapoli framework “Direction overules Trend”. The target of this pattern is 5/8 Fib resistance of total move down after thrust up. As you will see later - right now this is 1.6725 area.
Although B&B is very reliable pattern because it is based not on some trader’s view or opinion or some men-invented patterns, but on real market mechanics, sometimes it still could fail. That’s why reaching of strong support and completion of other conditions are not enough to take position. Since this is monthly pattern – upward action should be visible on lower time frames and probably should start from some clear upside reversal pattern on daily chart. Advantage of this one B&B stands also with its political background – there was a “problem” that now is mostly gone, although some consecquences probably will remain. Anyway this should let market to return previous positions, at least partially and 5/8 upside retracement looks really as a mite and rather realistic target.
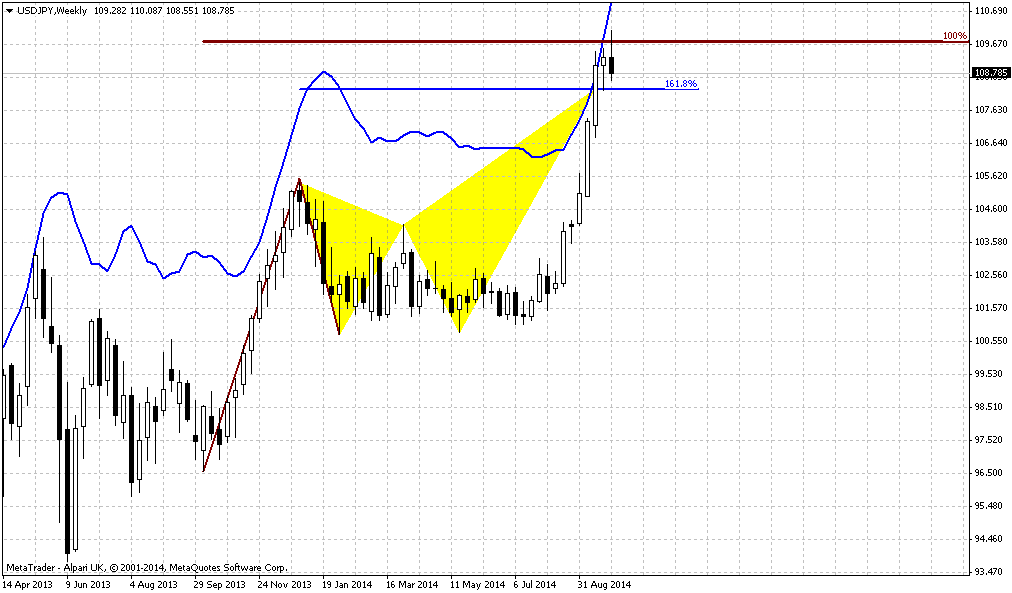
Weekly
On weekly chart trend is bearish (not shown). We do not have many clues here. Major one is weekly oversold right at Fib support(s) that creates another DiNapoli pattern that calls as bullish “Stretch”. Theoretically it suggests upward retracement to an area of the middle between the bands of Oscillator Predictor. This aproximately coincides with 5/8 Fib resistance @1.6725. Also it seems interesting appearing of high wave candle. It indicates reasonable investors’ sentiment “We’ve traded on referendum, no it’s gone and what’s next?” Usually extreme points (i.e. top and bottom) of high wave have significant meaning. Depending on what extreme will be broken – further action will develop in this direction. So, let’s keep an eye on it.
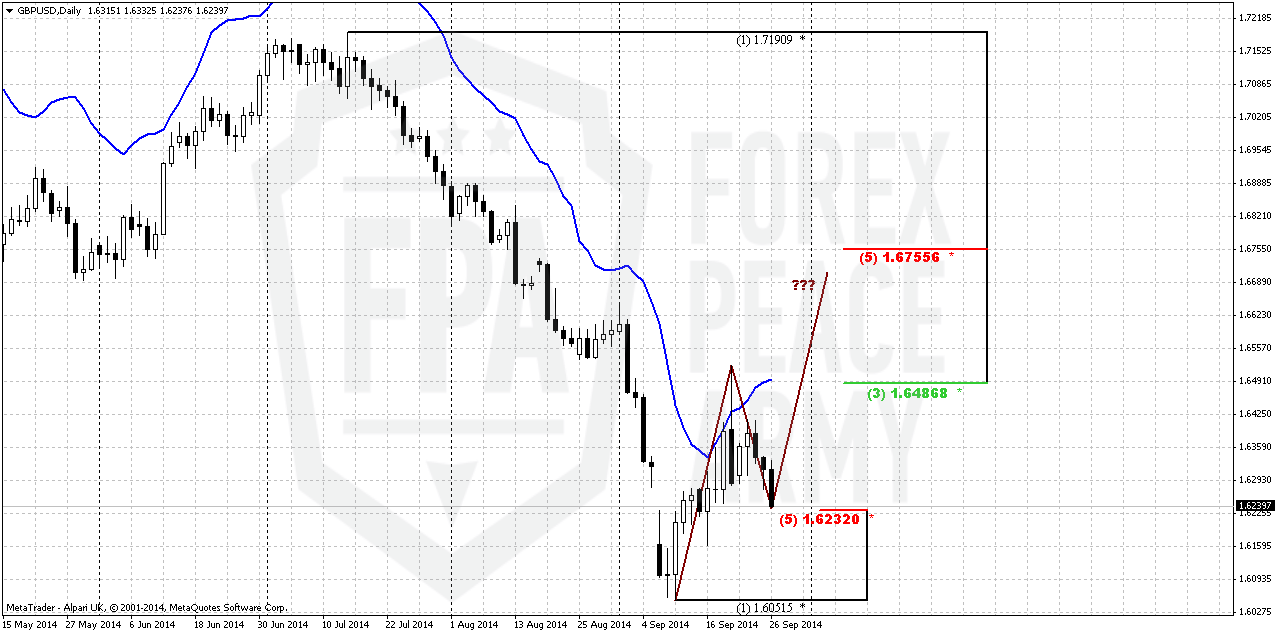
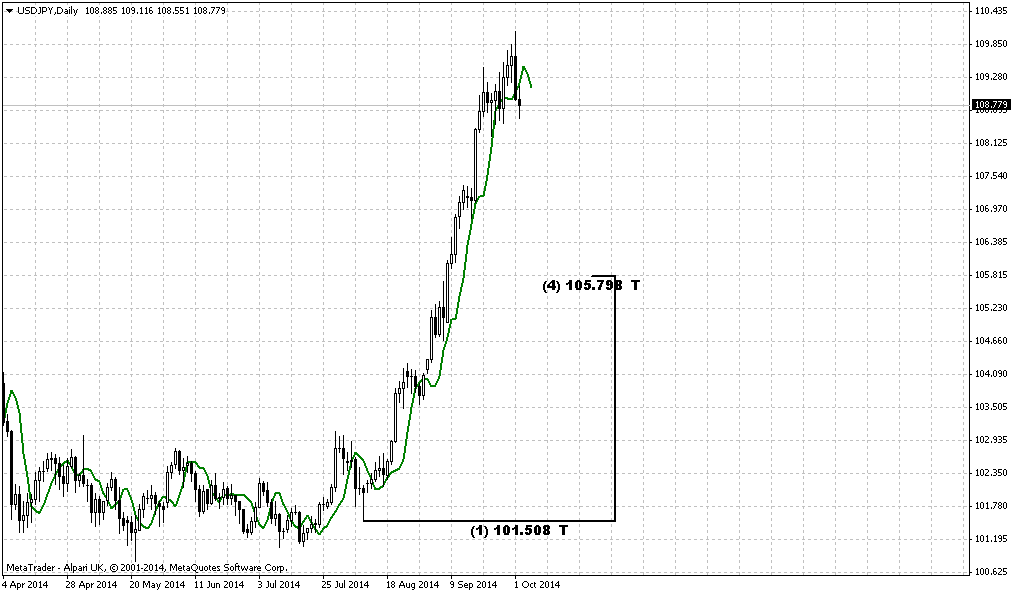
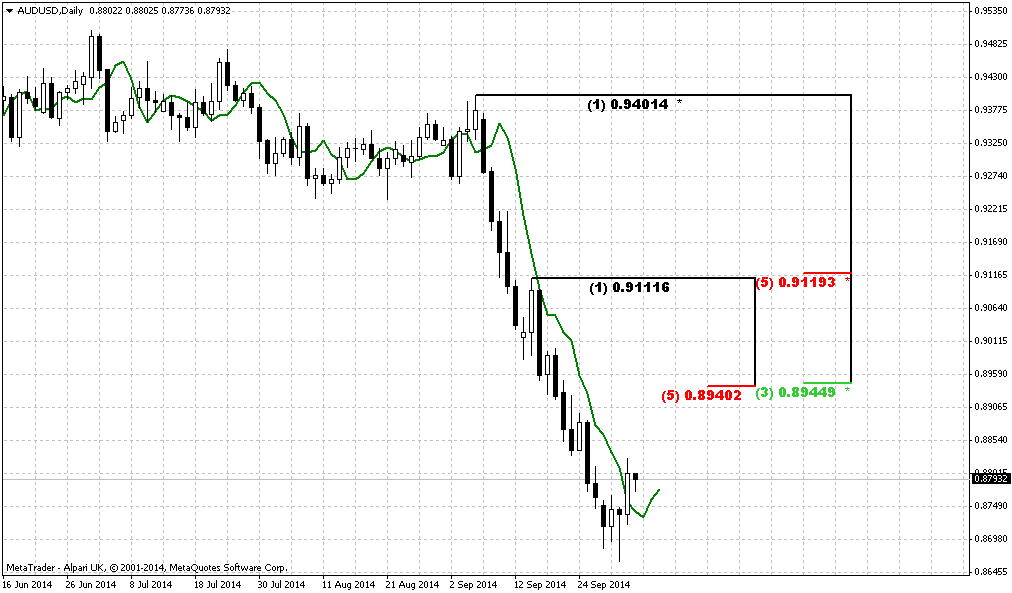
Daily
Daily picture needs a lot of comments. In the beginning we would like to mention our B&B “Sell” pattern that we’ve traded on previous week. It has reached the target at 1.6240. We will not repeat here context of this trade mostly because it is done already, as well as to keep chart clear.
But what is really important – although market has hit B&B target, it absolutely does not mean that it can’t go lower. This is our major concern here. 5/8 Fib support is a “most probable” target, the one that usually hit at B&B’s. It means that upside action to next, bigger target could be different. Even more, if somehow market will create new low – the target also could be adjusted to the downside. Still second scenario right now does not seem as very probable.
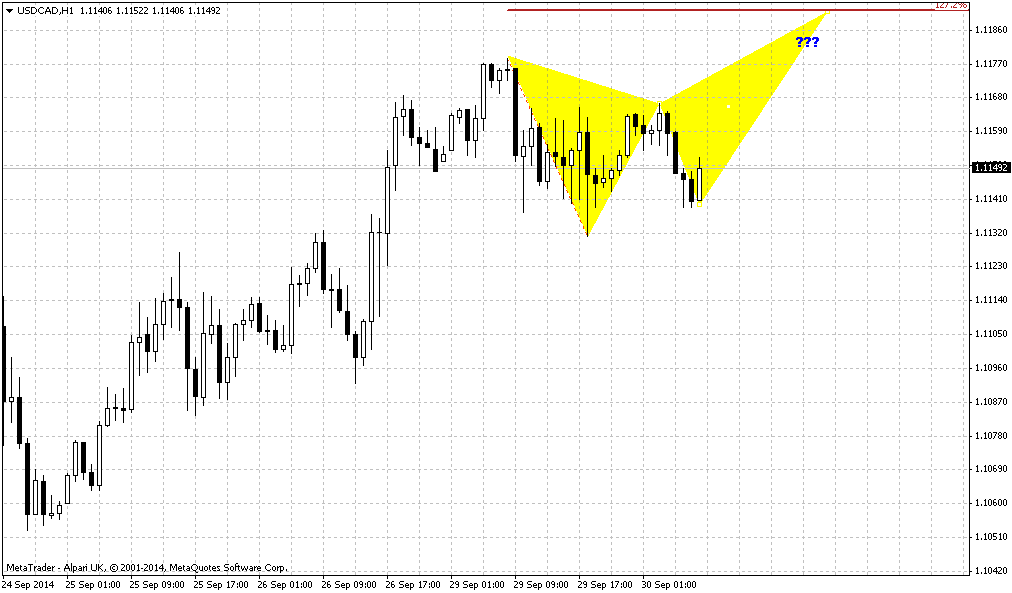
That’s being said, upward action probably will take shape of some AB-CD pattern or wedge. Right now AB=CD seems enough, but any motion lower will demand probably greater ratio – 1.27 AB-CD or even 1.618 one. So, what do we want? First – to get some pattern or price behavior on intraday charts that will give us clear signal that monthly B&B has started. This probably should be something reversal. Second – understand how upside action will happen, what shape it will take. That’s why I’ve placed query marking. Finally monthly target stands beyond overbought and it means that upside action probably will be compounded, not by single leg.
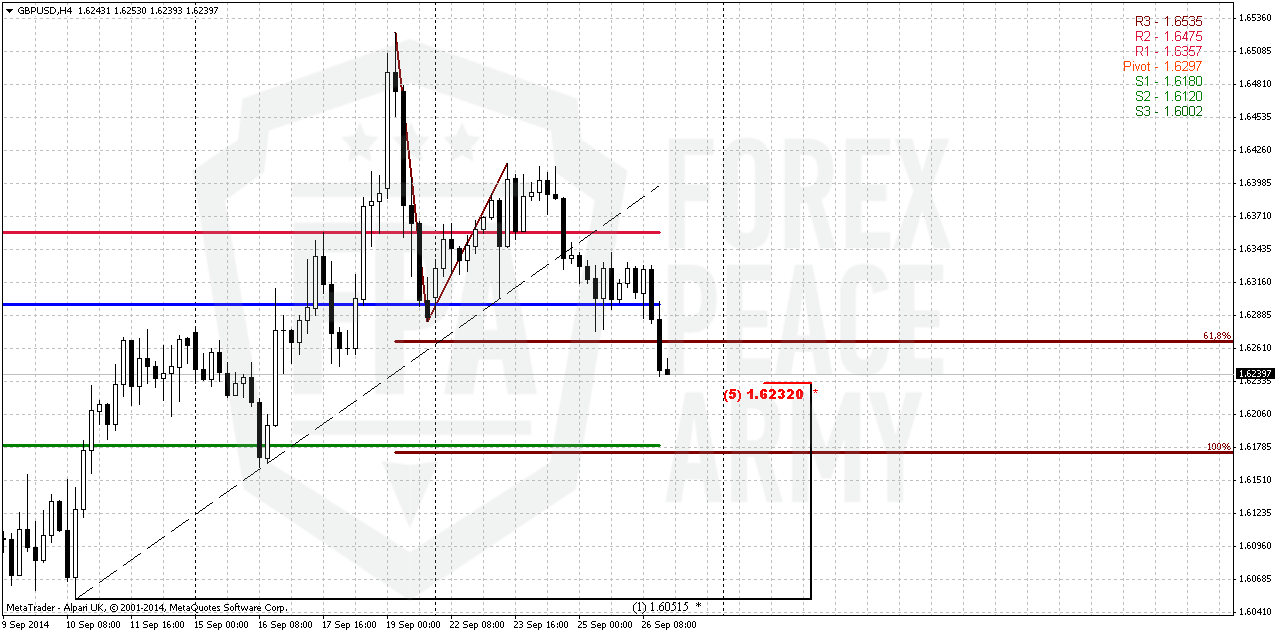
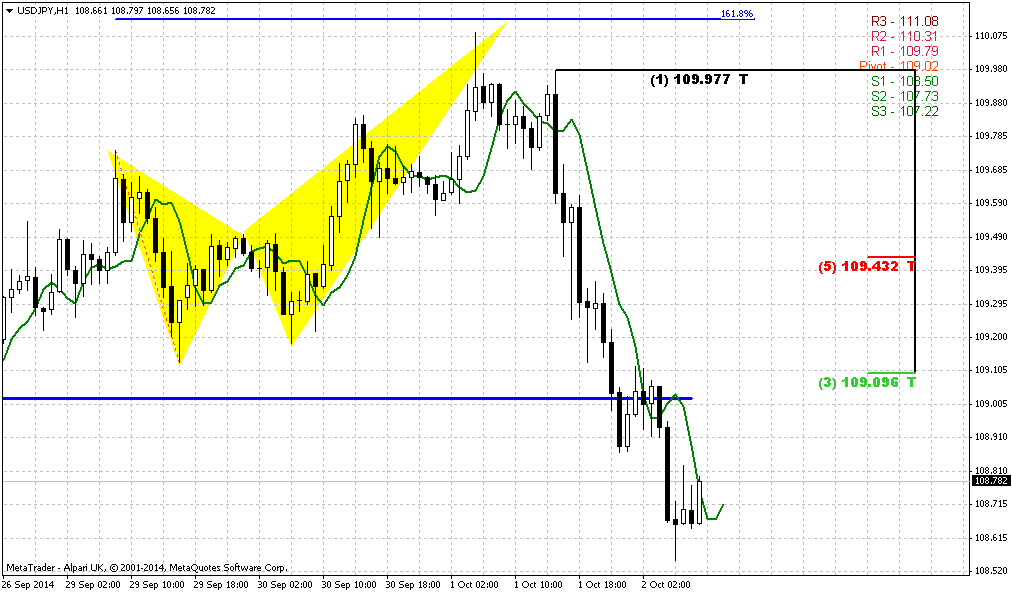
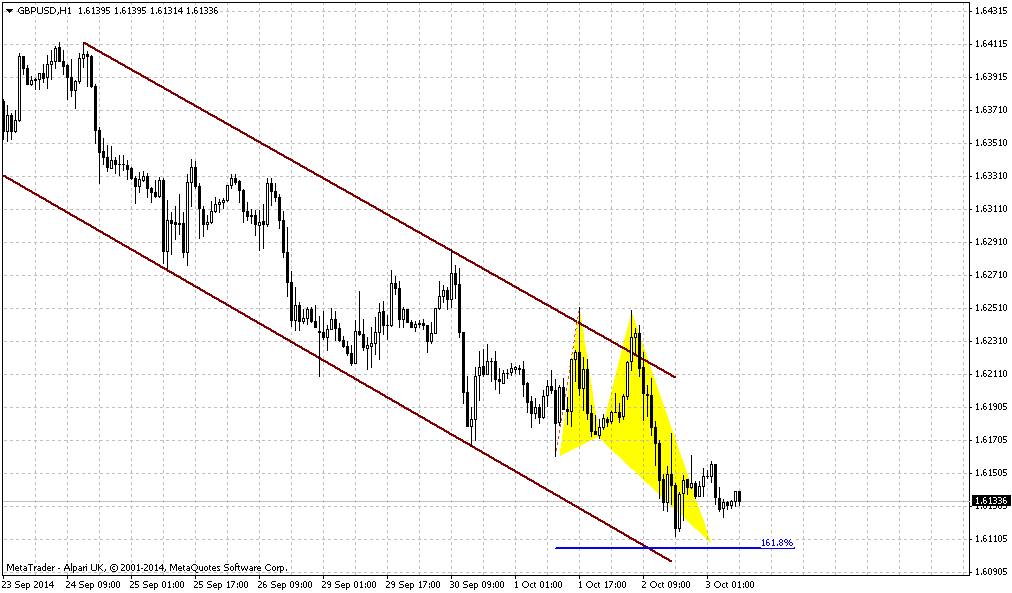
4-hour
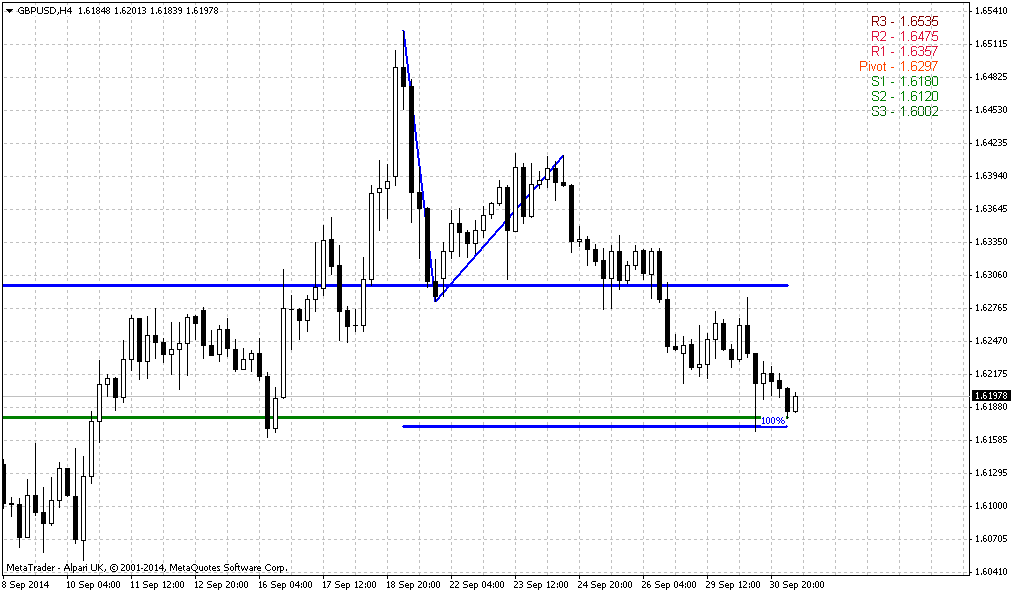
Trend is bearish here. In fact, market stands down with AB=CD pattern. As we see acceleration down below 0.618 extension target, GBP probably will reach 1.0 AB=CD target at 1.6180. This also will be WPS1. At the same time CD leg is slower and flatter than AB and it means that chances on reversal is greater than downward continuation after AB-CD will be completed. We do not see any other patterns or clues here by far.
Conclusion:
So, we are tempted by appetite setup on monthly chart of GBP that looks promising, at least right now. Since this pattern is forming on big picture – it could lasts for weeks and particularly by this reason it looks attractive. Currently we’ve estimated the target of this pattern at 1.6725
In shorter-term perspective we need to catch the moment of upside reversal and it seems that 1.6180 area will be first candidate.
The technical portion of Sive's analysis owes a great deal to Joe DiNapoli's methods, and uses a number of Joe's proprietary indicators. Please note that Sive's analysis is his own view of the market and is not endorsed by Joe DiNapoli or any related companies.
Weekly FX Tading Report prepared by Sive Morten exclusively for ForexPeaceArmy.com
As Reuters reports The dollar posted an 11th straight week of gains against a basket of major currencies on Friday, extending the longest winning streak since its 1971 free float under President Richard Nixon.
The dollar index got extra lift from upwardly revised U.S. gross domestic product data, adding 0.5 percent and hitting a fresh four-year peak of 85.655 even as strategists and traders predicted a pullback in the dollar rally.
Currency rallies rarely run uninterrupted, with just a handful having lasted beyond eight weeks since the 1970s, according to currencies strategist Martin Schwerdtfeger at TD Securities in Toronto.
"Given the impressive rally in the dollar we have seen over the last 2-1/2 months, we wouldn't be surprised if we see a little bit of a pause," Schwerdtfeger said. "That doesn't mean we will have any significant retracement."
A growing divergence of market interest rates on either side of the Atlantic also favors the dollar. Its gains on Friday widened after the U.S. Commerce Department reported the U.S. economy grew at its strongest rate in 2-1/2 years during April, May and June. Department economists raised GDP estimates to show the economy expanded at a 4.6 percent annual rate during the second quarter, the strongest performance since the fourth quarter of 2011.
The data reflected a faster pace of business spending and sturdier export growth than previously estimated, providing a firmer base for third-quarter growth. "This should help soothe some investor worries that U.S. growth momentum would have trouble being sustained, as other major economies remain stuck in the mud," Gennadiy Goldberg, U.S. strategist for TD Securities in New York, told clients.
As add-on to these comments let’s take a look at following chart – forecast of US wages, based on survey by NFIB. Relation between real wages and survey results are solid and this brings confidence with this perspective:
It seems important for us, because, if you remember, major Fed concern on US growth was anemic inflation and no wage dynamic. All other signs of improving already were announced – NFP data, Industry growth, real estate market, consumption etc. Right now it seems that we will see inflation growth soon. Hence, rate hiking is just a question of time and dollar probably will stay on march.
Technical
Today we will take a look at GBP because Scotland referendum has made an impact and adjusted normal market’s behavior. As political turmoil has gone to history market will try to correct the skew that was made by political impact. This in turn, could give us promising setups on different time scales. At the same time we agree that setups that we will discuss today mostly tactical, although they could last for considerable period of time.
First of all take a look at long-term GBP chart. Here is long time 1.70-1.71 natural support/resistance area. Recall that before shadow of referendum has risen upon Great Britain – pound sterling was on nice upward march. BoE was at the eve of rate hiking and this has led to tremendous upside rally. In general market moves north longer than a whole year and has reached 1.70-1.71:
Rumors around Scotland voting have not appeared suddenly but previously they weren’t treated seariously as they should to. On autumn of 2014 public opinion surveys start to show that percent of “Yes” voters are not really small and approaches to 50%. And this has started to worry investors and logically has led to negative impact on GB currency.
As political force was eliminated after voting – we see that market logically should return to previous action and at least return some previous looses. Besides, pure technical view suggests existing of previous upside momentum that has not dissapeared but was temporally muted by political mess. This leads to appearing of monthly DiNapoli B&B “Buy” setup, as it is shown no second chart:
Setup looks perfect. Nice thrust up, close below 3x3 DMA, price has reached significant Fib support (treat it as 3/8 or may be better 50%) within 2 closes below 3x3. Since this is Directional pattern – we do not need trend here, because due DiNapoli framework “Direction overules Trend”. The target of this pattern is 5/8 Fib resistance of total move down after thrust up. As you will see later - right now this is 1.6725 area.
Although B&B is very reliable pattern because it is based not on some trader’s view or opinion or some men-invented patterns, but on real market mechanics, sometimes it still could fail. That’s why reaching of strong support and completion of other conditions are not enough to take position. Since this is monthly pattern – upward action should be visible on lower time frames and probably should start from some clear upside reversal pattern on daily chart. Advantage of this one B&B stands also with its political background – there was a “problem” that now is mostly gone, although some consecquences probably will remain. Anyway this should let market to return previous positions, at least partially and 5/8 upside retracement looks really as a mite and rather realistic target.
Weekly
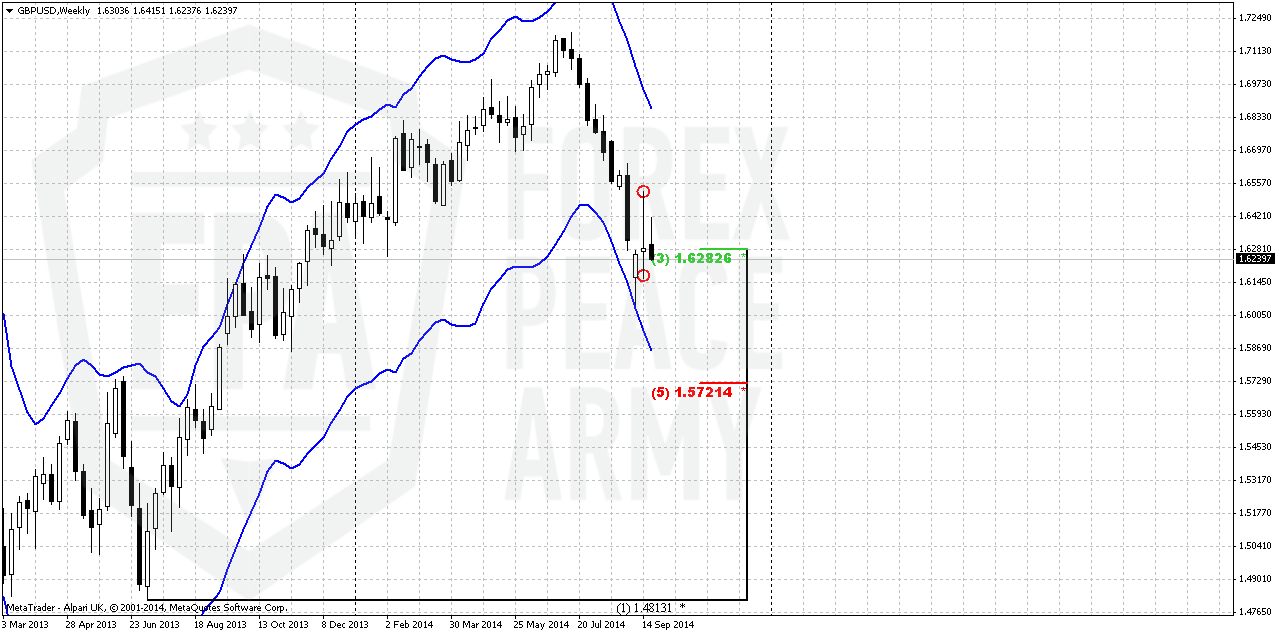
On weekly chart trend is bearish (not shown). We do not have many clues here. Major one is weekly oversold right at Fib support(s) that creates another DiNapoli pattern that calls as bullish “Stretch”. Theoretically it suggests upward retracement to an area of the middle between the bands of Oscillator Predictor. This aproximately coincides with 5/8 Fib resistance @1.6725. Also it seems interesting appearing of high wave candle. It indicates reasonable investors’ sentiment “We’ve traded on referendum, no it’s gone and what’s next?” Usually extreme points (i.e. top and bottom) of high wave have significant meaning. Depending on what extreme will be broken – further action will develop in this direction. So, let’s keep an eye on it.
Daily
Daily picture needs a lot of comments. In the beginning we would like to mention our B&B “Sell” pattern that we’ve traded on previous week. It has reached the target at 1.6240. We will not repeat here context of this trade mostly because it is done already, as well as to keep chart clear.
But what is really important – although market has hit B&B target, it absolutely does not mean that it can’t go lower. This is our major concern here. 5/8 Fib support is a “most probable” target, the one that usually hit at B&B’s. It means that upside action to next, bigger target could be different. Even more, if somehow market will create new low – the target also could be adjusted to the downside. Still second scenario right now does not seem as very probable.
That’s being said, upward action probably will take shape of some AB-CD pattern or wedge. Right now AB=CD seems enough, but any motion lower will demand probably greater ratio – 1.27 AB-CD or even 1.618 one. So, what do we want? First – to get some pattern or price behavior on intraday charts that will give us clear signal that monthly B&B has started. This probably should be something reversal. Second – understand how upside action will happen, what shape it will take. That’s why I’ve placed query marking. Finally monthly target stands beyond overbought and it means that upside action probably will be compounded, not by single leg.
4-hour
Trend is bearish here. In fact, market stands down with AB=CD pattern. As we see acceleration down below 0.618 extension target, GBP probably will reach 1.0 AB=CD target at 1.6180. This also will be WPS1. At the same time CD leg is slower and flatter than AB and it means that chances on reversal is greater than downward continuation after AB-CD will be completed. We do not see any other patterns or clues here by far.
Conclusion:
So, we are tempted by appetite setup on monthly chart of GBP that looks promising, at least right now. Since this pattern is forming on big picture – it could lasts for weeks and particularly by this reason it looks attractive. Currently we’ve estimated the target of this pattern at 1.6725
In shorter-term perspective we need to catch the moment of upside reversal and it seems that 1.6180 area will be first candidate.
The technical portion of Sive's analysis owes a great deal to Joe DiNapoli's methods, and uses a number of Joe's proprietary indicators. Please note that Sive's analysis is his own view of the market and is not endorsed by Joe DiNapoli or any related companies.
")
