The pair has been extremely bullish. It made a strong bullish breakout at a significant level of resistance. The price may come back at the level. If it produces a bullish reversal pattern at the breakout level, it may make another bullish move and make a new higher high.
The pair has been extremely bullish. It made a strong bullish breakout at a significant level of resistance. The price may come back at the level. If it produces a bullish reversal pattern at the breakout level, it may make another bullish move and make a new higher high.
Top of the morning to you all, todays' report is the trade I have taken on GBPJPY . After market opening we saw more continuation to the upside. But Monday saw a big rejection from the supply zone . Tuesday we saw bearish reaction so that was my signal to enter. It is an impulsive entry so I only used 0.5% risk. Aiming for the imbalance on the big daily candle below. Before I will start looking for buys. If you watched my YouTube channel you will know what I was looking for so hope you managed to tag along. Will update again in a few days. GLIYF
The chart looks good to go short. A bullish candle with long upper shadow was followed by a strong bearish Marubozu candle, which states that the Bear may make a move now. Thanks for sharing the chart.
The chart looks good to go short. A bullish candle with long upper shadow was followed by a strong bearish Marubozu candle, which states that the Bear may make a move now. Thanks for sharing the chart.
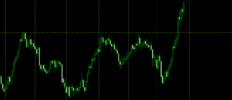
The price has been heading towards the North in the daily chart. It had a strong rejection at 164.500 area earlier. The price may find its resistance again at that area. Both the buyers and the sellers are going to wait to see how the price reacts at that area.
The price has been heading towards the North in the daily chart. It had a strong rejection at 164.500 area earlier. The price may find its resistance again at that area. Both the buyers and the sellers are going to wait to see how the price reacts at that area.
This site uses cookies to help personalise content, tailor your experience and to keep you logged in if you register.
By continuing to use this site, you are consenting to our use of cookies.