IvanGlobalPrime
Company Representative
- Messages
- 36
Find my latest market thoughts
EUR Sold Hard As German PMI Still In Free-fall
The EUR was sold aggressively after the German PMI printed its weakest level in 10 years. The poor results in the manufacturing sector out of France and the EZ as a whole added to the baggage the EUR had to deal with, as was the realization that in Germany, the sluggish manufacturing performance is now spilling over into the services sector as well.
The Daily Edge is authored by Ivan Delgado, Market Insights Commentator at Global Prime. The purpose of this content is to provide an assessment of the market conditions. The report takes an in-depth look of market dynamics, factoring in fundamentals, technicals, inter-market in order to determine daily biases and assist one’s decisions on a regular basis. Feel free to follow Ivan on Twitter & Youtube. You can also subscribe to the mailing list to receive Ivan’s Daily wrap.
Quick Take
The EUR was sold aggressively after the German PMI printed its weakest level in 10 years, which raises the alarm bells of a technical recession in the country. The poor results in the manufacturing sector out of France and the EZ as a whole were a further baggage for the EUR, as was the realization that in Germany, the sluggish manufacturing performance is now spilling over into the services sector as well. The Pound remains in a correction lower aid the tepid action in the Brexit news flows. The USD and CAD indices are both in a constructive path from a technical perspective. Meanwhile, the market prepares to embrace further volatility in the AUD and NZD as RBA Lowe speech and the RBNZ monetary policy meeting come into focus in the next 24h of trading. Lastly, the risk sensitive currencies (CHF, JPY) are both facing major resistance levels, so if holding long exposure in these currencies, be aware that in an indices basis, out performance of these currencies is not the base case.

The indices show the performance of a particular currency vs G8 FX. An educational article about how to build your own currency meter can be found in the Global Prime's Research section.
Narratives In Financial Markets
* The Information is gathered after scanning top publications including the FT, WSJ, Reuters, Bloomberg, ForexLive, Institutional Bank Research reports.
Euro under pressure post German PMI: The German manufacturing came at the weakest level in 10 years (41.4 vs 44 exp), knocking down the EUR and raising a clear red flag that the economic engine in Europe is headed towards a technical recession. Ever since the peak in Dec 2017, the indicator has been going steadily downhill. To make matters worse, in France, a slowdown in the manufacturing sector also ensued (50.3 vs 51.2 exp), leading to the overall EU PMI to print a new low of 45.6 vs 47.3 exp.
German manufacturing spills over into services: What’s especially concerning is that the sluggish performance in manufacturing is starting to spillover into the services sector. Given the bleak outlook, once Lagard takes the baton from Draghi at the helm of the ECB, there will be increasing pressure for her to liaison with other governments in order to fast track structural reforms that allow joint monetary/fiscal collaboration as a new venue to try to stimulate the subdue growth in the new continent.
Draghi stress fiscal collaboration: Outgoing ECB President Draghi has been very vocal as of late about the need for fiscal policies to assist monetary policies as a stimulatory transmission channel for struggling EU economies. In a testimony to the EU Parliament, Draghi said that “the longer the weakness in manufacturing persists, the greater the risks that other sectors of the economy will be affected by the slowdown,'' adding that “the EZ growth has slowed markedly.” It is by now no secret that the growth outlook in the EZ has deteriorated drastically and constantly, yet the fact that Draghi has now been pointing that out publicly also signals the admission that monetary policy-makers no longer have effective options without being more creative in new ways to stimulate economies, hence why monetary/fiscal joint efforts are the next trend.
Fed's wait-and-see endorsed by most Fed members: After a line-up of Fed speakers on Monday, including Daly, Williams, Bullard, and former member Dudley, the median view continued to be that for now the board of members are not keen to apply further downward pressure on the benchmark interest rate. Even if the trade war continues to deteriorate the global outlook, the Fed appears to be rationalizing its wait-and-see stance anchored by the US data outperformance as of late. If the Fed is not ready to act with more cuts this year, the ball will be on Trump’s courtyard to tone down his criticism towards China and find ways to get a deal to minimize the risks of a slowdown in the US. Trump’s tactics to put pressure on the Fed to cut further is falling on deaf ears by the soundbites of Fed members at this point. Trump should take note that even if more headwinds arise from the trade war, the Fed might not be easily persuaded this time.
US PMI comfortably above the 50.00 mark: The latest US data plays into the view that the Fed will be sidelined as evidence indicates the economy is holding up quite well the global slowdown. The US September prelim manufacturing PMI came at 51.0 vs 50.4 expected, even if the services were soft for a second month in a row. Comparatively, the US economy is far ahead than in Europe, but still not showing the healthy levels one was hoping for in early 2019 projections. A red flag in the sub-components of the PMI report included the employment as part of the services survey missing the 50.00 mark for the first time since 2010.
Slow news flows in the US-China trade: On the US-China trade conundrum, it was a low key affair in terms of news flows, with only Treasury Secretary Mnuchin comments worth highlighting. He justified the absence of a Chinese trade delegation’s visit to US farms as part of a planned rescheduling at the request of the US. There have also been reports that China has been ramping up the buying of US soybeans as a sign that the hopes for a temporary compromise are not lost. The newsflows coming out of China with regards to trade may peter out in the coming week though as the country prepares to celebrate the 70th anniversary of the founding of the Chinese Republic.
RBA Lowe speech key, AUD vol expected: A lot of focus will be place in today’s speech by RBA Governor Lowe in Armidale on “An economic update” 2h post the London open at 20:00 AEST. On the heels of the rather poor employment report in Australian last week, where the jobless rate ticked up and full time jobs were lost, the expectations have been quickly building up for Lowe to hint another rate cut by the RBA in October. The market is now pricing in over 80% chance of a cut. According to the Economics Team at NAB: “Given the regional location we would also expect Dr Lowe to highlight the difficult conditions stemming from the drought, as well as developments in Australia’s agricultural exports and how US-China trade tensions may impact. Q&A will also be closely watched with questions likely on how probable QE is and whether Australians can expect negative interest rates given limits to rates cut much further.”
Germany IFO eyed, EUR vol likely: Another major focus in the European session for those holding EUR exposures will come in the form of the German IFO survey and whether or not the reading can offer some type of relief rally in the Euro after the catastrophic printing of the German PMI on Monday. Note, the IFO survey has been historically influential to determine the future projection of the German GDP path, hence a poor reading will keep increasing the fears of a deep recession.
Recent Economic Indicators & Events Ahead

Source: Forexfactory
A Dive Into The Charts

The indices show the performance of a particular currency vs G8 FX. An educational article about how to build your own currency meter can be found in the Global Prime's Research section.
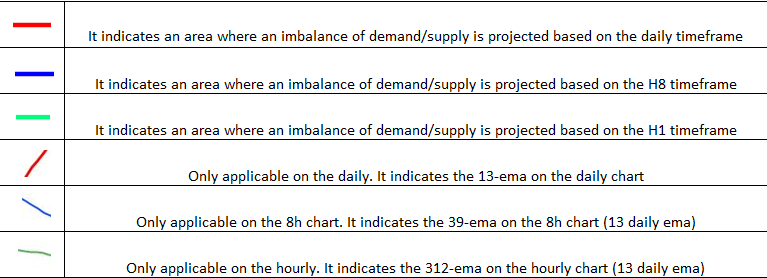
The EUR index has fallen as much as 0.4% after the German PMI miss, finding a temporary relief for those holding EUR long exposure exactly where you’d expect if monitoring the chart, that is, at the red line of horizontal support. The outlook for the index, nonetheless, looks bleak as we’ve now broken below the baseline with the suite of main indicators turning bearish (both the fisher transform and the CCI). Since the decline occurred during Monday, which is typically a low-volume day, there has not been enough sell-side participation to break through the mentioned support level, so we need to wait for a new round of flows today to update the bias as where the EUR trades at is a genuine technical area where a meaningful bounce could ensue, it’s just that neither the structure nor the fundamentals back up the EUR at this stage.
The GBP index has retraced for a second day as the market unwinds its overly committed long exposure, which as I outlined last week, was a dangerous proposition unless one took aim at scalping/momentum-trading. The decline in the last 24h in the Sterling has been on unusually low tick volume activity, which reinforces the notion that the dynamics of the depreciation in the currency are still ‘corrective’ in nature. Now that the 100% proj target has been retaken to the upside, I’d expect any further setbacks to have as much as 0.4% of room to depreciate before buyers potentially regroup at the baseline intersection (13d ema), where a level of support on the 8h chart will act as extra confluence. On the upside, there is an equal amount of space before the 100% proj target is retested if attempts to resume the uptrend ensue.
The USD index retains its bullish outlook with Monday’s price action rather uneventful from a technical standpoint. If anything, it tells us that additional acceptance continues to be found above the baseline amidst the context of a bullish price structure, which is so far backed by the suite of main indicators (fisher transform and CCI). If holding USD long exposure, the chart does telegraph that any weakness in the currency still represent opportunities to buy at better levels, with the constructive outlook retained as long as the support (red line) holds up. I find the stepping-type dynamics of the bull move as a sign of further follow-through demand to come, not to mention that structurally, the index just recently carved out a double bottom.
The CAD index keeps finding stubborn buy-side interest, with the dynamics in the last 3-4 days quite interesting, as the currency tends to be sold through Asian/European hours, only to be bought back up as the North American session comes online. Proof of that via price action are the 3 consecutive lower shadows in the daily candles. There is no technical indication to suggest that the index won’t resume its ascends towards its most recent highs, which effectively gives us about 0.4% of leeway to exploit if aiming to gain CAD long exposure. Technically, the CAD really looks, as in the case of the USD, at a rather attractive position to attract more bids.
The NZD index is about to test a potential sell-side area should it appreciate another 0.2% from the closing price on Monday. It will certainly be much riskier if one considers to gain exposure on the NZD once the resistance level in reg is re-visited. Note, in about 24h, there will be a tremendous increase in the vol of the index as the RBNZ releases its policy decision. The expectations are for the Central Bank to hold the rates in Sept, with the real focus on the policy guidance to gauge if they are looking to prepare the market for a cut in October. If one is going to venture into NZD plays, just be sure to factor in the increase in volatility this Wed morning.
The AUD index has found support where I advocated it would, perfectly respecting the line of support in red drawn in the chart. There is a real possibility that AUD longs get re-built from this level, even if today’s directional bias will be determined by RBA’s Lowe speech as noted above. Just bear in mind that from a technical standpoint, we are at an inflection point where demand flows might be returning into the AUD, especially if the RBA does not sound overly committed to cut rates in the very immediate future (October meeting). If that’s the case, the AUD could be one of the outperformers this Tuesday. If, on the contrary, Lowe hints at a near-term cut, the current bearish momentum may extend,breaking through the support.
The JPY index is retesting a critical level of resistance as depicted in a red line. The upper shadow after the kiss of the level is a testament that this is potentially an area where the sell-side pressure is going to increase quite significantly in the context of what’s arguably still a bearish structure after the impulsive sell-off from the year highs through early Sept. If holding long JPY exposure, be aware that we might have reached a termination point of the existing correction and sellers might be soon taking control over the price action again.
The CHF index has definitely hit what I’d consider to be, unless risk deteriorates significantly, a meaningful top as the price retests the backside of a broken double bottom. I’d imagine sell-side flows may exert enough pressure to see a revisit of the baseline, which allows for about 0.25% of downside room before buying interest returns. There isn’t really much room for the index to maneuver on either side before critical levels are faced, be aware of it.
Important Footnotes
EUR Sold Hard As German PMI Still In Free-fall
The EUR was sold aggressively after the German PMI printed its weakest level in 10 years. The poor results in the manufacturing sector out of France and the EZ as a whole added to the baggage the EUR had to deal with, as was the realization that in Germany, the sluggish manufacturing performance is now spilling over into the services sector as well.
The Daily Edge is authored by Ivan Delgado, Market Insights Commentator at Global Prime. The purpose of this content is to provide an assessment of the market conditions. The report takes an in-depth look of market dynamics, factoring in fundamentals, technicals, inter-market in order to determine daily biases and assist one’s decisions on a regular basis. Feel free to follow Ivan on Twitter & Youtube. You can also subscribe to the mailing list to receive Ivan’s Daily wrap.
Quick Take
The EUR was sold aggressively after the German PMI printed its weakest level in 10 years, which raises the alarm bells of a technical recession in the country. The poor results in the manufacturing sector out of France and the EZ as a whole were a further baggage for the EUR, as was the realization that in Germany, the sluggish manufacturing performance is now spilling over into the services sector as well. The Pound remains in a correction lower aid the tepid action in the Brexit news flows. The USD and CAD indices are both in a constructive path from a technical perspective. Meanwhile, the market prepares to embrace further volatility in the AUD and NZD as RBA Lowe speech and the RBNZ monetary policy meeting come into focus in the next 24h of trading. Lastly, the risk sensitive currencies (CHF, JPY) are both facing major resistance levels, so if holding long exposure in these currencies, be aware that in an indices basis, out performance of these currencies is not the base case.
The indices show the performance of a particular currency vs G8 FX. An educational article about how to build your own currency meter can be found in the Global Prime's Research section.
Narratives In Financial Markets
* The Information is gathered after scanning top publications including the FT, WSJ, Reuters, Bloomberg, ForexLive, Institutional Bank Research reports.
Euro under pressure post German PMI: The German manufacturing came at the weakest level in 10 years (41.4 vs 44 exp), knocking down the EUR and raising a clear red flag that the economic engine in Europe is headed towards a technical recession. Ever since the peak in Dec 2017, the indicator has been going steadily downhill. To make matters worse, in France, a slowdown in the manufacturing sector also ensued (50.3 vs 51.2 exp), leading to the overall EU PMI to print a new low of 45.6 vs 47.3 exp.
German manufacturing spills over into services: What’s especially concerning is that the sluggish performance in manufacturing is starting to spillover into the services sector. Given the bleak outlook, once Lagard takes the baton from Draghi at the helm of the ECB, there will be increasing pressure for her to liaison with other governments in order to fast track structural reforms that allow joint monetary/fiscal collaboration as a new venue to try to stimulate the subdue growth in the new continent.
Draghi stress fiscal collaboration: Outgoing ECB President Draghi has been very vocal as of late about the need for fiscal policies to assist monetary policies as a stimulatory transmission channel for struggling EU economies. In a testimony to the EU Parliament, Draghi said that “the longer the weakness in manufacturing persists, the greater the risks that other sectors of the economy will be affected by the slowdown,'' adding that “the EZ growth has slowed markedly.” It is by now no secret that the growth outlook in the EZ has deteriorated drastically and constantly, yet the fact that Draghi has now been pointing that out publicly also signals the admission that monetary policy-makers no longer have effective options without being more creative in new ways to stimulate economies, hence why monetary/fiscal joint efforts are the next trend.
Fed's wait-and-see endorsed by most Fed members: After a line-up of Fed speakers on Monday, including Daly, Williams, Bullard, and former member Dudley, the median view continued to be that for now the board of members are not keen to apply further downward pressure on the benchmark interest rate. Even if the trade war continues to deteriorate the global outlook, the Fed appears to be rationalizing its wait-and-see stance anchored by the US data outperformance as of late. If the Fed is not ready to act with more cuts this year, the ball will be on Trump’s courtyard to tone down his criticism towards China and find ways to get a deal to minimize the risks of a slowdown in the US. Trump’s tactics to put pressure on the Fed to cut further is falling on deaf ears by the soundbites of Fed members at this point. Trump should take note that even if more headwinds arise from the trade war, the Fed might not be easily persuaded this time.
US PMI comfortably above the 50.00 mark: The latest US data plays into the view that the Fed will be sidelined as evidence indicates the economy is holding up quite well the global slowdown. The US September prelim manufacturing PMI came at 51.0 vs 50.4 expected, even if the services were soft for a second month in a row. Comparatively, the US economy is far ahead than in Europe, but still not showing the healthy levels one was hoping for in early 2019 projections. A red flag in the sub-components of the PMI report included the employment as part of the services survey missing the 50.00 mark for the first time since 2010.
Slow news flows in the US-China trade: On the US-China trade conundrum, it was a low key affair in terms of news flows, with only Treasury Secretary Mnuchin comments worth highlighting. He justified the absence of a Chinese trade delegation’s visit to US farms as part of a planned rescheduling at the request of the US. There have also been reports that China has been ramping up the buying of US soybeans as a sign that the hopes for a temporary compromise are not lost. The newsflows coming out of China with regards to trade may peter out in the coming week though as the country prepares to celebrate the 70th anniversary of the founding of the Chinese Republic.
RBA Lowe speech key, AUD vol expected: A lot of focus will be place in today’s speech by RBA Governor Lowe in Armidale on “An economic update” 2h post the London open at 20:00 AEST. On the heels of the rather poor employment report in Australian last week, where the jobless rate ticked up and full time jobs were lost, the expectations have been quickly building up for Lowe to hint another rate cut by the RBA in October. The market is now pricing in over 80% chance of a cut. According to the Economics Team at NAB: “Given the regional location we would also expect Dr Lowe to highlight the difficult conditions stemming from the drought, as well as developments in Australia’s agricultural exports and how US-China trade tensions may impact. Q&A will also be closely watched with questions likely on how probable QE is and whether Australians can expect negative interest rates given limits to rates cut much further.”
Germany IFO eyed, EUR vol likely: Another major focus in the European session for those holding EUR exposures will come in the form of the German IFO survey and whether or not the reading can offer some type of relief rally in the Euro after the catastrophic printing of the German PMI on Monday. Note, the IFO survey has been historically influential to determine the future projection of the German GDP path, hence a poor reading will keep increasing the fears of a deep recession.
Recent Economic Indicators & Events Ahead
Source: Forexfactory
A Dive Into The Charts
The indices show the performance of a particular currency vs G8 FX. An educational article about how to build your own currency meter can be found in the Global Prime's Research section.
The EUR index has fallen as much as 0.4% after the German PMI miss, finding a temporary relief for those holding EUR long exposure exactly where you’d expect if monitoring the chart, that is, at the red line of horizontal support. The outlook for the index, nonetheless, looks bleak as we’ve now broken below the baseline with the suite of main indicators turning bearish (both the fisher transform and the CCI). Since the decline occurred during Monday, which is typically a low-volume day, there has not been enough sell-side participation to break through the mentioned support level, so we need to wait for a new round of flows today to update the bias as where the EUR trades at is a genuine technical area where a meaningful bounce could ensue, it’s just that neither the structure nor the fundamentals back up the EUR at this stage.
The GBP index has retraced for a second day as the market unwinds its overly committed long exposure, which as I outlined last week, was a dangerous proposition unless one took aim at scalping/momentum-trading. The decline in the last 24h in the Sterling has been on unusually low tick volume activity, which reinforces the notion that the dynamics of the depreciation in the currency are still ‘corrective’ in nature. Now that the 100% proj target has been retaken to the upside, I’d expect any further setbacks to have as much as 0.4% of room to depreciate before buyers potentially regroup at the baseline intersection (13d ema), where a level of support on the 8h chart will act as extra confluence. On the upside, there is an equal amount of space before the 100% proj target is retested if attempts to resume the uptrend ensue.
The USD index retains its bullish outlook with Monday’s price action rather uneventful from a technical standpoint. If anything, it tells us that additional acceptance continues to be found above the baseline amidst the context of a bullish price structure, which is so far backed by the suite of main indicators (fisher transform and CCI). If holding USD long exposure, the chart does telegraph that any weakness in the currency still represent opportunities to buy at better levels, with the constructive outlook retained as long as the support (red line) holds up. I find the stepping-type dynamics of the bull move as a sign of further follow-through demand to come, not to mention that structurally, the index just recently carved out a double bottom.
The CAD index keeps finding stubborn buy-side interest, with the dynamics in the last 3-4 days quite interesting, as the currency tends to be sold through Asian/European hours, only to be bought back up as the North American session comes online. Proof of that via price action are the 3 consecutive lower shadows in the daily candles. There is no technical indication to suggest that the index won’t resume its ascends towards its most recent highs, which effectively gives us about 0.4% of leeway to exploit if aiming to gain CAD long exposure. Technically, the CAD really looks, as in the case of the USD, at a rather attractive position to attract more bids.
The NZD index is about to test a potential sell-side area should it appreciate another 0.2% from the closing price on Monday. It will certainly be much riskier if one considers to gain exposure on the NZD once the resistance level in reg is re-visited. Note, in about 24h, there will be a tremendous increase in the vol of the index as the RBNZ releases its policy decision. The expectations are for the Central Bank to hold the rates in Sept, with the real focus on the policy guidance to gauge if they are looking to prepare the market for a cut in October. If one is going to venture into NZD plays, just be sure to factor in the increase in volatility this Wed morning.
The AUD index has found support where I advocated it would, perfectly respecting the line of support in red drawn in the chart. There is a real possibility that AUD longs get re-built from this level, even if today’s directional bias will be determined by RBA’s Lowe speech as noted above. Just bear in mind that from a technical standpoint, we are at an inflection point where demand flows might be returning into the AUD, especially if the RBA does not sound overly committed to cut rates in the very immediate future (October meeting). If that’s the case, the AUD could be one of the outperformers this Tuesday. If, on the contrary, Lowe hints at a near-term cut, the current bearish momentum may extend,breaking through the support.
The JPY index is retesting a critical level of resistance as depicted in a red line. The upper shadow after the kiss of the level is a testament that this is potentially an area where the sell-side pressure is going to increase quite significantly in the context of what’s arguably still a bearish structure after the impulsive sell-off from the year highs through early Sept. If holding long JPY exposure, be aware that we might have reached a termination point of the existing correction and sellers might be soon taking control over the price action again.
The CHF index has definitely hit what I’d consider to be, unless risk deteriorates significantly, a meaningful top as the price retests the backside of a broken double bottom. I’d imagine sell-side flows may exert enough pressure to see a revisit of the baseline, which allows for about 0.25% of downside room before buying interest returns. There isn’t really much room for the index to maneuver on either side before critical levels are faced, be aware of it.
Important Footnotes
- Risk model: The fact that financial markets have become so intertwined and dynamic makes it essential to stay constantly in tune with market conditions and adapt to new environments. This prop model will assist you to gauge the context that you are trading so that you can significantly reduce the downside risks. To understand the principles applied in the assessment of this model, refer to the tutorial How to Unpack Risk Sentiment Profiles
- Cycles: Markets evolve in cycles followed by a period of distribution and/or accumulation. To understand the principles applied in the assessment of cycles, refer to the tutorial How To Read Market Structures In Forex
- POC: It refers to the point of control. It represents the areas of most interest by trading volume and should act as walls of bids/offers that may result in price reversals. The volume profile analysis tracks trading activity over a specified time period at specified price levels. The study reveals the constant evolution of the market auction process. If you wish to find out more about the importance of the POC, refer to the tutorial How to Read Volume Profile Structures
- Tick Volume: Price updates activity provides great insights into the actual buy or sell-side commitment to be engaged into a specific directional movement. Studies validate that price updates (tick volume) are highly correlated to actual traded volume, with the correlation being very high, when looking at hourly data. If you wish to find out more about the importance tick volume, refer to the tutorial on Why Is Tick Volume Important To Monitor?
- Horizontal Support/Resistance: Unlike levels of dynamic support or resistance or more subjective measurements such as fibonacci retracements, pivot points, trendlines, or other forms of reactive areas, the horizontal lines of support and resistance are universal concepts used by the majority of market participants. It, therefore, makes the areas the most widely followed and relevant to monitor. The Ultimate Guide To Identify Areas Of High Interest In Any Market
- Trendlines: Besides the horizontal lines, trendlines are helpful as a visual representation of the trend. The trendlines are drawn respecting a series of rules that determine the validation of a new cycle being created. Therefore, these trendline drawn in the chart hinge to a certain interpretation of market structures.
- Correlations: Each forex pair has a series of highly correlated assets to assess valuations. This type of study is called inter-market analysis and it involves scoping out anomalies in the ever-evolving global interconnectivity between equities, bonds, currencies, and commodities. If you would like to understand more about this concept, refer to the tutorial How Divergence In Correlated Assets Can Help You Add An Edge.
- Fundamentals: It’s important to highlight that the daily market outlook provided in this report is subject to the impact of the fundamental news. Any unexpected news may cause the price to behave erratically in the short term.
- Projection Targets: The usefulness of the 100% projection resides in the symmetry and harmonic relationships of market cycles. By drawing a 100% projection, you can anticipate the area in the chart where some type of pause and potential reversals in price is likely to occur, due to 1. The side in control of the cycle takes profits 2. Counter-trend positions are added by contrarian players 3. These are price points where limit orders are set by market-makers. You can find out more by reading the tutorial on The Magical 100% Fibonacci Projection