Sive Morten
Special Consultant to the FPA
- Messages
- 18,664
Fundamentals
Gold market this week was able to show minor upward action, and mostly we could say that it was consolidating around previous levels. Recent data release, such as PCE start making lower and lower impact on the market because data seems like minor factor on a background of big political events and banking crisis. Besides, gold more and more now reacts on macro economic events, such as massive USD refusing in mutual trading of big countries, such as Brazil, China, India, M. East countries etc. We're habit to treat them like "emerging countries", but they are not quite "emerging" already. Who calls China as emerging country? Besides, Middle East is a global concentration of population - China, India, Pakistan and other countries - this is 60+% of global population. As we've said yesterday in FX report, USD very fast starts feeling bad, maybe because its share in foreign reserves has dropped from 72% in 1999 down to 59% now.
Second important factor for gold is USD/Yuan fight. Usually it never goes quiet. Depending on who will take the lead, the opposite currency could meet sudden moments of devaluation, and it will be fast and sharp. As soon as the yuan feels confident, dollar devaluations will begin to occur periodically. Moreover, in the style of the fall of the pound sterling in 1949: sharply quickly and painfully. And if it does not, then we will again see the devaluation of the yuan. Or they will take turns doing weird things. We already saw it in 1919-1972 when dollar was replacing pound sterling. Correspondingly, as gold mostly trades in USD - big currencies confrontation should make support impact on it. And when investors start understand this, and that keeping assets in USD only is unsafe right now, demand for gold will rise.
Market overview
Gold prices fell more than 1% on Monday as worries over a crisis in the banking sector subsided, prompting investors to scale back safe-haven trades in favour of riskier assets like equities and crude oil. A buyer for Silicon Valley Bank's deposits and loans helped Wall Street's main indexes open higher, sending gold further below the $2,000 mark breached last week. On the physical front, China's February net gold imports via Hong Kong nearly tripled from the previous month.
Recent banking sector stress and the possibility of a follow-on credit crunch bring the U.S. closer to recession, Minneapolis Fed president Neel Kashkari said. However, U.S. Federal Reserve officials said there was no indication financial stress was worsening.
But on Tuesday Gold was keep moving higher, drawing support from a weaker U.S. dollar even as higher bond yields and easing worries about a full-blown banking crisis limited gains for the safe-haven asset. In the first congressional hearing into the sudden collapse of two U.S. regional lenders and the ensuing chaos in markets, a top U.S. regulator criticized Silicon Valley Bank over its risk management, as lawmakers demanded to know why warning signs of trouble were missed.
Data showed U.S. gross domestic product rose 2.6% in the fourth quarter. The Fed's favored inflation gauge, core personal consumption expenditures (PCE), is due on Friday. Investors will be scanning the data for clues about the path of the U.S. central bank's monetary policy. According to the CME FedWatch tool, markets are pricing in a roughly 50-50 chance of the Fed maintaining rates at current levels at its May meeting.
Federal Reserve Bank of Boston leader Susan Collins said it seemed likely there would be only one more rate hike this year, while Richmond Fed President Thomas Barkin said inflation remains too high and may take longer than expected to decline.
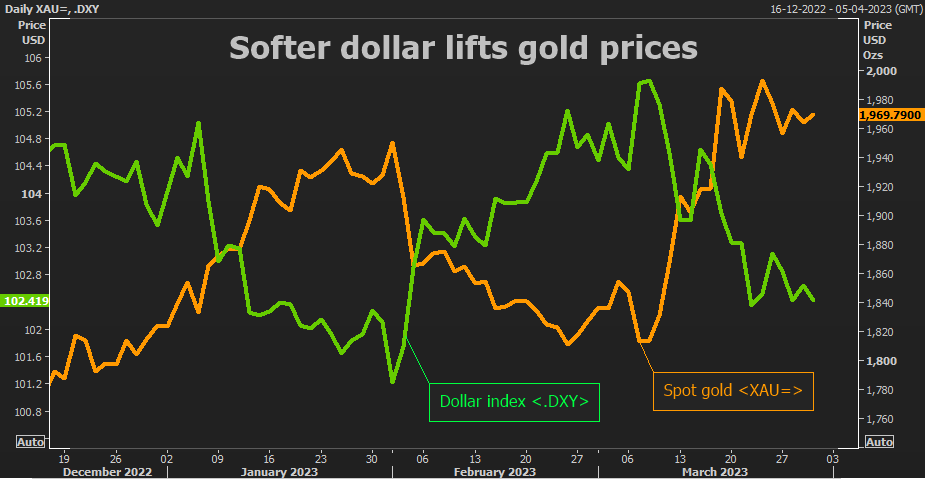
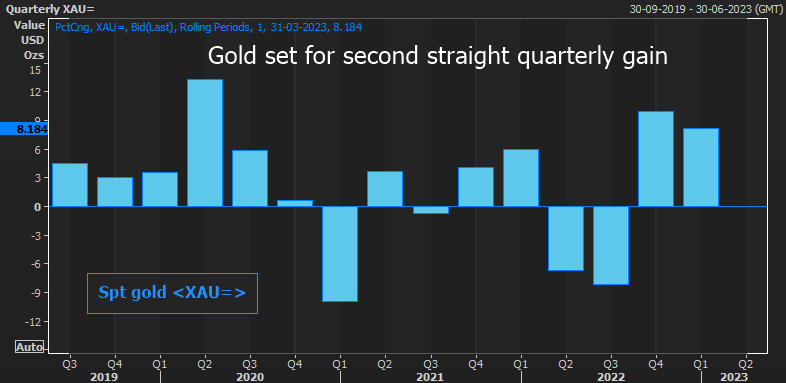
As a bottom line - gold prices were on track for a second straight quarterly rise on Friday, as growing bets that the U.S. Federal Reserve will slow the pace of interest rate hikes drew investors to the metal. The dollar index , while down for the quarter, firmed on Friday, weighing on demand for the greenback-priced gold.
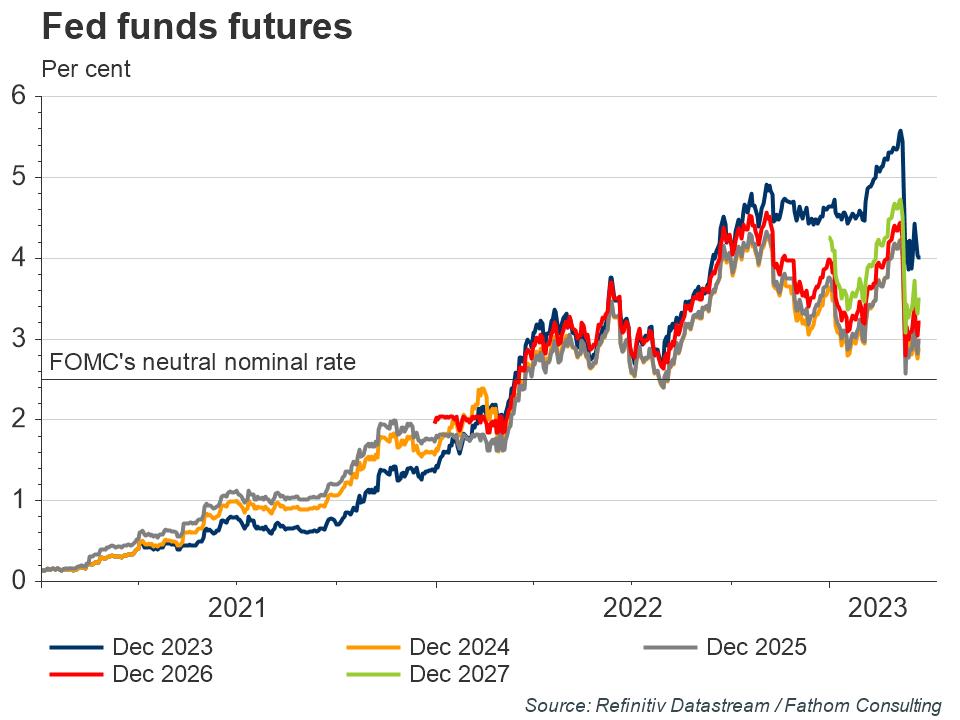
Meantime, many analysts (including us), suggest that market too aggressively re-prices Fed policy, suggesting it will become dovish. As Fathom consulting writes, The re-pricing of near-term US interest rate expectations that occurred in the week following the collapse of Silicon Valley Bank (SVB) on 10 March was as dramatic as any since the stock market crash of 1987. Can this be justified? In this simple, the 150 basis-point fall in the year-end federal funds rate implied by futures prices, from around 5.5% to around 4.0%, would suggest that investors attach around a 25% weight to a re-run of the GFC(Global Financial Crisis). For Fathom Consulting, that implied probability is too high. What if concerns about a re-run of the GFC fade over the next few weeks, and market pricing for US interest rates returns to the levels seen in early March? Then we are in a world where the US policy rate is expected to be more than 150 basis points above the Fed’s estimate of neutral for at least the next four years, even though many economists, and many investors, see a real prospect of recession. From our perspective, rates implied by federal funds futures are a little too low in the near term, but substantially too high further out.
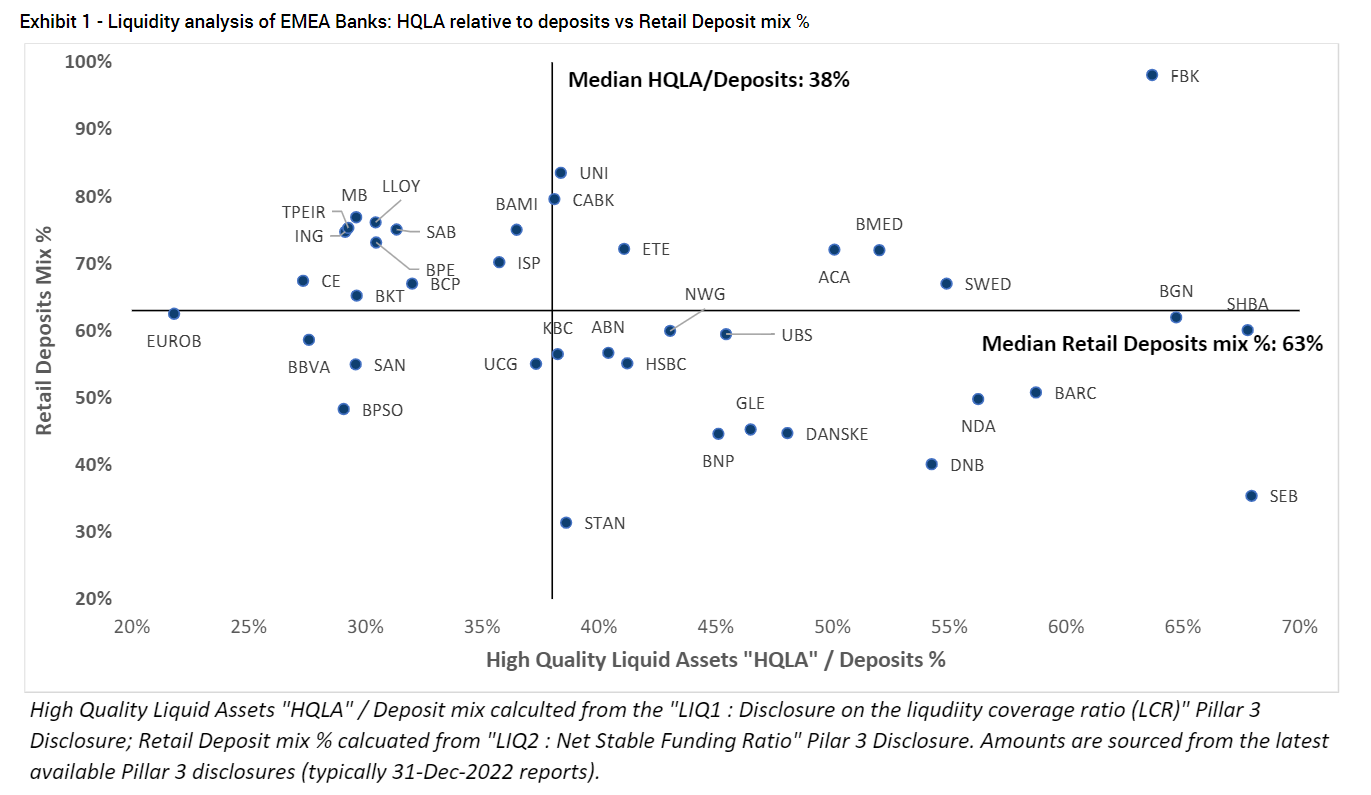
The average European bank could withstand a loss of 38% of its deposits without having to sell at a loss government bond holdings or have a fire sale of illiquid assets, Jefferies analysts said. "Following the unravelling of several U.S. regional banks and the announced rescue merger of Credit Suisse into UBS investors have scrambled to find weak links in the system," Jefferies said in an analysis of bank liquidity.
Jefferies analysed the ability of banks to quickly cover deposit outflows with minimal or no losses, against the level of retail deposits, which comprise 63% of the median bank's deposit base. Retail deposits are an important source of funding stability because they are stickier than corporate deposits and pose mainly a threat in terms of cost of funding, rather than an outright danger of outflows.
Bank lending to euro zone companies slowed for the fourth straight month as an economic downturn and increased caution from lenders appear to be taking their toll, European Central Bank data showed on Monday. Lending to businesses in the 20 nation currency bloc expanded by 5.7% in February after a 6.1% rise a month earlier while household credit growth slowed to 3.2% from 3.6%.
Lending has slowed sharply in recent months on an economic downturn and the fastest rate hikes by the ECB on record, with surveys pointing to even weaker lending figures in the months ahead. The monthly flow of loans to companies was a negative 2.6 billion euros after a mere 1.4 billion euro expansion a month earlier. Growth in the M3 measure of money circulating in the euro zone meanwhile slowed to 2.9% from 3.5%, coming below expectations for 3.2% in a Reuters survey.
Could the Commercial Real Estate Market Be the Next Thing to Break?
Commercial real estate is a good candidate for breakage.The commercial real estate market is under even more pressure due to rising interest rates. As a report by Yahoo Finance noted, “Big owners of property around the country were already under pressure from the Federal Reserve’s aggressive campaign to raise interest rates, which raised borrowing costs and lowered building values.”
Commercial real estate owners also continue to deal with the fallout from government shutdowns of the economy during the COVID pandemic. Even today, a lot of commercial real estate sits empty while people work at home. But there is an even bigger problem looming on the horizon. Loans are coming due.
According to Trepp, $448 billion in commercial real estate (CRE) loans will mature in 2023. Banks hold $227 billion of those loans. Over the next five years, $2.56 trillion in commercial real estate loans will mature with $1.4 trillion held by banks. According to a real estate economist quoted by Yahoo Finance, things were already bad before the bank failures.
According to Yahoo Finance, small to mid-size banks hold most commercial real estate mortgages. According to a report by a Goldman Sachs economist, banks with less than $250 billion in assets hold more than 80% of CRE loans. These are the banks under the most pressure due to this unfolding financial crisis.
In fact, Signature Bank was a big lender in the New York City commercial real estate market, extending loans for office towers and multi-family properties. As of the end of 2022, Signature held some $36 billion in commercial real estate loans.
We’ve already seen signs of stress in the commercial real estate market. Last month, Columbia Property Trust defaulted on $1.7 billion in floating-rate loans tied to seven buildings in New York, San Francisco, Boston, and Jersey City. Shortly thereafter, Brookfield Asset Management defaulted on $750 million-plus in debt backing two LA office towers. BlackRock Global Fixed Income CIO Rick Rieder told Yahoo Finance the problem won’t resolve itself anytime soon.
Borrowers will likely face tightening lending standards in the days ahead. According to a Goldman Sachs note, bank lending levels had already tightened significantly over the last two quarters as recession fears ramped up. Banking system instability will lead to even more tightening of credit.
Mainstream economists and Fed officials insist that the banking system is sound. Economists quoted in the Yahoo Finance article insisted that the issues in the commercial real estate market don’t pose a systemic risk. Everything will be OK, they claim. But these same people told us the subprime problem in 2007 was contained, inflation was transitory, and quantitative easing was a temporary program that would be unwound. In other words, they don’t have the best track record.
So, what?
Given the fact that no nation in history has defeated a recession with a strong currency or rising rates, and given the fact that our current bond market is literally screaming for trillions in liquidity, there’s no alternative in the months and years ahead to prevent this real-time bond crisis from sending the world into a global depression without resorting to more magical, instant and completely artificial liquidity.
In short, expect more mouse-click trillions and more inherently inflationary (and hence currency-destroying) QE or QE-like backdoor mechanizations (i.e., repo games, bank bailouts/ins, discount window loans, cash swaps etc.).
In fact, we are all currently living under a banalization of real-time economic evil, a waste of such magnitude that it is tilting us inevitably toward a financial crisis with unavoidable human consequences and political de-volutions. First is, lost of faith into bond market. Let’s just look at the unprecedented (and so-oft predicted/warned) volatility in the UST market of recent days.
Last week, for example, liquidity in US Treasuries (and German bunds, btw) sank like a rock, with ripple effects throughout the world. On Monday, the 2-Year UST saw yields fall in single-day trading to levels not seen since 1987. By Tuesday and Wednesday, intra-day volatility levels in the UST market surpassed those of the Great Financial Crisis of 2008.
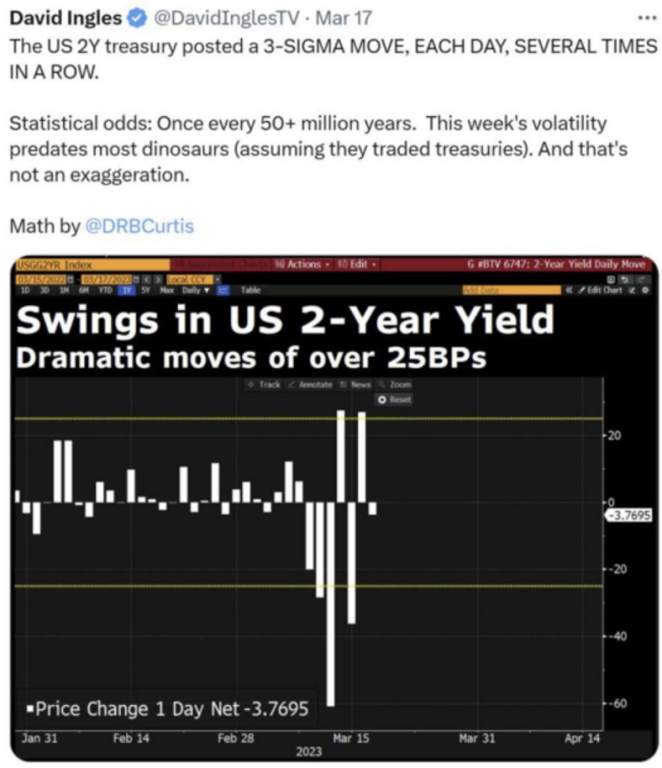
As Bloomberg’s David Ingles confirmed, last-week’s extreme volatility and yield-moves in the 2-Year UST posted 3-sigma moves, something that MIT mathematicians argue should only occur statistically once every 50+ million years.
Eventually this very same bond market, under the pressure of Powell’s Volcker-enamoured ego and rate hikes, would eventually “break,” and oh boy, has it broken. A bursting bond market would require oceans of new liquidity to prevent the UST volatility from blowing up global banking, FX, bond and risk asset markets.
This was easy to see because we respect basic math, history and common sense, three skills which policy makers around the world are doing their very best to “cancel.”
In short, the bond market is more accurate, honest and predictable than policy makers like Powell, or openly asleep-at-the-wheel leaders pushed into power (for easy and pre-planned manipulation) like Biden. Or stated even more simply: The bond market has broken because, well… all bubbles always and inevitably do the same thing: They pop.
The only way to hide and “solve” the greatest sovereign bond iceberg (crisis) in history is to bury it beneath wave after wave of mouse-clicked, debased and hence increasingly worthless fiat currencies. In short, the Fed will hide its latest credit bubble behind the last and only bubble it has left in a history-confirmed pattern used by all failed financial regimes, namely: Creating a currency crisis (i.e., debased money) to solve a debt crisis.
Of course, if you read that last line (as well as centuries of economic history) correctly, this just means there are no solutions left, just a choice of crisis options: drowning bonds or drowning currencies.
The hawks, it seems, somehow believe that they can raise rates (to as high as 7%) to kill mis-reported inflation (as high as 16%) [???] without killing the credit market.
At the same time, however, Powell needs inflation to outpace interest rates to achieve a deep enough slope of negative real rates to inflate away the USA’s $31T public debt. Like Captain Smith on the Titanic, Powell is trying hard to stay calm but knows the end game.
Powell will ultimately be forced to kill the currency to allegedly save the credit markets—thus once again squeezing one bubble (in credit) into another bubble (currency), which is what all the central bankers have been doing for years: Pushing one bubble into the next until the final one pops. This eventually means letting the USD expand in supply and hence sink in value.
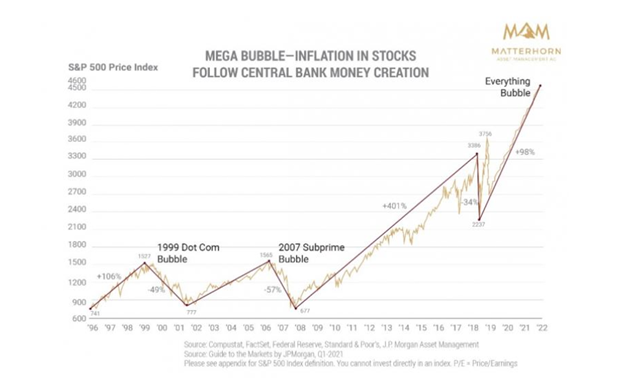
As per the bars at the far right of the graph below, for the 1st time in 60years, we saw a UST market (blue bar) fell faster and further than a top-20 stock market drawdown (grey bar).
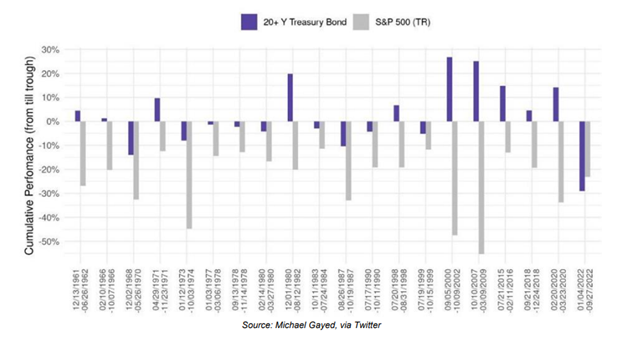
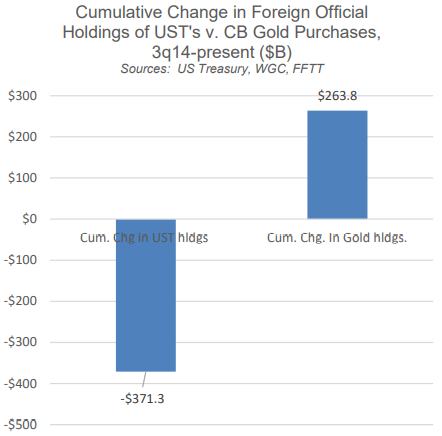
Bonds are falling in price because demand is falling in fact. This bond drop is not because of inflation, but because no one trusts the debtor—i.e., Uncle Sam. Unlike the 70’s, US debt to GDP today is at 125+%, and thus American IOUs today just aren’t what they were yesterday. This collective lack of faith in USTs and USDs is why global central banks are swapping out USTs and buying physical gold…
Conclusion:
Analysis of last week events tells few important moments. First is - market overvalues Fed's dovish sentiment. In fact, BlackRock and other analysts told about it earlier, and we've explained why. Second - the most probable way of Fed action for now is printing & hiking. But as printing as hiking should be done selectively. Hiking is with small steps, say 25 points on every meeting. While printing is on the occasion, when something else will break. This could let the Fed to expand timing and keep the face of "fight with inflation". But the end will inevitably bad. Inflation will not decrease, and, probably somewhere in May-June we should see another upside spiral. Negative interest rates will stay for long which trigger drop in demand from foreign investors. Worsen USD global position could lead to sporadic moments of devaluation if global economic situation keep going in the same trend and same pace. Within a year we get first fruits of massive dollar denying in global transfers.
For the US it will become more difficult to export inflation outside. If earlier, dollar drop makes goods and commodities more expensive across the globe and countries were had to get more dollars to pay for them, devaluing own national currencies - now situation could start to change and higher prices will be only in USD. Besides, so toxic combination of national debt ceil, record budget deficit and outstanding negative trading balance with big drop in demand to national debt gives very limited space to the Fed maneuver. Personally I do not see any solutions except printing and grabbing all possible cash out of stock and crypto markets by keeping high interest rates for some time. All these moment create can of worms and big uncertainty. And it seems that gold definitely become handy in this muddy water.
Gold market this week was able to show minor upward action, and mostly we could say that it was consolidating around previous levels. Recent data release, such as PCE start making lower and lower impact on the market because data seems like minor factor on a background of big political events and banking crisis. Besides, gold more and more now reacts on macro economic events, such as massive USD refusing in mutual trading of big countries, such as Brazil, China, India, M. East countries etc. We're habit to treat them like "emerging countries", but they are not quite "emerging" already. Who calls China as emerging country? Besides, Middle East is a global concentration of population - China, India, Pakistan and other countries - this is 60+% of global population. As we've said yesterday in FX report, USD very fast starts feeling bad, maybe because its share in foreign reserves has dropped from 72% in 1999 down to 59% now.
Second important factor for gold is USD/Yuan fight. Usually it never goes quiet. Depending on who will take the lead, the opposite currency could meet sudden moments of devaluation, and it will be fast and sharp. As soon as the yuan feels confident, dollar devaluations will begin to occur periodically. Moreover, in the style of the fall of the pound sterling in 1949: sharply quickly and painfully. And if it does not, then we will again see the devaluation of the yuan. Or they will take turns doing weird things. We already saw it in 1919-1972 when dollar was replacing pound sterling. Correspondingly, as gold mostly trades in USD - big currencies confrontation should make support impact on it. And when investors start understand this, and that keeping assets in USD only is unsafe right now, demand for gold will rise.
Market overview
Gold prices fell more than 1% on Monday as worries over a crisis in the banking sector subsided, prompting investors to scale back safe-haven trades in favour of riskier assets like equities and crude oil. A buyer for Silicon Valley Bank's deposits and loans helped Wall Street's main indexes open higher, sending gold further below the $2,000 mark breached last week. On the physical front, China's February net gold imports via Hong Kong nearly tripled from the previous month.
"There is a sense of calm in the markets and a flight back into some of the risk-on assets, and all the safety trades like gold are starting to sell off, said Phillip Streible, chief market strategist at Blue Line Futures in Chicago. Much of the rally on the gold market was really short-covering," Streible said, adding that prices were likely going to continue to come under pressure.
Recent banking sector stress and the possibility of a follow-on credit crunch bring the U.S. closer to recession, Minneapolis Fed president Neel Kashkari said. However, U.S. Federal Reserve officials said there was no indication financial stress was worsening.
"After kissing the psychological $2,000 level last week, bears exploited this resistance to attack. Appetite for the precious metal has also been dampened by a stabilising dollar and mixed signals on monetary policy from the Fed," said Lukman Otunuga, senior research analyst at FXTM.
But on Tuesday Gold was keep moving higher, drawing support from a weaker U.S. dollar even as higher bond yields and easing worries about a full-blown banking crisis limited gains for the safe-haven asset. In the first congressional hearing into the sudden collapse of two U.S. regional lenders and the ensuing chaos in markets, a top U.S. regulator criticized Silicon Valley Bank over its risk management, as lawmakers demanded to know why warning signs of trouble were missed.
"The weaker U.S. dollar index today is adding to some buying interest in the gold market. However, solid buying interest is being squelched by the fact that the banking crisis, at least for the moment, seems to have stabilized," said Jim Wyckoff, senior analyst at Kitco Metals. The marketplace is still tentative in that regard, and that's going to keep risk appetite contained for at least the next couple weeks until we think we've moved past this crisis," added Wyckoff.
On Wed declines in safe-haven bullion have been fairly contained so far, signalling lingering worries about the banking sector. Higher rates tend to dull zero-yield gold's appeal.In the near term, gold prices could slip to $1,933, but the outlook for gold remains bullish with fast approaching peak in U.S. rates and a danger of hitting a recession in coming months, said Ole Hansen, head of commodity strategy at Saxo Bank.
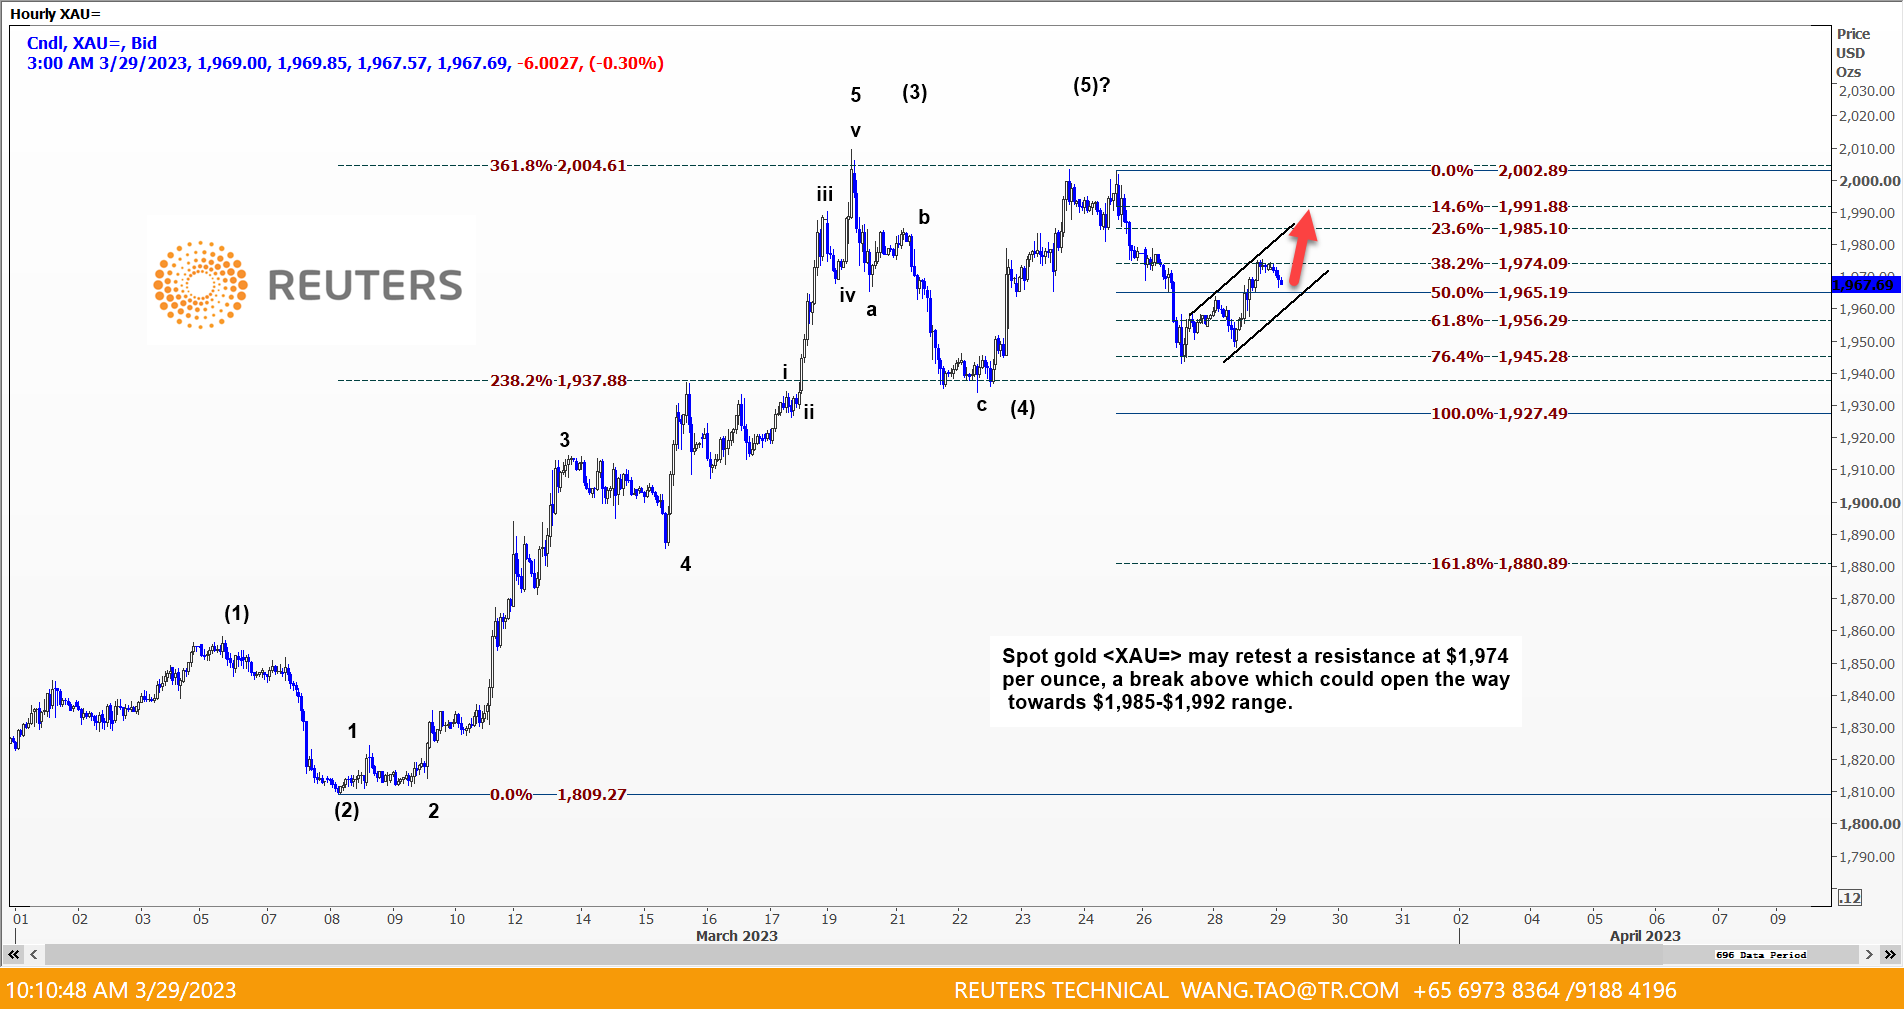
According to Reuters Technical Analysts, Wang Tao - gold is tending to re-test $1975 area. In a case of breakout it could keep going to 1985-1992$ range."It's risk-on in the equity markets where stocks are going up," said Bob Haberkorn, senior market strategist at RJO Futures. "There's been no real new news of any banking issues that we don't already know about. We're going to hover around the $2,000 (per ounce) level until we get to the next Fed meeting... The Fed is the driver in the market for precious metals," Haberkorn said.
"The marketplace is slowly moving beyond the U.S. and European banking troubles as risk appetite creeps back into the markets. However, veteran market watchers believe it's too soon for the 'all clear' siren regarding the matter," said Jim Wyckoff, senior analyst at Kitco Metals, in a note.
"Much of this rally continues to be a short covering rally," said Bart Melek, head of commodity strategies at TD Securities. "The catalyst here is the continued expectations that rates in the U.S. will top out. Anything below expectations on the core (PCE) would imply that there is less need or requirement for tight monetary policy from the Federal Reserve," Melek said.
Data showed U.S. gross domestic product rose 2.6% in the fourth quarter. The Fed's favored inflation gauge, core personal consumption expenditures (PCE), is due on Friday. Investors will be scanning the data for clues about the path of the U.S. central bank's monetary policy. According to the CME FedWatch tool, markets are pricing in a roughly 50-50 chance of the Fed maintaining rates at current levels at its May meeting.
Federal Reserve Bank of Boston leader Susan Collins said it seemed likely there would be only one more rate hike this year, while Richmond Fed President Thomas Barkin said inflation remains too high and may take longer than expected to decline.
"We expect the gold price to fall to around $1,900 per troy ounce - previously $1,800 per troy ounce - in the coming months," Commerzbank wrote in a note.
As a bottom line - gold prices were on track for a second straight quarterly rise on Friday, as growing bets that the U.S. Federal Reserve will slow the pace of interest rate hikes drew investors to the metal. The dollar index , while down for the quarter, firmed on Friday, weighing on demand for the greenback-priced gold.
"Gold jumped quickly but modestly after the market-friendly PCE (personal consumption expenditures) report," said Tai Wong, an independent metals trader based in New York. Bulls want a very strong close, ideally above $2,000, for quarter-end as a springboard to challenge the $2,070 all-time record, but the yellow metal looks a little tired."
"The mini-banking crisis has seen yields fall considerably and interest rate expectations pared significantly back, which has propelled gold higher," said Craig Erlam, senior market analyst at OANDA.
Meantime, many analysts (including us), suggest that market too aggressively re-prices Fed policy, suggesting it will become dovish. As Fathom consulting writes, The re-pricing of near-term US interest rate expectations that occurred in the week following the collapse of Silicon Valley Bank (SVB) on 10 March was as dramatic as any since the stock market crash of 1987. Can this be justified? In this simple, the 150 basis-point fall in the year-end federal funds rate implied by futures prices, from around 5.5% to around 4.0%, would suggest that investors attach around a 25% weight to a re-run of the GFC(Global Financial Crisis). For Fathom Consulting, that implied probability is too high. What if concerns about a re-run of the GFC fade over the next few weeks, and market pricing for US interest rates returns to the levels seen in early March? Then we are in a world where the US policy rate is expected to be more than 150 basis points above the Fed’s estimate of neutral for at least the next four years, even though many economists, and many investors, see a real prospect of recession. From our perspective, rates implied by federal funds futures are a little too low in the near term, but substantially too high further out.
The average European bank could withstand a loss of 38% of its deposits without having to sell at a loss government bond holdings or have a fire sale of illiquid assets, Jefferies analysts said. "Following the unravelling of several U.S. regional banks and the announced rescue merger of Credit Suisse into UBS investors have scrambled to find weak links in the system," Jefferies said in an analysis of bank liquidity.
"Most investor discussions end up at deposit flight risk and the extent to which this can be offset," it added.
Jefferies analysed the ability of banks to quickly cover deposit outflows with minimal or no losses, against the level of retail deposits, which comprise 63% of the median bank's deposit base. Retail deposits are an important source of funding stability because they are stickier than corporate deposits and pose mainly a threat in terms of cost of funding, rather than an outright danger of outflows.
Bank lending to euro zone companies slowed for the fourth straight month as an economic downturn and increased caution from lenders appear to be taking their toll, European Central Bank data showed on Monday. Lending to businesses in the 20 nation currency bloc expanded by 5.7% in February after a 6.1% rise a month earlier while household credit growth slowed to 3.2% from 3.6%.
Lending has slowed sharply in recent months on an economic downturn and the fastest rate hikes by the ECB on record, with surveys pointing to even weaker lending figures in the months ahead. The monthly flow of loans to companies was a negative 2.6 billion euros after a mere 1.4 billion euro expansion a month earlier. Growth in the M3 measure of money circulating in the euro zone meanwhile slowed to 2.9% from 3.5%, coming below expectations for 3.2% in a Reuters survey.
Could the Commercial Real Estate Market Be the Next Thing to Break?
Commercial real estate is a good candidate for breakage.The commercial real estate market is under even more pressure due to rising interest rates. As a report by Yahoo Finance noted, “Big owners of property around the country were already under pressure from the Federal Reserve’s aggressive campaign to raise interest rates, which raised borrowing costs and lowered building values.”
Commercial real estate owners also continue to deal with the fallout from government shutdowns of the economy during the COVID pandemic. Even today, a lot of commercial real estate sits empty while people work at home. But there is an even bigger problem looming on the horizon. Loans are coming due.
According to Trepp, $448 billion in commercial real estate (CRE) loans will mature in 2023. Banks hold $227 billion of those loans. Over the next five years, $2.56 trillion in commercial real estate loans will mature with $1.4 trillion held by banks. According to a real estate economist quoted by Yahoo Finance, things were already bad before the bank failures.
With rates rising and credit conditions tightening, many loans may face an uphill battle as refinancing becomes more costly, especially if banks and other lenders look to reduce their CRE exposure as we saw happen during previous recessionary cycles. This could lead to lower property values and larger losses for lenders.” There were already liquidity issues. There were fewer deals getting done. Access to capital was getting scarcer, and this banking crisis is almost certainly gonna compound that.”
According to Yahoo Finance, small to mid-size banks hold most commercial real estate mortgages. According to a report by a Goldman Sachs economist, banks with less than $250 billion in assets hold more than 80% of CRE loans. These are the banks under the most pressure due to this unfolding financial crisis.
In fact, Signature Bank was a big lender in the New York City commercial real estate market, extending loans for office towers and multi-family properties. As of the end of 2022, Signature held some $36 billion in commercial real estate loans.
We’ve already seen signs of stress in the commercial real estate market. Last month, Columbia Property Trust defaulted on $1.7 billion in floating-rate loans tied to seven buildings in New York, San Francisco, Boston, and Jersey City. Shortly thereafter, Brookfield Asset Management defaulted on $750 million-plus in debt backing two LA office towers. BlackRock Global Fixed Income CIO Rick Rieder told Yahoo Finance the problem won’t resolve itself anytime soon.
When you raise rates this quickly, the interest-sensitive parts of the economy, and particularly where there’s financing or leverage attached to it, then that’s where you create stress. That’s not going away tomorrow.”
Borrowers will likely face tightening lending standards in the days ahead. According to a Goldman Sachs note, bank lending levels had already tightened significantly over the last two quarters as recession fears ramped up. Banking system instability will lead to even more tightening of credit.
Mainstream economists and Fed officials insist that the banking system is sound. Economists quoted in the Yahoo Finance article insisted that the issues in the commercial real estate market don’t pose a systemic risk. Everything will be OK, they claim. But these same people told us the subprime problem in 2007 was contained, inflation was transitory, and quantitative easing was a temporary program that would be unwound. In other words, they don’t have the best track record.
So, what?
Given the fact that no nation in history has defeated a recession with a strong currency or rising rates, and given the fact that our current bond market is literally screaming for trillions in liquidity, there’s no alternative in the months and years ahead to prevent this real-time bond crisis from sending the world into a global depression without resorting to more magical, instant and completely artificial liquidity.
In short, expect more mouse-click trillions and more inherently inflationary (and hence currency-destroying) QE or QE-like backdoor mechanizations (i.e., repo games, bank bailouts/ins, discount window loans, cash swaps etc.).
In fact, we are all currently living under a banalization of real-time economic evil, a waste of such magnitude that it is tilting us inevitably toward a financial crisis with unavoidable human consequences and political de-volutions. First is, lost of faith into bond market. Let’s just look at the unprecedented (and so-oft predicted/warned) volatility in the UST market of recent days.
Last week, for example, liquidity in US Treasuries (and German bunds, btw) sank like a rock, with ripple effects throughout the world. On Monday, the 2-Year UST saw yields fall in single-day trading to levels not seen since 1987. By Tuesday and Wednesday, intra-day volatility levels in the UST market surpassed those of the Great Financial Crisis of 2008.
As Bloomberg’s David Ingles confirmed, last-week’s extreme volatility and yield-moves in the 2-Year UST posted 3-sigma moves, something that MIT mathematicians argue should only occur statistically once every 50+ million years.
Eventually this very same bond market, under the pressure of Powell’s Volcker-enamoured ego and rate hikes, would eventually “break,” and oh boy, has it broken. A bursting bond market would require oceans of new liquidity to prevent the UST volatility from blowing up global banking, FX, bond and risk asset markets.
This was easy to see because we respect basic math, history and common sense, three skills which policy makers around the world are doing their very best to “cancel.”
In short, the bond market is more accurate, honest and predictable than policy makers like Powell, or openly asleep-at-the-wheel leaders pushed into power (for easy and pre-planned manipulation) like Biden. Or stated even more simply: The bond market has broken because, well… all bubbles always and inevitably do the same thing: They pop.
The only way to hide and “solve” the greatest sovereign bond iceberg (crisis) in history is to bury it beneath wave after wave of mouse-clicked, debased and hence increasingly worthless fiat currencies. In short, the Fed will hide its latest credit bubble behind the last and only bubble it has left in a history-confirmed pattern used by all failed financial regimes, namely: Creating a currency crisis (i.e., debased money) to solve a debt crisis.
Of course, if you read that last line (as well as centuries of economic history) correctly, this just means there are no solutions left, just a choice of crisis options: drowning bonds or drowning currencies.
The hawks, it seems, somehow believe that they can raise rates (to as high as 7%) to kill mis-reported inflation (as high as 16%) [???] without killing the credit market.
At the same time, however, Powell needs inflation to outpace interest rates to achieve a deep enough slope of negative real rates to inflate away the USA’s $31T public debt. Like Captain Smith on the Titanic, Powell is trying hard to stay calm but knows the end game.
Powell will ultimately be forced to kill the currency to allegedly save the credit markets—thus once again squeezing one bubble (in credit) into another bubble (currency), which is what all the central bankers have been doing for years: Pushing one bubble into the next until the final one pops. This eventually means letting the USD expand in supply and hence sink in value.
As per the bars at the far right of the graph below, for the 1st time in 60years, we saw a UST market (blue bar) fell faster and further than a top-20 stock market drawdown (grey bar).
Bonds are falling in price because demand is falling in fact. This bond drop is not because of inflation, but because no one trusts the debtor—i.e., Uncle Sam. Unlike the 70’s, US debt to GDP today is at 125+%, and thus American IOUs today just aren’t what they were yesterday. This collective lack of faith in USTs and USDs is why global central banks are swapping out USTs and buying physical gold…
Conclusion:
Analysis of last week events tells few important moments. First is - market overvalues Fed's dovish sentiment. In fact, BlackRock and other analysts told about it earlier, and we've explained why. Second - the most probable way of Fed action for now is printing & hiking. But as printing as hiking should be done selectively. Hiking is with small steps, say 25 points on every meeting. While printing is on the occasion, when something else will break. This could let the Fed to expand timing and keep the face of "fight with inflation". But the end will inevitably bad. Inflation will not decrease, and, probably somewhere in May-June we should see another upside spiral. Negative interest rates will stay for long which trigger drop in demand from foreign investors. Worsen USD global position could lead to sporadic moments of devaluation if global economic situation keep going in the same trend and same pace. Within a year we get first fruits of massive dollar denying in global transfers.
For the US it will become more difficult to export inflation outside. If earlier, dollar drop makes goods and commodities more expensive across the globe and countries were had to get more dollars to pay for them, devaluing own national currencies - now situation could start to change and higher prices will be only in USD. Besides, so toxic combination of national debt ceil, record budget deficit and outstanding negative trading balance with big drop in demand to national debt gives very limited space to the Fed maneuver. Personally I do not see any solutions except printing and grabbing all possible cash out of stock and crypto markets by keeping high interest rates for some time. All these moment create can of worms and big uncertainty. And it seems that gold definitely become handy in this muddy water.