Sive Morten
Special Consultant to the FPA
- Messages
- 18,762
Fundamentals
This week gold behaves well, and follows to our signals very accurately. We still think that Basel III rules for banking sector should play major role in financial world very soon but its impact is yet to be understand. We talk not about commercial bank, we talk about global banking system, including IMF, countries' finance and role of gold. Impact on global economy will develop slowly but stubbornly. In two words speaking, gold again becomes global money equivalent but not a commodity. This happens first time since Bretton Woods agreement, when US dollar become a global money. And it means that absolute value again will be based on gold, it becomes the starting point of value of all other assets, including currencies. This is difficult to describe in small post and this topic needs additional research. Countries with gold reserves, could increase Money supply twice to gold amount that they have without significant inflation pressure and boost domestic economy.
This big shift happened almost invisibly, giving very shy announcement in media. But we need to keep it in mind and be careful to processes that we will see this year on gold market. As we think that gold stands at first stage of new global upside trend - Basel III could become the cornerstone and the background of all political process that we will see. It means that gold stop to be driven by financial conditions of particular country - US, for example, as it stands right now, but it will go on new level and will be driven by absolutely different factors such as global trade growth, global inflation, world GDP etc. Now US Dollar is absolute equivalent of value and everything is valued in relation to US Dollar. By Basel III dollar will lose this feature and become the currency among the others. This process demands global mind shift and comes gradually. By now we just wait when retracement will be completed and gold turn to next leg of new trend.
Meantime, gold eased on Friday as Wall Street gained on data pointing to a rebound in jobs growth in the United States, but bullion’s losses were limited by a simultaneous slowdown in wage growth.
U.S. employment growth accelerated from a 17-month low in March as milder weather boosted activity in sectors like construction, which could further allay fears of a sharp slowdown in economic growth in the first quarter, driving early gains on Wall Street.
“It’s quite a good number... and basically means the U.S. economy is doing fairly well and the growth will accelerate after a slowdown in the first quarter,” SP Angel analyst Sergey Raevskiy said.
“It’s all good for the economy and equities, but not for gold.”
However, bullion pared some of its losses as investors also took stock of other details from the report, which showed slower wage increases in March and worsening worker shortages.
“The decent jobs report was enough to rally the U.S. stock market to multi-month highs, but not strong enough to change trader ideas that the Federal Reserve will continue to be patient on any U.S. interest rate increases,” Jim Wyckoff, senior analyst at Kitco Metals, wrote in a note.
Also weighing on bullion was improved risk sentiment driven by optimism surrounding a U.S.-China trade deal, which kept the dollar supported.
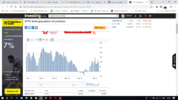
CFTC data shows drop of net long speculative position for ~20K contracts. This supports our idea of two leg retracement and another gold drop to 1260 area. SPDR fund reserves also has dropped from 784.26 tonnes at 29th of March to 761.67 tonnes on 5th of April, which is normal tendency on significant retracement. We also should not forget about seasonal trend on gold which becomes bearish and lasts till the end of summer.

Source: cftc.gov
Charting by Investing.com
Yesterday, in our FX report we've discussed Brexit saga and what to expect on coming week. Another widely announced topic is China US negotiations. But also it has relation to the Basel III topic and global reserve currency. Take a look what advantage US dollar has now - here is new Fathom consulting research on this topic.We bring few interesting extractions here:
One obvious area where China lags relative to the size of its economy is in currency markets. The renminbi’s share of global foreign reserves is less than 2%. That compares to a figure of almost 60% for the US dollar, and around 20% for the euro. The dollar’s status as the world’s reserve currency does not appear to be under material threat from China. Indeed, the US dollar only replaced sterling as the principal reserve currency some fifty years after the US became the world’s largest economy.

Being the world’s reserve currency confers significant benefits on the sovereign that owns the printing rights over that currency. The rest of the world has to hold assets denominated in that currency in large quantities, irrespective of the yield on those assets. Consequently, the average return achieved by the rest of the world on its assets held in dollars is far lower than the average return US citizens achieve on their holdings of non-dollar denominated assets. The difference in yield runs to 3–4% per annum. That yield differential can be thought of as a gift, from the rest of the world to the US, worth around 4% of US GDP per year every year. The name for that flow of money is seigniorage — specifically the seigniorage that flows to the printer of reserve currency.

Technical
Monthly
As gold market hit major target on weekly chart, it fluctuates inside major swings and mostly is driven by shorter-term factors. It makes minor impact on monthly picture and our long-term view. Recent fundamental and sentiment analysis shows that no big changes have happened and gold still stands positive. Despite technical retracement, we do not have reasons yet to cancel our long-term positive view on gold.
As we've said earlier, we're watching for our so called "symmetrical" model. It could be clear symmetry in market action, and we have suggested that future action could be a reflection of previous downside action shape.Now market has moved more above the trend line, which was a crucial level for long-term technical picture.
Gold shows good performance in December- February, which could put the foundation of new long-term upside trend. We still keep our harmonic technical model on monthly chart as primary tool of analysis. Current retracement down looks strong on daily chart, but it is just 30% of major swing up which is minimal level.
Fundamental reasons for gold rising mostly relate to changing of global political and economical situation. Strong global shifts never could happen without big political events. This should provide big support to gold market. Now it is widely suggested that these processes should accelerate closer to 2020 year, or even in second half of 2019. For example, here is report by Fathom Consulting and their expectations to see world crisis around 2020.
Here is explanation of our "symmetrical" model and scenario. Recent action on gold market reminds reverse H&S shape but very choppy and extended in time. Important COP target has been hit and upside action has started. In fact we have mirror action to the right and to the left from COP point. Market forms approximately equal lows on both sides. The speed is also similar. Is it possible that reversal is forming? Why not.
On monthly chart we keep watching whether gold will be able to hold above trend line. Now price stands above YPP as well, but it has not been tested yet by price. As meaningful retracement stands under way - YPP should work as nearest destination point.
Among bullish signs we could mention MACD hidden divergence which suggests action above 1380 top in long-term perspective.

Weekly
As bullish B&B "Buy" was done, here we have just one pattern that we're trading right now - "222" Sell. Its minimal target stands at 1275 level that has not been reached yet.
Last week we've got another important pattern on weekly chart - reversal candle. It shows new top compares to previous one and close below the lows of previous week. In fact, it engulfs almost the whole month of action.
Reversal weeks have the feature of continuation. Usually, once it was formed, market usually shows continuation down. In general, this corresponds to our minimal 1275 target and gives the answer on question - is it time to go long already or not. First week of April has shy trading range and makes no impact on weekly chart. So, our weekly trading plan stands the same.

Daily
On daily chart the major pattern also stands the same. Recent lows of 1280 are major signal level for coming week. Once gold breaks them down, this will be the signals that we're going down, to next target. You should remember that now market stands at COP target of the same AB-CD pattern and now we watch just for technical respect of this level, but it doesn't mean that downside action is over already.

Intraday
The trading range of last week was so tight that intraday charts again are most valuable for us, because we do see anything important on higher time frames by far.
So here is our trading plan for coming week. Invalidation point is 1280 lows, as we've said above. Bullish signals we've mentioned on Friday and they are still the same - engulfing pattern, 2-bars bullish grabber and W&R. Friday action was mixed but it doesn't make any significant impact on situation. Volatility has formed bullish grabber as well.
To the upside we have two extensions OP at 1297 and XOP around 1306. Both of them coincides with strong K-areas and create Agreements. Which one to choose depends on upside pace. Gradual, slow action suggests 1297 target and in general it is more probable as we have reaction on COP target. We could turn to XOP around 1305 if we get fast upside rally.
No shorts by far, at least until 1280 holds and upside target are not reached.

Conclusion:
Globally, Gold market and whole financial system stands at the threshold of big changes, which happens once per 100-200 years or even more seldom. Changes start slow but effect will grow as time will passing by.
Meantime, abstracting from high hopes, we follow short-term trading plan, that suggests upside retracement on coming week with two potential targets - 1297 and 1305
The technical portion of Sive's analysis owes a great deal to Joe DiNapoli's methods, and uses a number of Joe's proprietary indicators. Please note that Sive's analysis is his own view of the market and is not endorsed by Joe DiNapoli or any related companies.
This week gold behaves well, and follows to our signals very accurately. We still think that Basel III rules for banking sector should play major role in financial world very soon but its impact is yet to be understand. We talk not about commercial bank, we talk about global banking system, including IMF, countries' finance and role of gold. Impact on global economy will develop slowly but stubbornly. In two words speaking, gold again becomes global money equivalent but not a commodity. This happens first time since Bretton Woods agreement, when US dollar become a global money. And it means that absolute value again will be based on gold, it becomes the starting point of value of all other assets, including currencies. This is difficult to describe in small post and this topic needs additional research. Countries with gold reserves, could increase Money supply twice to gold amount that they have without significant inflation pressure and boost domestic economy.
This big shift happened almost invisibly, giving very shy announcement in media. But we need to keep it in mind and be careful to processes that we will see this year on gold market. As we think that gold stands at first stage of new global upside trend - Basel III could become the cornerstone and the background of all political process that we will see. It means that gold stop to be driven by financial conditions of particular country - US, for example, as it stands right now, but it will go on new level and will be driven by absolutely different factors such as global trade growth, global inflation, world GDP etc. Now US Dollar is absolute equivalent of value and everything is valued in relation to US Dollar. By Basel III dollar will lose this feature and become the currency among the others. This process demands global mind shift and comes gradually. By now we just wait when retracement will be completed and gold turn to next leg of new trend.
Meantime, gold eased on Friday as Wall Street gained on data pointing to a rebound in jobs growth in the United States, but bullion’s losses were limited by a simultaneous slowdown in wage growth.
U.S. employment growth accelerated from a 17-month low in March as milder weather boosted activity in sectors like construction, which could further allay fears of a sharp slowdown in economic growth in the first quarter, driving early gains on Wall Street.
“It’s quite a good number... and basically means the U.S. economy is doing fairly well and the growth will accelerate after a slowdown in the first quarter,” SP Angel analyst Sergey Raevskiy said.
“It’s all good for the economy and equities, but not for gold.”
However, bullion pared some of its losses as investors also took stock of other details from the report, which showed slower wage increases in March and worsening worker shortages.
“The decent jobs report was enough to rally the U.S. stock market to multi-month highs, but not strong enough to change trader ideas that the Federal Reserve will continue to be patient on any U.S. interest rate increases,” Jim Wyckoff, senior analyst at Kitco Metals, wrote in a note.
Also weighing on bullion was improved risk sentiment driven by optimism surrounding a U.S.-China trade deal, which kept the dollar supported.
CFTC data shows drop of net long speculative position for ~20K contracts. This supports our idea of two leg retracement and another gold drop to 1260 area. SPDR fund reserves also has dropped from 784.26 tonnes at 29th of March to 761.67 tonnes on 5th of April, which is normal tendency on significant retracement. We also should not forget about seasonal trend on gold which becomes bearish and lasts till the end of summer.
Source: cftc.gov
Charting by Investing.com
Yesterday, in our FX report we've discussed Brexit saga and what to expect on coming week. Another widely announced topic is China US negotiations. But also it has relation to the Basel III topic and global reserve currency. Take a look what advantage US dollar has now - here is new Fathom consulting research on this topic.We bring few interesting extractions here:
One obvious area where China lags relative to the size of its economy is in currency markets. The renminbi’s share of global foreign reserves is less than 2%. That compares to a figure of almost 60% for the US dollar, and around 20% for the euro. The dollar’s status as the world’s reserve currency does not appear to be under material threat from China. Indeed, the US dollar only replaced sterling as the principal reserve currency some fifty years after the US became the world’s largest economy.
Being the world’s reserve currency confers significant benefits on the sovereign that owns the printing rights over that currency. The rest of the world has to hold assets denominated in that currency in large quantities, irrespective of the yield on those assets. Consequently, the average return achieved by the rest of the world on its assets held in dollars is far lower than the average return US citizens achieve on their holdings of non-dollar denominated assets. The difference in yield runs to 3–4% per annum. That yield differential can be thought of as a gift, from the rest of the world to the US, worth around 4% of US GDP per year every year. The name for that flow of money is seigniorage — specifically the seigniorage that flows to the printer of reserve currency.
Technical
Monthly
As gold market hit major target on weekly chart, it fluctuates inside major swings and mostly is driven by shorter-term factors. It makes minor impact on monthly picture and our long-term view. Recent fundamental and sentiment analysis shows that no big changes have happened and gold still stands positive. Despite technical retracement, we do not have reasons yet to cancel our long-term positive view on gold.
As we've said earlier, we're watching for our so called "symmetrical" model. It could be clear symmetry in market action, and we have suggested that future action could be a reflection of previous downside action shape.Now market has moved more above the trend line, which was a crucial level for long-term technical picture.
Gold shows good performance in December- February, which could put the foundation of new long-term upside trend. We still keep our harmonic technical model on monthly chart as primary tool of analysis. Current retracement down looks strong on daily chart, but it is just 30% of major swing up which is minimal level.
Fundamental reasons for gold rising mostly relate to changing of global political and economical situation. Strong global shifts never could happen without big political events. This should provide big support to gold market. Now it is widely suggested that these processes should accelerate closer to 2020 year, or even in second half of 2019. For example, here is report by Fathom Consulting and their expectations to see world crisis around 2020.
Here is explanation of our "symmetrical" model and scenario. Recent action on gold market reminds reverse H&S shape but very choppy and extended in time. Important COP target has been hit and upside action has started. In fact we have mirror action to the right and to the left from COP point. Market forms approximately equal lows on both sides. The speed is also similar. Is it possible that reversal is forming? Why not.
On monthly chart we keep watching whether gold will be able to hold above trend line. Now price stands above YPP as well, but it has not been tested yet by price. As meaningful retracement stands under way - YPP should work as nearest destination point.
Among bullish signs we could mention MACD hidden divergence which suggests action above 1380 top in long-term perspective.
Weekly
As bullish B&B "Buy" was done, here we have just one pattern that we're trading right now - "222" Sell. Its minimal target stands at 1275 level that has not been reached yet.
Last week we've got another important pattern on weekly chart - reversal candle. It shows new top compares to previous one and close below the lows of previous week. In fact, it engulfs almost the whole month of action.
Reversal weeks have the feature of continuation. Usually, once it was formed, market usually shows continuation down. In general, this corresponds to our minimal 1275 target and gives the answer on question - is it time to go long already or not. First week of April has shy trading range and makes no impact on weekly chart. So, our weekly trading plan stands the same.
Daily
On daily chart the major pattern also stands the same. Recent lows of 1280 are major signal level for coming week. Once gold breaks them down, this will be the signals that we're going down, to next target. You should remember that now market stands at COP target of the same AB-CD pattern and now we watch just for technical respect of this level, but it doesn't mean that downside action is over already.
Intraday
The trading range of last week was so tight that intraday charts again are most valuable for us, because we do see anything important on higher time frames by far.
So here is our trading plan for coming week. Invalidation point is 1280 lows, as we've said above. Bullish signals we've mentioned on Friday and they are still the same - engulfing pattern, 2-bars bullish grabber and W&R. Friday action was mixed but it doesn't make any significant impact on situation. Volatility has formed bullish grabber as well.
To the upside we have two extensions OP at 1297 and XOP around 1306. Both of them coincides with strong K-areas and create Agreements. Which one to choose depends on upside pace. Gradual, slow action suggests 1297 target and in general it is more probable as we have reaction on COP target. We could turn to XOP around 1305 if we get fast upside rally.
No shorts by far, at least until 1280 holds and upside target are not reached.
Conclusion:
Globally, Gold market and whole financial system stands at the threshold of big changes, which happens once per 100-200 years or even more seldom. Changes start slow but effect will grow as time will passing by.
Meantime, abstracting from high hopes, we follow short-term trading plan, that suggests upside retracement on coming week with two potential targets - 1297 and 1305
The technical portion of Sive's analysis owes a great deal to Joe DiNapoli's methods, and uses a number of Joe's proprietary indicators. Please note that Sive's analysis is his own view of the market and is not endorsed by Joe DiNapoli or any related companies.