Sive Morten
Special Consultant to the FPA
- Messages
- 18,732
Fundamentals
(Reuters) - Gold hit a five-month high on Friday after U.S. jobs data dampened expectations that the U.S. Federal Reserve will raise interest rates, but the metal gave up most gains as the dollar rose and safe haven
demand ebbed.
U.S. employers added the fewest number of workers in 10 months in March, boosting gold, which is most attractive to investors in a low interest rate environment.
Spot gold rose 0.2 percent to $1,253.71 an ounce by 2:44 p.m. EDT (1844 GMT )after touching its highest since Nov. 10 at $1,270.46, putting it on track for a fourth consecutive week of gains. U.S. gold futures climbed 0.3 percent to settle at $1,257.30 an ounce.
Gold was also underpinned by investors looking for safety after the United States fired cruise missiles at a Syrian air base, escalating tensions with Russia and Iran. Later in the session, however, safe haven demand faded and the dollar index climbed to three-week highs.
"Unless you can make a case that the geopolitical risk continues to escalate, I'm struggling with this positive
sentiment in the gold market," said Rob Haworth, senior investment strategist for U.S. Bank Wealth Management in Seattle.
"The one factor that's in favor for gold is that you had pretty negative sentiment coming into the year, so there is room for speculators to increase their bullish positions."
Investors were cautious ahead of the meeting between U.S. President Donald Trump and Chinese President Xi Jinping, but Trump said on Friday he had made progress in talks and expected them to overcome many problems.
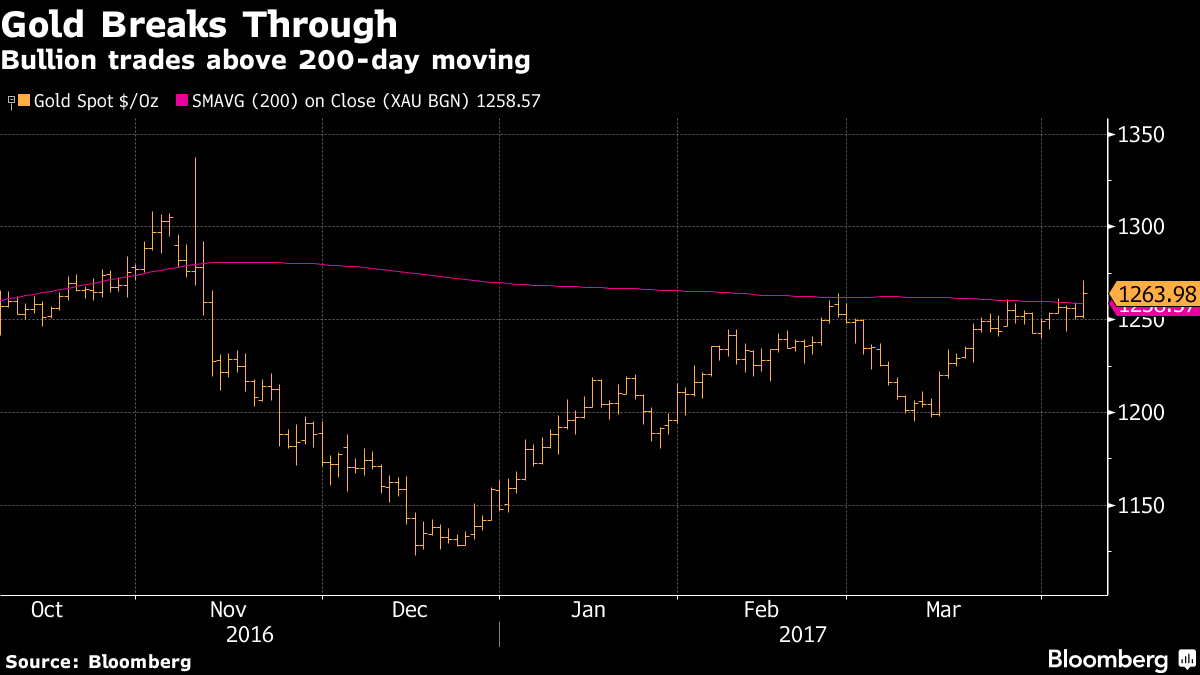
From a technical perspective, Gold has struggled to break above its 200-day moving average in previous sessions but broke out above that key technical level intraday and has tested its upper resistance at $1,264, the Feb. 28 high. MKS PAMP analyst Tim Brown said if gold consolidated above $1,260 it could be a catalyst for a push higher.
Russia, a staunch ally of Syria, said relations between Washington and Moscow had been seriously damaged by the strike, which was in retaliation for a deadly chemical attack on a rebel-held area of Syria.
Gold is often used as a hedge against political and financial uncertainty and security risks. It has benefited
alongside other assets considered safe, such as the yen and U.S. Treasury bonds.
Analysts say this support is also unlikely to be sustained as the market shifts its attention back to the elections in France and monetary policy.
"We still feel that increases in U.S. interest rates will prove too much of a headwind for gold prices. As such, we think that the price of gold is likely to fall from about $1,265 today to $1,050 by the end of the year," Capital Economics analysts said in a note.
COT Report
CFTC data shows moderately bullish picture. During last 4 weeks open interest supports rally, in general as it has shown shy growth together with prices and net long position. Last week we mostly see short covering as price jump was accompanied by contraction of open interest. It could happen even technically as market has vanished previous tops and grabbed stops above it. Now the major question is wether gold will be able to hold above broken level.

Technicals
Monthly
As gold shows no return back to 1100 lows - it keeps reversal moment of our H&S pattern pretty nice by far. We've talked a lot about large patterns and far perspectives on gold market.
At this moment overall fundamental background looks supportive for gold market. Right now we see few factors that could support upside action in medium-term period.
First one is Fed policy. Fed will not hurry with rate increase and will not stifle US economy by too early agressive policy. They will support inflationary growth for some time and let economy to become hot a bit. Thus, major impact of Fed policy should come in 2018. This will let gold to ride on inflation for some time in 2017.
Second - multiple elections in EU brings a lot of uncertainty and works as supportive factor for gold market. Last 2-3 decades EU was totally depended on US policy and external governing of international policy. EU did the same as US and supports all start-ups that was needed to US, in any point of the Globe, although this was not neccesary to EU countries... Now sitation is changing.
Finally, recent inability of D. Trump to push through Congress rolling back process on Obamacare program also was a negative impact on USD. Now Investors have doubts - whether he will push through tax reforms and stimulus program. Yesterday we've placed nice research by Fathom consulting on this sub (look inside EUR thread). They clarify that everything goes as it should, but result of this we should see in 4Q 2017. It means that gold still has ~6 month of free action. Besides, geopolitical tensions also should be backwind for gold as it was on Friday.
These factors could support gold market in medium-term period. Technical picture and sentiment analysis right now also mostly look bullish, but not excludes risk factors totally.
Technically price behavior, short-term sentiment and commodities performance mostly supports idea of bullish reversal pattern here (at least now). At the same time many world top analysts (such as Barnabas Gan) worry about more active Fed policy and think that gold could finish 2017 around 1100$.
Still we have new input here - neutral comments on further rate hike. As Fathom consulting suggests - Fed will lead economy to become hot a bit before aggresive rate policy. This should open door for inflation growth, which is supportive factor for gold. Currently gold could stay on its own till June and this could encourage investors to be more brave in taking long positions.
Concerning farer perspective we could make just some suggestions. As we've said technically recent upward action started in Dec 2015 is first one after long term of decreasing and it should be interrupted by deep retracement sometime. Now this retracement stands in place. It is really big chance that gold stands in a stage of big trend changing from bearish into bullish. US economy shows inflation growing. As we've estimated, commodities across the board have turned to growth.
Besides, any Trump protection policy will be accompanied by big spending and expenses, this will lead to grow of inflationary expectations. Thus, we mostly gravitate to idea that gold now stands not in pause of bear trend, but on the eve of new bull trend. Also we expect big structural shifts in EU economy, diminishing Brussels governing role, taking direction on convergence with Russian economy, and through Russia economical infrastructure - with Middle East and Asia.
This is long political talk though, but shortly speaking, we see that the process of building new EU has started. First bell is Brexit. As you know all mature EU countries has started gold repatriation process that should be finished in 2020. So we should be oriented on this year as appearing of the shape of new EU. By gold repatriation process we could gudge on major idea of new EU - each country will out of external governing either Brussel or US and will make it's own policy according with their own national interests. This is how it should be in theory. How this process will develop on practice - we will see.
As you can see we have a lot of driving factors and all of them have significant value. It means that despite direction - either upside (as we think) or downside to 1100 (that is contrary opinion) - action will be very volatile.
But our technical "deep" retracement still could be different. Currently, as market stands at the edge of 1170 Fib support, we could talk on H&S pattern. Besides the shape itself, some features here that in general typical for H&S. For example, relation between head and shoulders - 1.618. Butterfly... very often first part of H&S takes the shape of butterfly pattern...
At this moment we do not have questions and serious doubts on perspective of H&S pattern. Market shows normal behavior for its shape. Also we have nice bullish divergence with MACD that is also typical for reversal patterns. On monthly chart we could specify two relatively close targets. First is YPR1 around 1330, next one is neckline - around 1380 area. The only negative factor that could appear in April is bearish grabber. As you can see April month has tested already MACDP line and since it is not closed yet - we haven't got confirmed pattern. That's why above we said it will major importancy wether price will be able to hold above broken top on daily chart:

Weekly
Although our short-term targets have been completed recently, but market in general has not broken through natural support/resistance area on weekly chart. Actually, appearing of shooting star pattern here brings bearish short-term perspectives.
Here trend stands bullish and market is not at OB/OS. As market was not able to break 1270 area it probably could trigger 1-2 weeks of downward action. May be it will not break overall bullish picture, but could push gold back to 1215-1230 area again...

Daily
Here we have two different issues. From one point of view upside breakout, that we've discussed, has happened - so or short-term scenario has been completed. At the same time this is a bit different result of breakout, compares to what we've expected. Right now it mostly looks like wash&rinse of previous tops when stops were cleared and market returned right back.
Here we put popular 200-day MA, that is mentioned very often recently. In reality it seems that gold has not broken it. Trend has turned bearish here. That's being said, odds mostly suggests some pullback here as gold mostly has failed to break major resistance. There is no menace yet to overall bullish context, but gold could show downward retracement. Most probable destination seems right now around 1215 K-support:

4-hour
Intraday chart also mostly shows short-term bearish setup. As soon as price has completed our "morning star" target - gold has dropped back inside sideways consolidation. This action could be treated as failure breakout. It means that market should make an attempt of opposite breakout. It's target will be around 1220...

Conclusion:
In long-term perspective we think that bullish factors overhelm headwind of possible rate hike by Fed. Still this probably will lead to turmoil and excessive volatility, but we hope that this will happen with upside direction.
In shorter-term perspective gold shows inability to break through 1260 level for awhile. Thus, within 1-2 weeks we could see downward retracement back to 1215 area, at least if no new missile launches will happen.
The technical portion of Sive's analysis owes a great deal to Joe DiNapoli's methods, and uses a number of Joe's proprietary indicators. Please note that Sive's analysis is his own view of the market and is not endorsed by Joe DiNapoli or any related companies.
(Reuters) - Gold hit a five-month high on Friday after U.S. jobs data dampened expectations that the U.S. Federal Reserve will raise interest rates, but the metal gave up most gains as the dollar rose and safe haven
demand ebbed.
U.S. employers added the fewest number of workers in 10 months in March, boosting gold, which is most attractive to investors in a low interest rate environment.
Spot gold rose 0.2 percent to $1,253.71 an ounce by 2:44 p.m. EDT (1844 GMT )after touching its highest since Nov. 10 at $1,270.46, putting it on track for a fourth consecutive week of gains. U.S. gold futures climbed 0.3 percent to settle at $1,257.30 an ounce.
Gold was also underpinned by investors looking for safety after the United States fired cruise missiles at a Syrian air base, escalating tensions with Russia and Iran. Later in the session, however, safe haven demand faded and the dollar index climbed to three-week highs.
"Unless you can make a case that the geopolitical risk continues to escalate, I'm struggling with this positive
sentiment in the gold market," said Rob Haworth, senior investment strategist for U.S. Bank Wealth Management in Seattle.
"The one factor that's in favor for gold is that you had pretty negative sentiment coming into the year, so there is room for speculators to increase their bullish positions."
Investors were cautious ahead of the meeting between U.S. President Donald Trump and Chinese President Xi Jinping, but Trump said on Friday he had made progress in talks and expected them to overcome many problems.
From a technical perspective, Gold has struggled to break above its 200-day moving average in previous sessions but broke out above that key technical level intraday and has tested its upper resistance at $1,264, the Feb. 28 high. MKS PAMP analyst Tim Brown said if gold consolidated above $1,260 it could be a catalyst for a push higher.
Russia, a staunch ally of Syria, said relations between Washington and Moscow had been seriously damaged by the strike, which was in retaliation for a deadly chemical attack on a rebel-held area of Syria.
Gold is often used as a hedge against political and financial uncertainty and security risks. It has benefited
alongside other assets considered safe, such as the yen and U.S. Treasury bonds.
Analysts say this support is also unlikely to be sustained as the market shifts its attention back to the elections in France and monetary policy.
"We still feel that increases in U.S. interest rates will prove too much of a headwind for gold prices. As such, we think that the price of gold is likely to fall from about $1,265 today to $1,050 by the end of the year," Capital Economics analysts said in a note.
COT Report
CFTC data shows moderately bullish picture. During last 4 weeks open interest supports rally, in general as it has shown shy growth together with prices and net long position. Last week we mostly see short covering as price jump was accompanied by contraction of open interest. It could happen even technically as market has vanished previous tops and grabbed stops above it. Now the major question is wether gold will be able to hold above broken level.
Technicals
Monthly
As gold shows no return back to 1100 lows - it keeps reversal moment of our H&S pattern pretty nice by far. We've talked a lot about large patterns and far perspectives on gold market.
At this moment overall fundamental background looks supportive for gold market. Right now we see few factors that could support upside action in medium-term period.
First one is Fed policy. Fed will not hurry with rate increase and will not stifle US economy by too early agressive policy. They will support inflationary growth for some time and let economy to become hot a bit. Thus, major impact of Fed policy should come in 2018. This will let gold to ride on inflation for some time in 2017.
Second - multiple elections in EU brings a lot of uncertainty and works as supportive factor for gold market. Last 2-3 decades EU was totally depended on US policy and external governing of international policy. EU did the same as US and supports all start-ups that was needed to US, in any point of the Globe, although this was not neccesary to EU countries... Now sitation is changing.
Finally, recent inability of D. Trump to push through Congress rolling back process on Obamacare program also was a negative impact on USD. Now Investors have doubts - whether he will push through tax reforms and stimulus program. Yesterday we've placed nice research by Fathom consulting on this sub (look inside EUR thread). They clarify that everything goes as it should, but result of this we should see in 4Q 2017. It means that gold still has ~6 month of free action. Besides, geopolitical tensions also should be backwind for gold as it was on Friday.
These factors could support gold market in medium-term period. Technical picture and sentiment analysis right now also mostly look bullish, but not excludes risk factors totally.
Technically price behavior, short-term sentiment and commodities performance mostly supports idea of bullish reversal pattern here (at least now). At the same time many world top analysts (such as Barnabas Gan) worry about more active Fed policy and think that gold could finish 2017 around 1100$.
Still we have new input here - neutral comments on further rate hike. As Fathom consulting suggests - Fed will lead economy to become hot a bit before aggresive rate policy. This should open door for inflation growth, which is supportive factor for gold. Currently gold could stay on its own till June and this could encourage investors to be more brave in taking long positions.
Concerning farer perspective we could make just some suggestions. As we've said technically recent upward action started in Dec 2015 is first one after long term of decreasing and it should be interrupted by deep retracement sometime. Now this retracement stands in place. It is really big chance that gold stands in a stage of big trend changing from bearish into bullish. US economy shows inflation growing. As we've estimated, commodities across the board have turned to growth.
Besides, any Trump protection policy will be accompanied by big spending and expenses, this will lead to grow of inflationary expectations. Thus, we mostly gravitate to idea that gold now stands not in pause of bear trend, but on the eve of new bull trend. Also we expect big structural shifts in EU economy, diminishing Brussels governing role, taking direction on convergence with Russian economy, and through Russia economical infrastructure - with Middle East and Asia.
This is long political talk though, but shortly speaking, we see that the process of building new EU has started. First bell is Brexit. As you know all mature EU countries has started gold repatriation process that should be finished in 2020. So we should be oriented on this year as appearing of the shape of new EU. By gold repatriation process we could gudge on major idea of new EU - each country will out of external governing either Brussel or US and will make it's own policy according with their own national interests. This is how it should be in theory. How this process will develop on practice - we will see.
As you can see we have a lot of driving factors and all of them have significant value. It means that despite direction - either upside (as we think) or downside to 1100 (that is contrary opinion) - action will be very volatile.
But our technical "deep" retracement still could be different. Currently, as market stands at the edge of 1170 Fib support, we could talk on H&S pattern. Besides the shape itself, some features here that in general typical for H&S. For example, relation between head and shoulders - 1.618. Butterfly... very often first part of H&S takes the shape of butterfly pattern...
At this moment we do not have questions and serious doubts on perspective of H&S pattern. Market shows normal behavior for its shape. Also we have nice bullish divergence with MACD that is also typical for reversal patterns. On monthly chart we could specify two relatively close targets. First is YPR1 around 1330, next one is neckline - around 1380 area. The only negative factor that could appear in April is bearish grabber. As you can see April month has tested already MACDP line and since it is not closed yet - we haven't got confirmed pattern. That's why above we said it will major importancy wether price will be able to hold above broken top on daily chart:
Weekly
Although our short-term targets have been completed recently, but market in general has not broken through natural support/resistance area on weekly chart. Actually, appearing of shooting star pattern here brings bearish short-term perspectives.
Here trend stands bullish and market is not at OB/OS. As market was not able to break 1270 area it probably could trigger 1-2 weeks of downward action. May be it will not break overall bullish picture, but could push gold back to 1215-1230 area again...
Daily
Here we have two different issues. From one point of view upside breakout, that we've discussed, has happened - so or short-term scenario has been completed. At the same time this is a bit different result of breakout, compares to what we've expected. Right now it mostly looks like wash&rinse of previous tops when stops were cleared and market returned right back.
Here we put popular 200-day MA, that is mentioned very often recently. In reality it seems that gold has not broken it. Trend has turned bearish here. That's being said, odds mostly suggests some pullback here as gold mostly has failed to break major resistance. There is no menace yet to overall bullish context, but gold could show downward retracement. Most probable destination seems right now around 1215 K-support:
4-hour
Intraday chart also mostly shows short-term bearish setup. As soon as price has completed our "morning star" target - gold has dropped back inside sideways consolidation. This action could be treated as failure breakout. It means that market should make an attempt of opposite breakout. It's target will be around 1220...
Conclusion:
In long-term perspective we think that bullish factors overhelm headwind of possible rate hike by Fed. Still this probably will lead to turmoil and excessive volatility, but we hope that this will happen with upside direction.
In shorter-term perspective gold shows inability to break through 1260 level for awhile. Thus, within 1-2 weeks we could see downward retracement back to 1215 area, at least if no new missile launches will happen.
The technical portion of Sive's analysis owes a great deal to Joe DiNapoli's methods, and uses a number of Joe's proprietary indicators. Please note that Sive's analysis is his own view of the market and is not endorsed by Joe DiNapoli or any related companies.