Sive Morten
Special Consultant to the FPA
- Messages
- 18,675
Fundamentals
The major action of this week was Thursday's drop on gold market. Despite that gold has dropped a bit later, compares to our expectation but it was not a surprise for us.
Gold prices fell below the key $1,300 level on Thursday as a firm dollar and improved risk appetite on the back of a rise in European airline stocks pulled investors away from bullion.
Gold is being pressured by “the recovery in the risk appetite, some optimism on the trade front and a firm U.S dollar”, said Ryan McKay, commodity strategist at TD Securities.
European shares advanced on Thursday, helped by a rise in airline stocks, after European Union leaders gave Britain another six months to leave the bloc.
Dovish views from major central banks on Wednesday failed to help gold. Lower interest rates reduce the opportunity cost of holding non-yielding bullion.
“Dovish central banks have been baked into the cake right now. Gold markets have known of this for a couple of months,” McKay said.
The U.S. Federal Reserve’s minutes restated its view on the risks of a global economic slowdown, while the European Central Bank kept its ultra-easy monetary policy unchanged.
“In the near term, I am a little bit bearish on gold. I think a break below $1,280 an ounce could trigger a potential move towards $1,260-$1,240,” OANDA senior market analyst Craig Erlam said.
The United States and China have largely agreed on a mechanism to police any trade agreement they reach, including establishing new “enforcement offices”, U.S. Treasury Secretary Steven Mnuchin said on Wednesday.
Gold inched lower on Friday, having posted its biggest daily decline in two weeks in the previous session, as the impact of a weak dollar was offset by gains on Wall Street.
“The dollar strength really hurt precious metals and we’re seeing some of that reverse with most currencies running a little higher versus the dollar,” said Chris Gaffney, president of world markets at TIAA Bank.
“We’ve got tame inflation, the trade situation is getting resolved and Brexit looks like it’s going to be pushed down the road. So right now investors don’t have any incentive to buy gold,” Gaffney added.
U.S. stocks climbed back to near record highs on Friday after the largest U.S. bank, JPMorgan Chase & Co, soothed worries that the first-quarter earnings season would pour cold water on Wall Street’s big rally back from last year’s slump.
Now guys, we share with you our FPA position on what is going on around gold market and what could happen in long-term period. With "long-term" we understand 4-6 years. World already is started preparation to breaking of US dollar financing system. Now we see very important big steps in direction to gold as absolute measure of value for any asset. Here we mention just most important issues, that, by our thoughts, signal about this and confirm our suggestion.
1. It could be a surprise, but one of the major steps come from US itself. D. Trump spreads sanctions so wide and easy that it makes to treat US dollar not as comfortable payment currency but as a factor or risk. Indeed, many countries, including China take direct steps out from US dollar space to not hold USD assets in US banks and to not make transactions via US Banks as they could be frozen and blocked at any time. This makes countries to turn to trade in domestic currencies among each other or to use EUR, for example. Even EU, which business plans in Middle East and Iran were blocked by US, start to think about reducing of US dollar assets in international merchant. Of course, D. Trump does it not occasionally. This is the new role of US in global politics. US abandons the role of policeman to the world. Here we will not talk about it, because it is too large topic and needs additional research. D. Trump breaks old agreements, relations and allies, that doesn't agree with new US role. He does this particular by different unpopular of curious political measures - sanctions, trade wars, demanding money from to support NATO etc.
2. Basel III rules are must for all banks across the world. They change the rule of gold value in banks capital. Previously gold were on balance just with 50% of its market value, but now it is re-established in full payment power and calculated at 100% of value. Here we see the re-classification of gold from commodities group to money market group and return its role of money that it had in 1944, before Bretton Wood system was accepted. Now gold is global value barometer. Basel III also change balance in world finance, including World Bank, IMF voting rights etc.
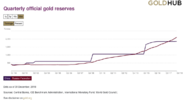
3. Central Banks across the world are buying gold with just outstanding tempo. Russia bought everything on domestic market and it was more than 230 tonnes. First time after WW II it reserves exceeded 2000 tones and it joined to big 5 countries with gold. Now it comes ahead of China. Take a look at China's buying as well.

A surge in gold purchases by central banks to the highest since 1967 helped push global demand for the metal up 4 percent last year, the World Gold Council (WGC).
Driving the increase were central banks which bought 651.5 tonnes - 74 percent more than in 2017 and the second highest annual total on record - as countries including China and Poland joined Russia, Turkey and Kazakhstan in adding to their reserves, the WGC said.
Take a look who is accompanied to Russia in this trend - China, Turkey, India and former Soviet Union republics. Even Poland and Hungary start buying gold.
Developed countries, France, Germany, China actively repatriates gold out from US.
Our thoughts is - Central Banks start preparation to major break of US Dollar system.
As we've mentioned last week, - being the world’s reserve currency confers significant benefits on the sovereign that owns the printing rights over that currency. The rest of the world has to hold assets denominated in that currency in large quantities, irrespective of the yield on those assets. Consequently, the average return achieved by the rest of the world on its assets held in dollars is far lower than the average return US citizens achieve on their holdings of non-dollar denominated assets. The difference in yield runs to 3–4% per annum. That yield differential can be thought of as a gift, from the rest of the world to the US, worth around 4% of US GDP per year every year. The name for that flow of money is seigniorage — specifically the seigniorage that flows to the printer of reserve currency.
But here we could ask the reasonable question. If there is a new gold rush in the world - why it is not growing? This is artificial effect guys. Currently, while US Dollar system is still working, everything has a price in relation to US dollar. Using market derivatives, such as gold futures and printing dollars - US could artificially hold the price of gold. This doesn't lead to increase of M3 supply as printed money puts in futures contracts. Holding artificial big short position in gold futures - it keeps gold price low. But this is temporal measure. Gradually, while dollar will be out of international trade, its ability to make impact on global markets will decrease and this bubble will blow with big crush of US Dollar system.
Besides, a lot of countries use this artificial price in their favor. China, Russia, puts vast part of international sales in gold. It means that Russia sells oil and gas not for currency but for gold and gets every time more gold than it should get for its hydro-carbons, just because US keeps gold price depressed. The same story for China. So the all burden and loss of international disbalance among prices of major commodities stands upon US. In fact, US financing gradual shift to new world monetary system.
Now the major thing - conclusion. We think that world has 4-6 years before new gold international payment system will be set. We expect that D. Trump will go on second term and continue the same financial policy. His task is to prepare US to new global system. If it would happen right now - US would be hurt by huge inflation, poverty and economy collapse. World can't let this to happen as US largest market in global financial system. Task of D. Trump is to cut unnecessary expenses such as war financing across the world and accumulate reserves in favor of Americans. But he day by day struggles on hidden front inside the country. Fifth column mostly from Democrats, stands at bay, trying to safe old order as they do not understand that their control over the world comes to an end. All this dirty stuff around D. Trump as T. Mueller Russian probes etc. - this is all done by 5th column. Trump has a lot of enemies, rats and betrayers inside.
It means that accumulating positions in delivery futures without any leverage, buying coins, bullion, or open metal accounts, gradually accumulate assets there is not bad idea in perspective of 4-6 years. Rally on gold market could be outstanding when it re-establish its real price.
COT report
Despite strong collapse this week, net long position was increased for 10K contracts. This is good news for us, because it stands in a agreement with our long-term scenario. Current drop is just a retracement, while we expect re-establish of bull trend somewhere around 1260 area:

Technical
Monthly
As gold market hit major target on weekly chart, it fluctuates inside major swings and mostly is driven by shorter-term factors. It makes minor impact on monthly picture and our long-term view. Recent fundamental and sentiment analysis shows that no big changes have happened and gold still stands positive. Despite technical retracement, we do not have reasons yet to cancel our long-term positive view on gold.
As we've said earlier, we're watching for our so called "symmetrical" model. It could be clear symmetry in market action, and we have suggested that future action could be a reflection of previous downside action shape.Now market has moved more above the trend line, which was a crucial level for long-term technical picture.
Gold shows good performance in December- February, which could put the foundation of new long-term upside trend. We still keep our harmonic technical model on monthly chart as primary tool of analysis. Current retracement down looks strong on daily chart, but it is just 30% of major swing up which is minimal level.
Fundamental reasons for gold rising mostly relate to changing of global political and economical situation. Strong global shifts never could happen without big political events. This should provide big support to gold market. Now it is widely suggested that these processes should accelerate closer to 2020 year, or even in second half of 2019. For example, here is report by Fathom Consulting and their expectations to see world crisis around 2020.
Here is explanation of our "symmetrical" model and scenario. Recent action on gold market reminds reverse H&S shape but very choppy and extended in time. Important COP target has been hit and upside action has started. In fact we have mirror action to the right and to the left from COP point. Market forms approximately equal lows on both sides. The speed is also similar. Is it possible that reversal is forming? Why not.
On monthly chart we keep watching whether gold will be able to hold above trend line. Now price stands above YPP as well, but it has not been tested yet by price. As meaningful retracement stands under way - YPP should work as nearest destination point.
Among bullish signs we could mention MACD hidden divergence which suggests action above 1380 top in long-term perspective.

Weekly
As bullish B&B "Buy" was done, here we have just one pattern that we're trading right now - "222" Sell. Its minimal target stands at 1275 level that has not been reached yet.
Last week we've got another important pattern on weekly chart - reversal candle. It shows new top compares to previous one and close below the lows of previous week. In fact, it engulfs almost the whole month of action.
Reversal weeks have the feature of continuation. Usually, once it was formed, market usually shows continuation down. In general, this corresponds to our minimal 1275 target and gives the answer on question - is it time to go long already or not. First week of April has shy trading range and makes no impact on weekly chart. So, our weekly trading plan stands the same.

Daily
Here guys you can see our major trading plan for few weeks probably. As sell-off has happened, we treat it as continuation of major downside tendency that was interrupted by retracement and reaction on COP target. We've traded it within previous two weeks.
Ultimately to complete setup perfectly, gold has to drop right to 1260 area and hit as major OP target as 1.618 butterfly extension. This should be our long-term setup for long entry.
At the same time we see a lot of support levels on a way down, and gold could limit downside action by shyer targets, say 1270 1.27 extension. Besides, on next week this will be daily Oversold as well. Thus, the floor for coming week is 1270 area. Once action will start - we will see what target to follow, depending on strength of downside action.

Intraday
Here we also have minor AB-CD pattern, inner to butterfly, and the first target stands at 1283 area - COP.
This is the level where more or less solid upside bounce could happen and it could provide opportunity for short entry. Currently it is difficult to say something more. Definitely we do not have any bullish setups here yet, but for short-entry it would be better to get a retracement and "222" Sell, for example, on a background.

That's being said, until market either will form something irrational, say, jump above 1310-1322 area, erasing daily butterfly, or complete our bearish setup - we keep downside scenario valid.
The technical portion of Sive's analysis owes a great deal to Joe DiNapoli's methods, and uses a number of Joe's proprietary indicators. Please note that Sive's analysis is his own view of the market and is not endorsed by Joe DiNapoli or any related companies.
The major action of this week was Thursday's drop on gold market. Despite that gold has dropped a bit later, compares to our expectation but it was not a surprise for us.
Gold prices fell below the key $1,300 level on Thursday as a firm dollar and improved risk appetite on the back of a rise in European airline stocks pulled investors away from bullion.
Gold is being pressured by “the recovery in the risk appetite, some optimism on the trade front and a firm U.S dollar”, said Ryan McKay, commodity strategist at TD Securities.
European shares advanced on Thursday, helped by a rise in airline stocks, after European Union leaders gave Britain another six months to leave the bloc.
Dovish views from major central banks on Wednesday failed to help gold. Lower interest rates reduce the opportunity cost of holding non-yielding bullion.
“Dovish central banks have been baked into the cake right now. Gold markets have known of this for a couple of months,” McKay said.
The U.S. Federal Reserve’s minutes restated its view on the risks of a global economic slowdown, while the European Central Bank kept its ultra-easy monetary policy unchanged.
“In the near term, I am a little bit bearish on gold. I think a break below $1,280 an ounce could trigger a potential move towards $1,260-$1,240,” OANDA senior market analyst Craig Erlam said.
The United States and China have largely agreed on a mechanism to police any trade agreement they reach, including establishing new “enforcement offices”, U.S. Treasury Secretary Steven Mnuchin said on Wednesday.
Gold inched lower on Friday, having posted its biggest daily decline in two weeks in the previous session, as the impact of a weak dollar was offset by gains on Wall Street.
“The dollar strength really hurt precious metals and we’re seeing some of that reverse with most currencies running a little higher versus the dollar,” said Chris Gaffney, president of world markets at TIAA Bank.
“We’ve got tame inflation, the trade situation is getting resolved and Brexit looks like it’s going to be pushed down the road. So right now investors don’t have any incentive to buy gold,” Gaffney added.
U.S. stocks climbed back to near record highs on Friday after the largest U.S. bank, JPMorgan Chase & Co, soothed worries that the first-quarter earnings season would pour cold water on Wall Street’s big rally back from last year’s slump.
Now guys, we share with you our FPA position on what is going on around gold market and what could happen in long-term period. With "long-term" we understand 4-6 years. World already is started preparation to breaking of US dollar financing system. Now we see very important big steps in direction to gold as absolute measure of value for any asset. Here we mention just most important issues, that, by our thoughts, signal about this and confirm our suggestion.
1. It could be a surprise, but one of the major steps come from US itself. D. Trump spreads sanctions so wide and easy that it makes to treat US dollar not as comfortable payment currency but as a factor or risk. Indeed, many countries, including China take direct steps out from US dollar space to not hold USD assets in US banks and to not make transactions via US Banks as they could be frozen and blocked at any time. This makes countries to turn to trade in domestic currencies among each other or to use EUR, for example. Even EU, which business plans in Middle East and Iran were blocked by US, start to think about reducing of US dollar assets in international merchant. Of course, D. Trump does it not occasionally. This is the new role of US in global politics. US abandons the role of policeman to the world. Here we will not talk about it, because it is too large topic and needs additional research. D. Trump breaks old agreements, relations and allies, that doesn't agree with new US role. He does this particular by different unpopular of curious political measures - sanctions, trade wars, demanding money from to support NATO etc.
2. Basel III rules are must for all banks across the world. They change the rule of gold value in banks capital. Previously gold were on balance just with 50% of its market value, but now it is re-established in full payment power and calculated at 100% of value. Here we see the re-classification of gold from commodities group to money market group and return its role of money that it had in 1944, before Bretton Wood system was accepted. Now gold is global value barometer. Basel III also change balance in world finance, including World Bank, IMF voting rights etc.
3. Central Banks across the world are buying gold with just outstanding tempo. Russia bought everything on domestic market and it was more than 230 tonnes. First time after WW II it reserves exceeded 2000 tones and it joined to big 5 countries with gold. Now it comes ahead of China. Take a look at China's buying as well.
A surge in gold purchases by central banks to the highest since 1967 helped push global demand for the metal up 4 percent last year, the World Gold Council (WGC).
Driving the increase were central banks which bought 651.5 tonnes - 74 percent more than in 2017 and the second highest annual total on record - as countries including China and Poland joined Russia, Turkey and Kazakhstan in adding to their reserves, the WGC said.
Take a look who is accompanied to Russia in this trend - China, Turkey, India and former Soviet Union republics. Even Poland and Hungary start buying gold.
Developed countries, France, Germany, China actively repatriates gold out from US.
Our thoughts is - Central Banks start preparation to major break of US Dollar system.
As we've mentioned last week, - being the world’s reserve currency confers significant benefits on the sovereign that owns the printing rights over that currency. The rest of the world has to hold assets denominated in that currency in large quantities, irrespective of the yield on those assets. Consequently, the average return achieved by the rest of the world on its assets held in dollars is far lower than the average return US citizens achieve on their holdings of non-dollar denominated assets. The difference in yield runs to 3–4% per annum. That yield differential can be thought of as a gift, from the rest of the world to the US, worth around 4% of US GDP per year every year. The name for that flow of money is seigniorage — specifically the seigniorage that flows to the printer of reserve currency.
But here we could ask the reasonable question. If there is a new gold rush in the world - why it is not growing? This is artificial effect guys. Currently, while US Dollar system is still working, everything has a price in relation to US dollar. Using market derivatives, such as gold futures and printing dollars - US could artificially hold the price of gold. This doesn't lead to increase of M3 supply as printed money puts in futures contracts. Holding artificial big short position in gold futures - it keeps gold price low. But this is temporal measure. Gradually, while dollar will be out of international trade, its ability to make impact on global markets will decrease and this bubble will blow with big crush of US Dollar system.
Besides, a lot of countries use this artificial price in their favor. China, Russia, puts vast part of international sales in gold. It means that Russia sells oil and gas not for currency but for gold and gets every time more gold than it should get for its hydro-carbons, just because US keeps gold price depressed. The same story for China. So the all burden and loss of international disbalance among prices of major commodities stands upon US. In fact, US financing gradual shift to new world monetary system.
Now the major thing - conclusion. We think that world has 4-6 years before new gold international payment system will be set. We expect that D. Trump will go on second term and continue the same financial policy. His task is to prepare US to new global system. If it would happen right now - US would be hurt by huge inflation, poverty and economy collapse. World can't let this to happen as US largest market in global financial system. Task of D. Trump is to cut unnecessary expenses such as war financing across the world and accumulate reserves in favor of Americans. But he day by day struggles on hidden front inside the country. Fifth column mostly from Democrats, stands at bay, trying to safe old order as they do not understand that their control over the world comes to an end. All this dirty stuff around D. Trump as T. Mueller Russian probes etc. - this is all done by 5th column. Trump has a lot of enemies, rats and betrayers inside.
It means that accumulating positions in delivery futures without any leverage, buying coins, bullion, or open metal accounts, gradually accumulate assets there is not bad idea in perspective of 4-6 years. Rally on gold market could be outstanding when it re-establish its real price.
COT report
Despite strong collapse this week, net long position was increased for 10K contracts. This is good news for us, because it stands in a agreement with our long-term scenario. Current drop is just a retracement, while we expect re-establish of bull trend somewhere around 1260 area:
Technical
Monthly
As gold market hit major target on weekly chart, it fluctuates inside major swings and mostly is driven by shorter-term factors. It makes minor impact on monthly picture and our long-term view. Recent fundamental and sentiment analysis shows that no big changes have happened and gold still stands positive. Despite technical retracement, we do not have reasons yet to cancel our long-term positive view on gold.
As we've said earlier, we're watching for our so called "symmetrical" model. It could be clear symmetry in market action, and we have suggested that future action could be a reflection of previous downside action shape.Now market has moved more above the trend line, which was a crucial level for long-term technical picture.
Gold shows good performance in December- February, which could put the foundation of new long-term upside trend. We still keep our harmonic technical model on monthly chart as primary tool of analysis. Current retracement down looks strong on daily chart, but it is just 30% of major swing up which is minimal level.
Fundamental reasons for gold rising mostly relate to changing of global political and economical situation. Strong global shifts never could happen without big political events. This should provide big support to gold market. Now it is widely suggested that these processes should accelerate closer to 2020 year, or even in second half of 2019. For example, here is report by Fathom Consulting and their expectations to see world crisis around 2020.
Here is explanation of our "symmetrical" model and scenario. Recent action on gold market reminds reverse H&S shape but very choppy and extended in time. Important COP target has been hit and upside action has started. In fact we have mirror action to the right and to the left from COP point. Market forms approximately equal lows on both sides. The speed is also similar. Is it possible that reversal is forming? Why not.
On monthly chart we keep watching whether gold will be able to hold above trend line. Now price stands above YPP as well, but it has not been tested yet by price. As meaningful retracement stands under way - YPP should work as nearest destination point.
Among bullish signs we could mention MACD hidden divergence which suggests action above 1380 top in long-term perspective.
Weekly
As bullish B&B "Buy" was done, here we have just one pattern that we're trading right now - "222" Sell. Its minimal target stands at 1275 level that has not been reached yet.
Last week we've got another important pattern on weekly chart - reversal candle. It shows new top compares to previous one and close below the lows of previous week. In fact, it engulfs almost the whole month of action.
Reversal weeks have the feature of continuation. Usually, once it was formed, market usually shows continuation down. In general, this corresponds to our minimal 1275 target and gives the answer on question - is it time to go long already or not. First week of April has shy trading range and makes no impact on weekly chart. So, our weekly trading plan stands the same.
Daily
Here guys you can see our major trading plan for few weeks probably. As sell-off has happened, we treat it as continuation of major downside tendency that was interrupted by retracement and reaction on COP target. We've traded it within previous two weeks.
Ultimately to complete setup perfectly, gold has to drop right to 1260 area and hit as major OP target as 1.618 butterfly extension. This should be our long-term setup for long entry.
At the same time we see a lot of support levels on a way down, and gold could limit downside action by shyer targets, say 1270 1.27 extension. Besides, on next week this will be daily Oversold as well. Thus, the floor for coming week is 1270 area. Once action will start - we will see what target to follow, depending on strength of downside action.
Intraday
Here we also have minor AB-CD pattern, inner to butterfly, and the first target stands at 1283 area - COP.
This is the level where more or less solid upside bounce could happen and it could provide opportunity for short entry. Currently it is difficult to say something more. Definitely we do not have any bullish setups here yet, but for short-entry it would be better to get a retracement and "222" Sell, for example, on a background.
That's being said, until market either will form something irrational, say, jump above 1310-1322 area, erasing daily butterfly, or complete our bearish setup - we keep downside scenario valid.
The technical portion of Sive's analysis owes a great deal to Joe DiNapoli's methods, and uses a number of Joe's proprietary indicators. Please note that Sive's analysis is his own view of the market and is not endorsed by Joe DiNapoli or any related companies.