Sive Morten
Special Consultant to the FPA
- Messages
- 18,695
Fundamentals
Weekly Gold Tading Report prepared by Sive Morten exclusively for ForexPeaceArmy.com
As Reuters reports Gold pared gains on Friday, heading for a second weekly drop, after data showing U.S. consumer prices rose in March tempered speculation the Federal Reserve will delay its first interest rate rise in nearly a decade.
The metal held above the $1,200 an ounce level, however, which it broke above earlier this week after a run of downbeat U.S. data led analysts to reassess expectations the Fed would raise rates in June.
The dollar turned positive after U.S. inflation data.
"Still seems very much (like) range bound trading in the days ahead," said Steve Scacalossi, Director and Head of Sales for Global Metals at TD Securities in New York, in a note.
"Some attention is now focused on the end of April for some guidance from the next FOMC meeting on 29th April.
Gold is sensitive to U.S. monetary policy, as rising rates would boost the dollar, in which the metal is priced, while lifting the opportunity cost of holding non-yielding bullion.
"Even if the rate rise gets pushed back, people still see rates rising, and we believe that's still a negative for gold," Julius Baer commodity analyst Warren Kreyzig said.
"The delay may give gold a reprieve, but in the long term we think it will still go down."
Adding to the rates uncertainty were comments from Fed officials on Thursday that showed officials at odds over the timing of a move.
"Expectation once again is for rate rises to be pushed out even later. September or October has been our base assumption for some time, but I've heard talk in the last couple of days of rate rises being pushed out to 2016," Mitsubishi analyst Jonathan Butler said. "That's all positive for gold."
Physical buying in the world's top two gold-consuming countries remained slow this week. Premiums in China improved only slightly and those in India slipped as prices stabilized at $1,200 an ounce.
Recent CFTC data barely has changed. We see shy growth in open interest and long positions. But it will be more correct to call it as flat. Sentiment has not changed and investors still do not take bet on upward action. Shorts were closed but no corresponding longs were opened. At the same time recent data does not encourage much to take new shorts since recent data from US is not as strong as it was expected. That’s why short positions also stands mostly flat.
Here is detailed breakdown of speculative positions:
Open interest:
 Shorts:
 Longs:
 Summary:
Technicals
Monthly
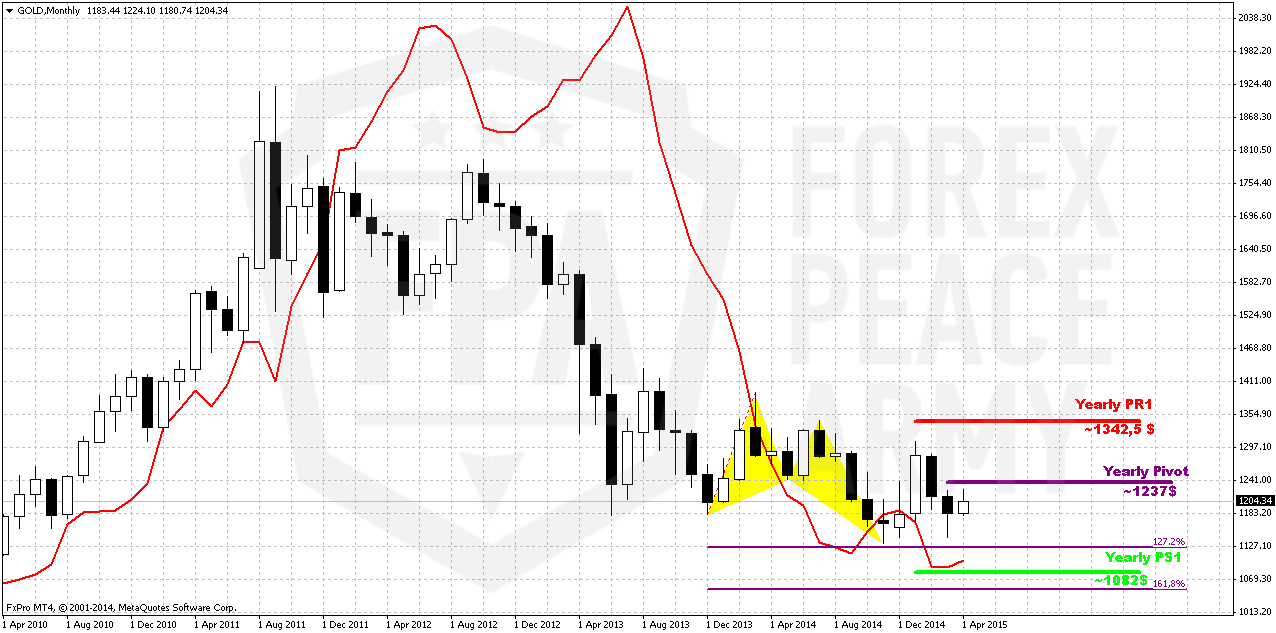
There is really shy difference in close price from previous week. On long-term horizon we still have last big pattern in progress that is Volatility breakout (VOB). It suggests at least 0.618 AB-CD down. And this target is 1050$. At the same time we need 1130 breakout to start clearly speak on 1050 target.
In the beginning of the year market showed solid upside action. Gold was able to exceed yearly pivot, passed half way to Yearly Pivot resistance 1 but right now has reversed down and closed below YPP. From technical point of view this is bearish sign. This could be very significant moment and next logical destination will be yearly pivot support 1 around 1083$.
Recent US economy data mostly was positive but not as strong as investors have expected. Many investors concern about anemic wage growth, although in recent time this indicator shows improving. So, it seems that gold will remain hostage of dollar value and US economical data (mostly inflation) in nearest perspective. Approximately the same was announced by Fed in forecast on inflation and had become a reason of dovish approach to rate hiking. Another concern right now is too strong dollar that becomes a problem per se for economy growth and kills inflation. Prices are fallen so no needs to hike rates.
Still, if we will take into consideration geopolitical situation and risks that have appeared recently, it could happen that situation will change, especially if situation in Ukraine will escalate and peaceful regulation will fail. Day by day we see worrying geopolitical news.
That’s being said, economical data in general still supports further gold decreasing in long term but geopolicy could bring significant adjustment. Unfortunately the geopolicy is sphere where we can’t do much. As gold has passed through 1200, our next destination point is previous lows at 1130, but since gold is returning to them again – this is temporal destination and we should prepare for further downward action. Besides, right now we can clear recognized bearish dynamic pressure on monthly chart. Take a look, although trend has turned bullish, but market was unable to show more or less meaningful upside action. Right now we see the tendency of lower highs creation and this significantly increases chances on downward breakout.
Weekly
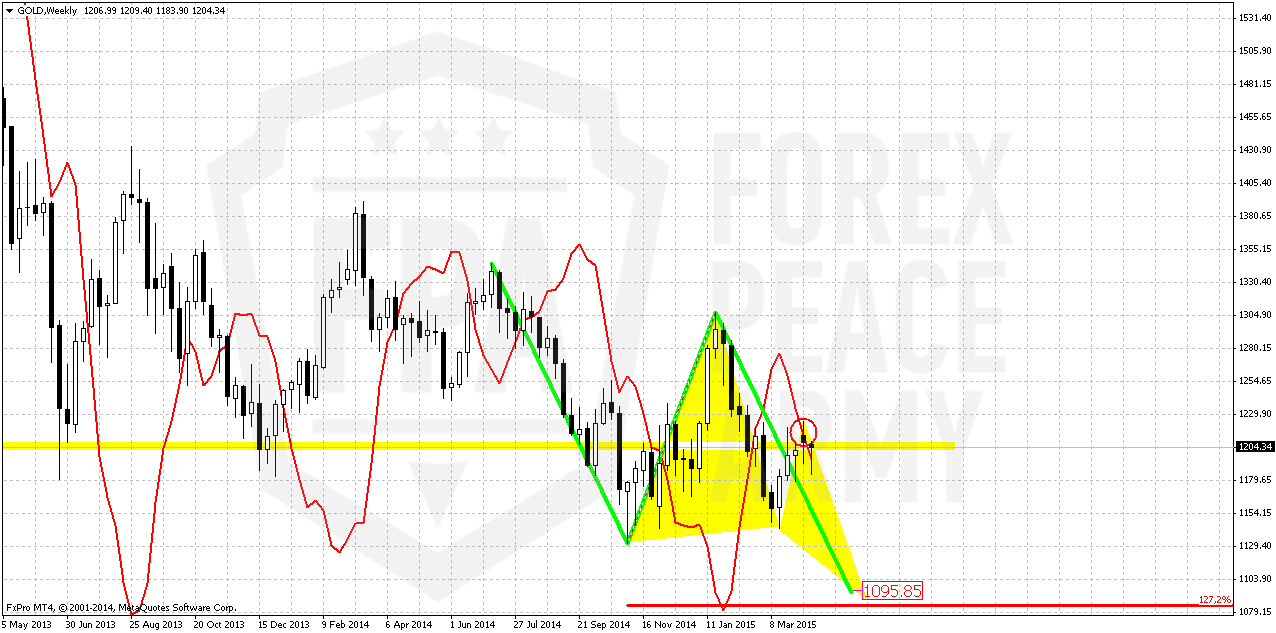
Weekly chart also works “on perspective” since all patterns that we have here mostly are bearish. If you will take a look at weekly chart closely you will find a lot of different targets – AB-CD’s, couple of butterflies etc. By the way, most recent action also could turn to butterfly… and all of them have targets below current level.
Previously we’ve expected the reaction on poor NFP data but reaction mostly was mild. If even market will continue move up somehow until it will hold below 1313 top – bearish sentiment will be valid, because monthly bearish dynamic pressure will be valid and market will keep chance on forming butterfly. Only if market will move above 1313 top – it will break tendency of lower highs and put under question further downward action.
This looks not very possible right now, by having such CFTC data on the back and since we’ve got bearish grabber on weekly. That’s the pattern that could trigger downward continuation. At least we could stick with its range for trading. It suggests taking out of former lows and could lead market simultaneously to AB=CD and butterfly destination points. This confirms that return back to 1130 area will be temporal even and just preparation for further drop. Last week action was not very impressive, trend even has turned bullish, but still this action was mostly down and grabber still valid. It means that currently we have no sense to change trading plan since our context is still valid. To destroy this setup gold needs at least erase the grabber.
All other targets stand significantly lower – 1080, 1050 and even 990$.
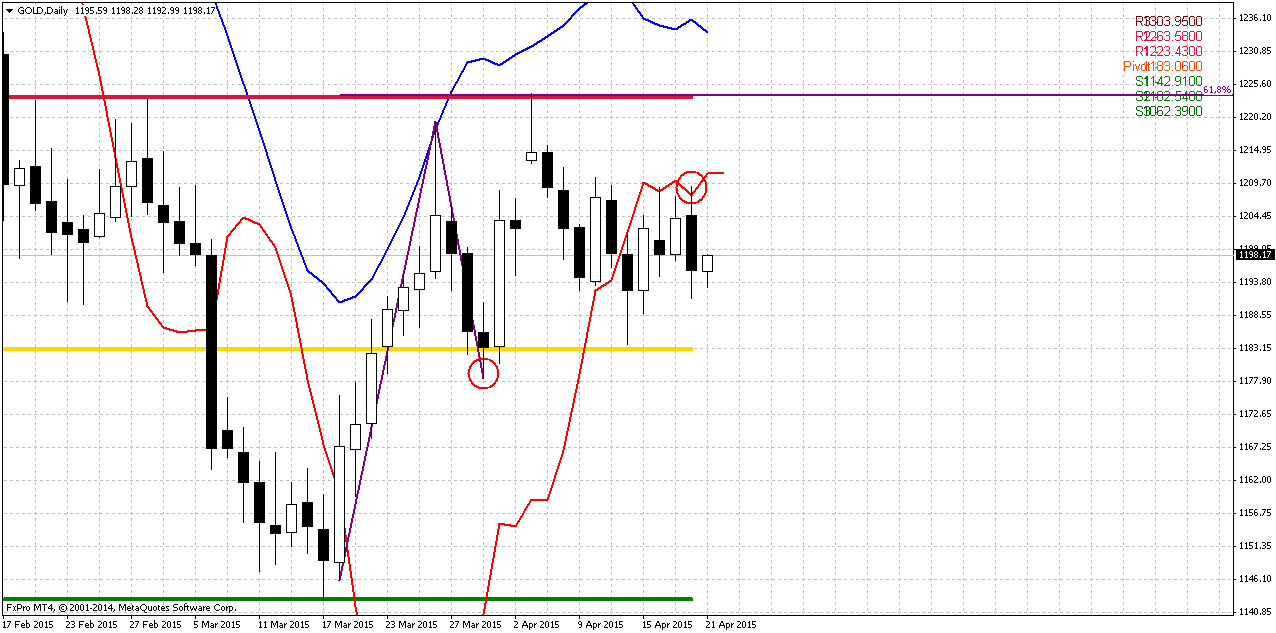
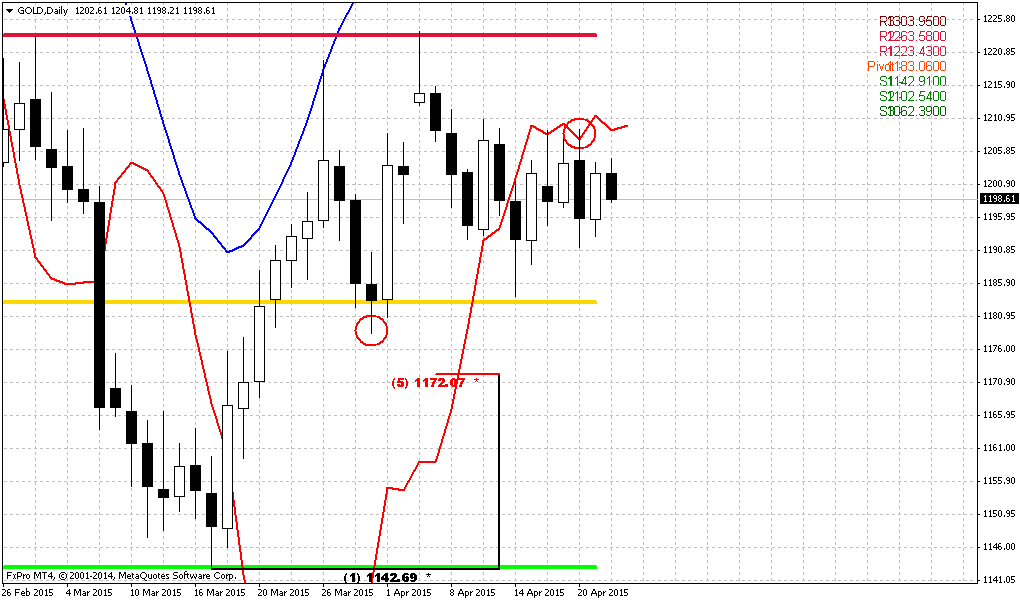
Daily
Price has little changed since Friday and all that we’ve said in update is still valid. Mostly guys, as sentiment data was not changing for considerable time, it seems, that investors mostly wait for Fed on 28-29th of April. Hardly any strong action will happen in nearest week, only if we will get some breaking news either economical or geopolitical. If instead everything will be as usual – market probably will stay quiet for couple of weeks.
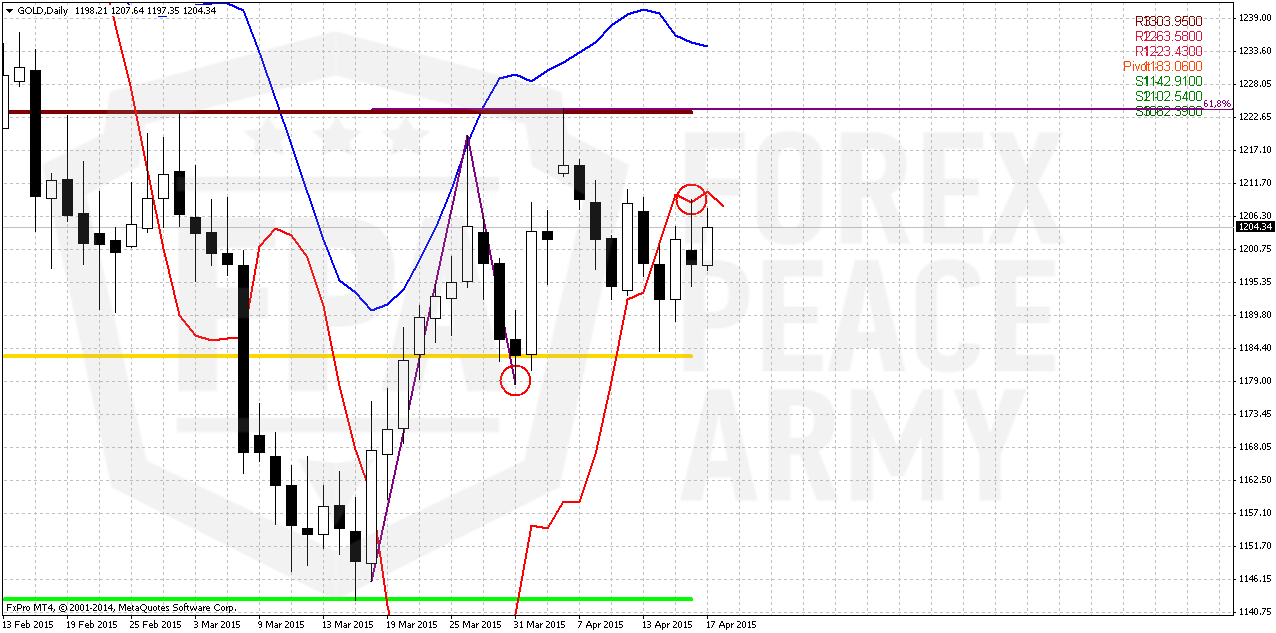
Recently we’ve estimated that 1210-1212 area is acceptable ceil for normal bearish market. Any action above this level will break short-term bearish sentiment and open road for further upside development. Currently this level still holds. Daily picture shows opposite patterns – bearish grabber and signs of bullish dynamic pressure. Both of them suggest opposite action. At the same time – grabber still valid and keeps recent action. If market will pass through 1175 lows – this will be significant impact for bulls and gold could shows downward acceleration. But may be market will remain in this range till Fed meeting. Anyway, currently we have pattern in place and will work with it until its target will be completed or pattern will fail.
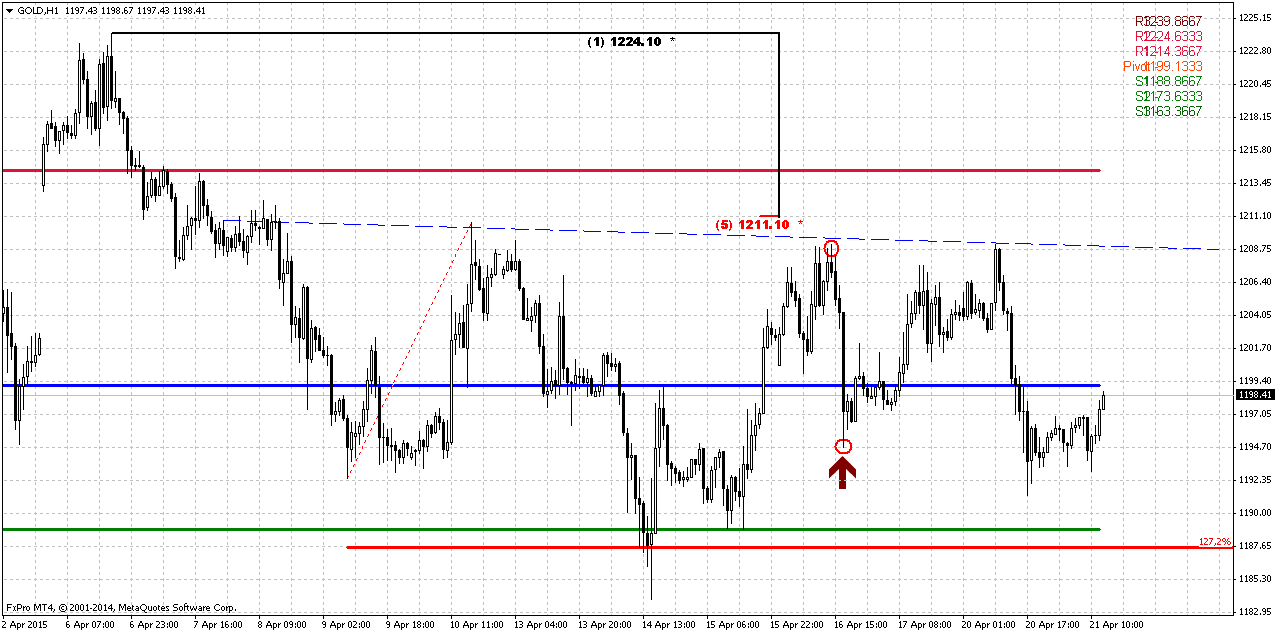
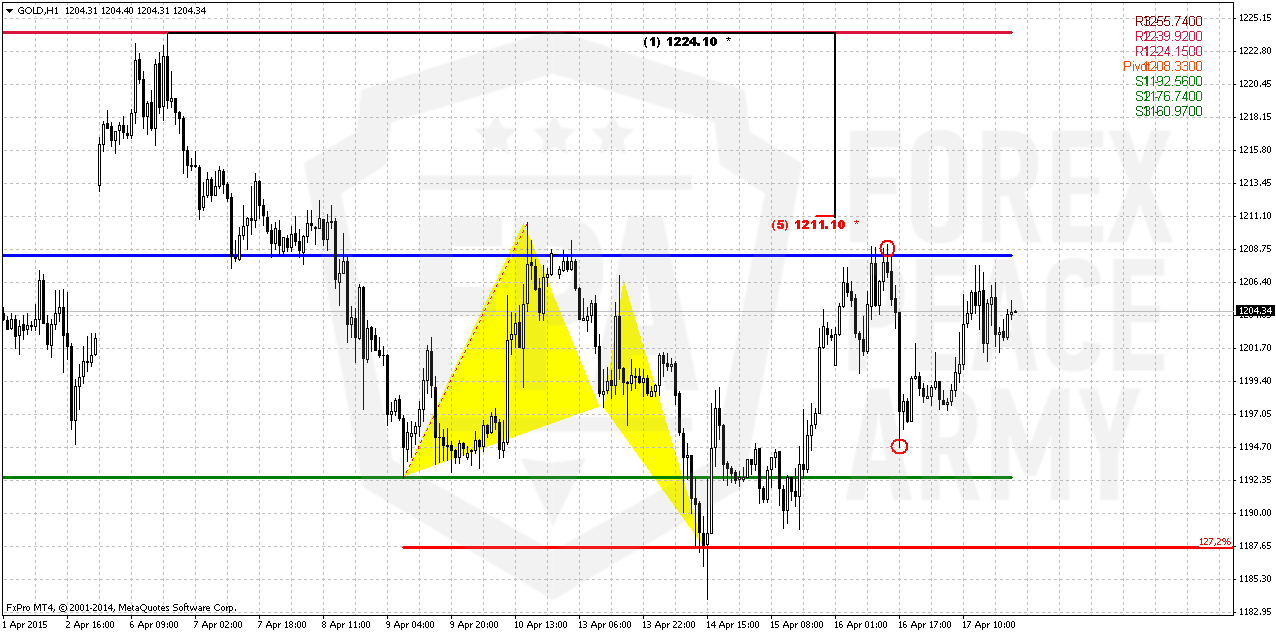
1-hour
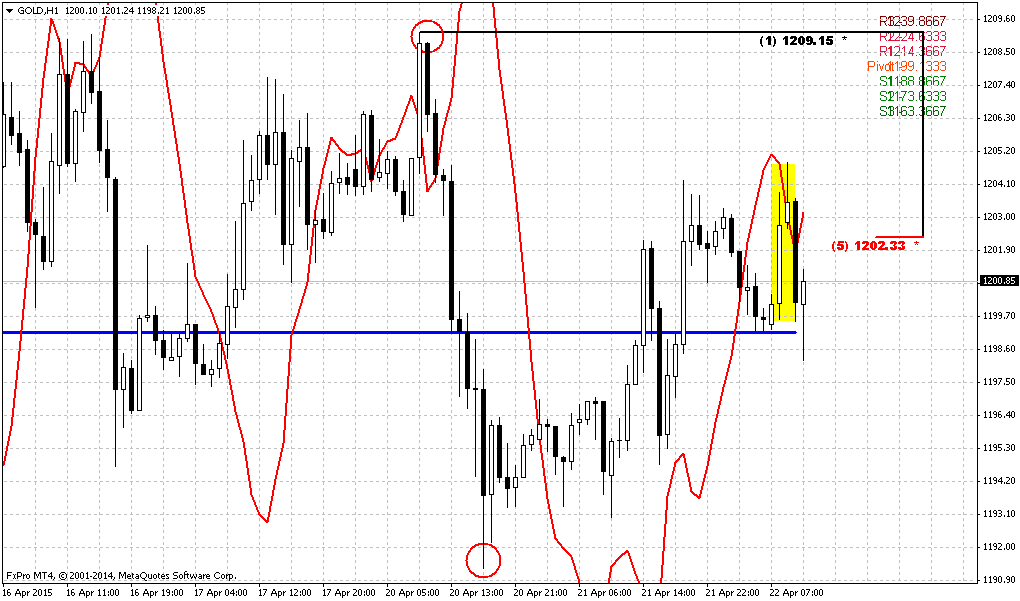
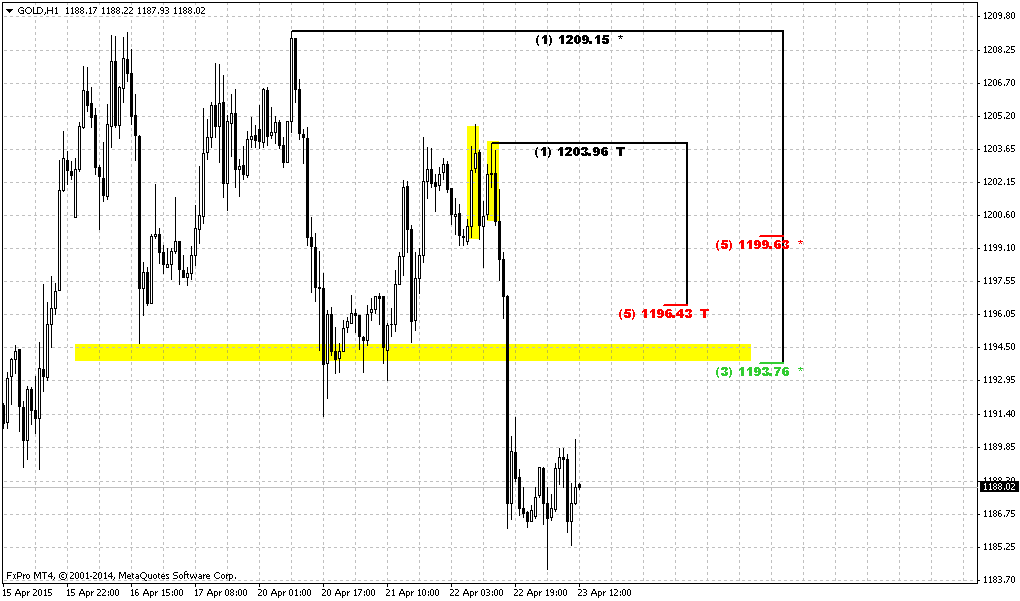
As we mostly have no patterns expect daily grabber, let see what could happen. 1210 area is top around WPP and in fact invalidation of daily grabber. At the same time we could recognize the shape of H&S Pattern that conversely suggests upside action and it’s invalidation point will stand at 1194 lows. If market will return back below right shoulder then H&S mostly will fail.
Recent action does not exclude change of appearing upside butterfly if bullish position will take the lead. As a result we could act differently. Thus, if you want to take short position – currently probably is not bad area where you can do this, since market stands very close to invalidation point and risk is small. Conversely you could wait for breakout - either upside or downside. This will be safer but entry point probably will be worse. But to be honest guys, overall short-term setup on gold is not very fascinating, especially if we will take into consideration recent lazy and choppy action.
Conclusion:
Long-term picture remains bearish and major patterns stand intact. CFTC and SDPR data does not show on some drastical shifts in sentiment. Thus, upward action has blur perspective and reliability. As weekly chart has given us bearish grabber, we mostly should prepare for taking short position. At the same time recent data was soft and investors have taken more balanced position and mostly wait for some driving factor that finally could clarify situation and at least short-term direction.
The technical portion of Sive's analysis owes a great deal to Joe DiNapoli's methods, and uses a number of Joe's proprietary indicators. Please note that Sive's analysis is his own view of the market and is not endorsed by Joe DiNapoli or any related companies.
Weekly Gold Tading Report prepared by Sive Morten exclusively for ForexPeaceArmy.com
As Reuters reports Gold pared gains on Friday, heading for a second weekly drop, after data showing U.S. consumer prices rose in March tempered speculation the Federal Reserve will delay its first interest rate rise in nearly a decade.
The metal held above the $1,200 an ounce level, however, which it broke above earlier this week after a run of downbeat U.S. data led analysts to reassess expectations the Fed would raise rates in June.
The dollar turned positive after U.S. inflation data.
"Still seems very much (like) range bound trading in the days ahead," said Steve Scacalossi, Director and Head of Sales for Global Metals at TD Securities in New York, in a note.
"Some attention is now focused on the end of April for some guidance from the next FOMC meeting on 29th April.
Gold is sensitive to U.S. monetary policy, as rising rates would boost the dollar, in which the metal is priced, while lifting the opportunity cost of holding non-yielding bullion.
"Even if the rate rise gets pushed back, people still see rates rising, and we believe that's still a negative for gold," Julius Baer commodity analyst Warren Kreyzig said.
"The delay may give gold a reprieve, but in the long term we think it will still go down."
Adding to the rates uncertainty were comments from Fed officials on Thursday that showed officials at odds over the timing of a move.
"Expectation once again is for rate rises to be pushed out even later. September or October has been our base assumption for some time, but I've heard talk in the last couple of days of rate rises being pushed out to 2016," Mitsubishi analyst Jonathan Butler said. "That's all positive for gold."
Physical buying in the world's top two gold-consuming countries remained slow this week. Premiums in China improved only slightly and those in India slipped as prices stabilized at $1,200 an ounce.
Recent CFTC data barely has changed. We see shy growth in open interest and long positions. But it will be more correct to call it as flat. Sentiment has not changed and investors still do not take bet on upward action. Shorts were closed but no corresponding longs were opened. At the same time recent data does not encourage much to take new shorts since recent data from US is not as strong as it was expected. That’s why short positions also stands mostly flat.
Here is detailed breakdown of speculative positions:
Open interest:
Technicals
Monthly
There is really shy difference in close price from previous week. On long-term horizon we still have last big pattern in progress that is Volatility breakout (VOB). It suggests at least 0.618 AB-CD down. And this target is 1050$. At the same time we need 1130 breakout to start clearly speak on 1050 target.
In the beginning of the year market showed solid upside action. Gold was able to exceed yearly pivot, passed half way to Yearly Pivot resistance 1 but right now has reversed down and closed below YPP. From technical point of view this is bearish sign. This could be very significant moment and next logical destination will be yearly pivot support 1 around 1083$.
Recent US economy data mostly was positive but not as strong as investors have expected. Many investors concern about anemic wage growth, although in recent time this indicator shows improving. So, it seems that gold will remain hostage of dollar value and US economical data (mostly inflation) in nearest perspective. Approximately the same was announced by Fed in forecast on inflation and had become a reason of dovish approach to rate hiking. Another concern right now is too strong dollar that becomes a problem per se for economy growth and kills inflation. Prices are fallen so no needs to hike rates.
Still, if we will take into consideration geopolitical situation and risks that have appeared recently, it could happen that situation will change, especially if situation in Ukraine will escalate and peaceful regulation will fail. Day by day we see worrying geopolitical news.
That’s being said, economical data in general still supports further gold decreasing in long term but geopolicy could bring significant adjustment. Unfortunately the geopolicy is sphere where we can’t do much. As gold has passed through 1200, our next destination point is previous lows at 1130, but since gold is returning to them again – this is temporal destination and we should prepare for further downward action. Besides, right now we can clear recognized bearish dynamic pressure on monthly chart. Take a look, although trend has turned bullish, but market was unable to show more or less meaningful upside action. Right now we see the tendency of lower highs creation and this significantly increases chances on downward breakout.
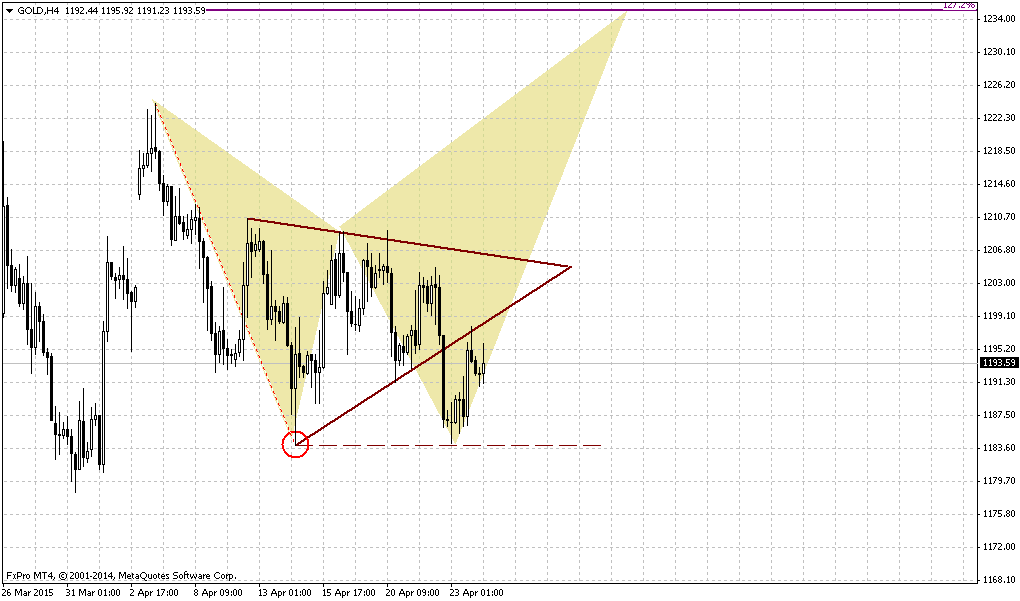
Weekly
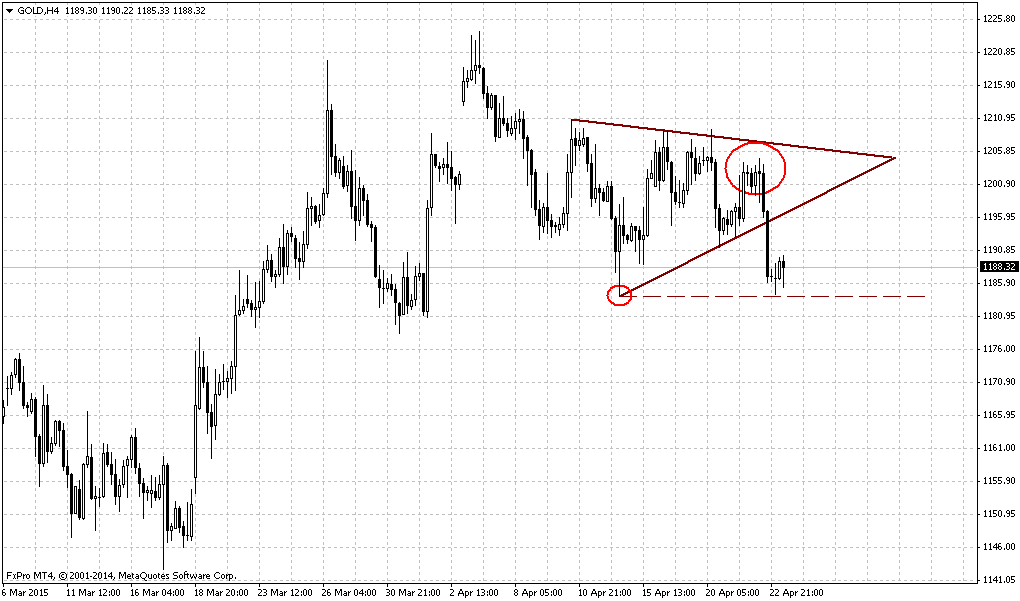
Weekly chart also works “on perspective” since all patterns that we have here mostly are bearish. If you will take a look at weekly chart closely you will find a lot of different targets – AB-CD’s, couple of butterflies etc. By the way, most recent action also could turn to butterfly… and all of them have targets below current level.
Previously we’ve expected the reaction on poor NFP data but reaction mostly was mild. If even market will continue move up somehow until it will hold below 1313 top – bearish sentiment will be valid, because monthly bearish dynamic pressure will be valid and market will keep chance on forming butterfly. Only if market will move above 1313 top – it will break tendency of lower highs and put under question further downward action.
This looks not very possible right now, by having such CFTC data on the back and since we’ve got bearish grabber on weekly. That’s the pattern that could trigger downward continuation. At least we could stick with its range for trading. It suggests taking out of former lows and could lead market simultaneously to AB=CD and butterfly destination points. This confirms that return back to 1130 area will be temporal even and just preparation for further drop. Last week action was not very impressive, trend even has turned bullish, but still this action was mostly down and grabber still valid. It means that currently we have no sense to change trading plan since our context is still valid. To destroy this setup gold needs at least erase the grabber.
All other targets stand significantly lower – 1080, 1050 and even 990$.
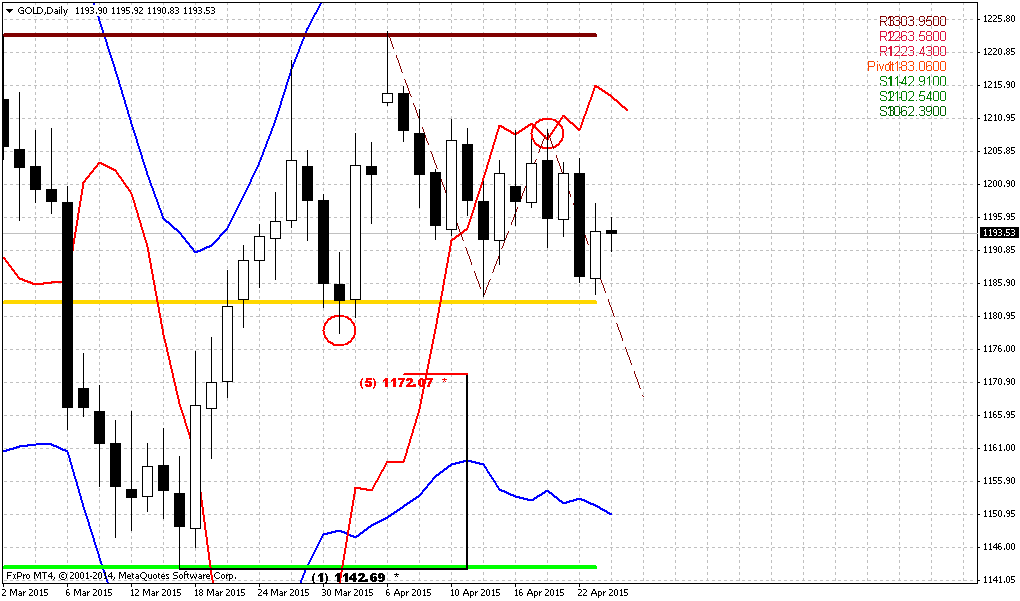
Daily
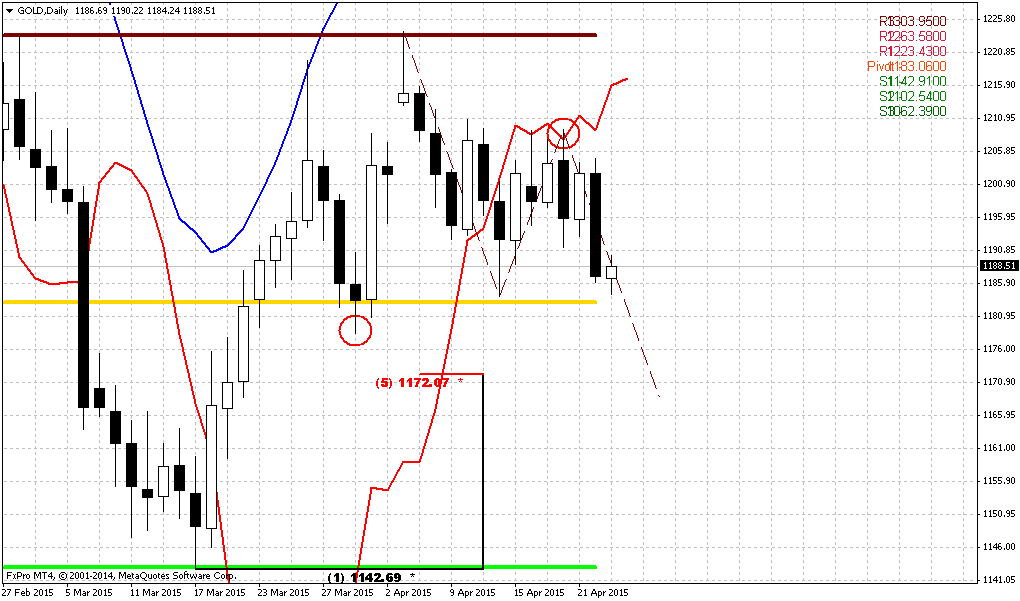
Price has little changed since Friday and all that we’ve said in update is still valid. Mostly guys, as sentiment data was not changing for considerable time, it seems, that investors mostly wait for Fed on 28-29th of April. Hardly any strong action will happen in nearest week, only if we will get some breaking news either economical or geopolitical. If instead everything will be as usual – market probably will stay quiet for couple of weeks.
Recently we’ve estimated that 1210-1212 area is acceptable ceil for normal bearish market. Any action above this level will break short-term bearish sentiment and open road for further upside development. Currently this level still holds. Daily picture shows opposite patterns – bearish grabber and signs of bullish dynamic pressure. Both of them suggest opposite action. At the same time – grabber still valid and keeps recent action. If market will pass through 1175 lows – this will be significant impact for bulls and gold could shows downward acceleration. But may be market will remain in this range till Fed meeting. Anyway, currently we have pattern in place and will work with it until its target will be completed or pattern will fail.
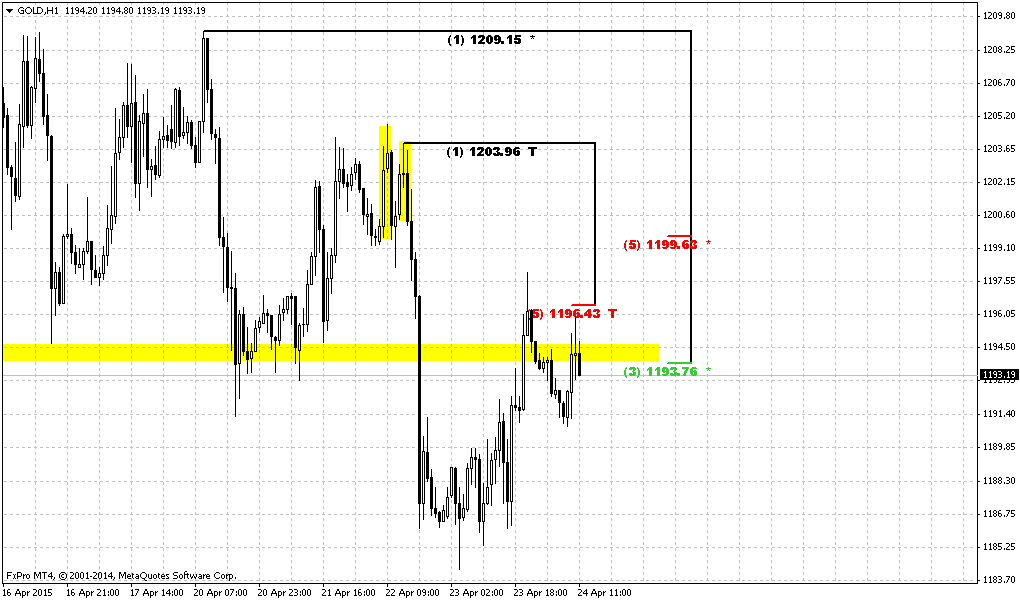
1-hour
As we mostly have no patterns expect daily grabber, let see what could happen. 1210 area is top around WPP and in fact invalidation of daily grabber. At the same time we could recognize the shape of H&S Pattern that conversely suggests upside action and it’s invalidation point will stand at 1194 lows. If market will return back below right shoulder then H&S mostly will fail.
Recent action does not exclude change of appearing upside butterfly if bullish position will take the lead. As a result we could act differently. Thus, if you want to take short position – currently probably is not bad area where you can do this, since market stands very close to invalidation point and risk is small. Conversely you could wait for breakout - either upside or downside. This will be safer but entry point probably will be worse. But to be honest guys, overall short-term setup on gold is not very fascinating, especially if we will take into consideration recent lazy and choppy action.
Conclusion:
Long-term picture remains bearish and major patterns stand intact. CFTC and SDPR data does not show on some drastical shifts in sentiment. Thus, upward action has blur perspective and reliability. As weekly chart has given us bearish grabber, we mostly should prepare for taking short position. At the same time recent data was soft and investors have taken more balanced position and mostly wait for some driving factor that finally could clarify situation and at least short-term direction.
The technical portion of Sive's analysis owes a great deal to Joe DiNapoli's methods, and uses a number of Joe's proprietary indicators. Please note that Sive's analysis is his own view of the market and is not endorsed by Joe DiNapoli or any related companies.