Sive Morten
Special Consultant to the FPA
- Messages
- 18,655
Fundamentals
In general gold has the same driving factors this week as FX market, but it shows a bit different reaction because of political component. For instance, FX market under recent D. Trump statement sees only softer USD, while for gold market this is also political risks and demand for safe haven assets. This is the reason why gold has dropped weaker on Fed statement and grown stronger on D. Trump speech.
Gold slipped to a two-week low on Thursday, a day after the U.S. Federal Reserve cut interest rates for the first time in a decade but dampened expectations of future rate reductions, which sent the dollar to a 26-month peak.
U.S. Fed Chairman Jerome Powell sent “mixed messages” with his forward guidance when he cut U.S. rates by 25 basis points, the first cut since the global financial crisis in 2008, FXTM analyst Lukman Otunuga said.
“The key takeaway that is causing gold to trade lower is that Powell said it’s not the beginning of a long series of rate cuts. Markets are now questioning whether it’s a one-and-done (step),” he added.
After the Fed comments, the dollar index rose to its highest since May 2017, making the non-yielding bullion expensive for holders of other currencies.
“The dollar has broken out on the charts and looks like it is going to push higher still, yet another reason to pursue caution when it comes to the long side in the precious group,” INTL FCStone analyst Edward Meir said in a note.
Lower interest rates and resurgent investor and central bank buying are expected to help gold prices cement recent gains and hold above $1,400 an ounce next year, a Reuters poll showed on Thursday.
“In the long term, gold is still supported even though the Fed may disappoint markets, other major central banks across the globe are expected to cut rates,” Otunuga said.
“Future rate cuts will be contingent on economic data from the United States and U.S.-China trade developments.”
“Even if gold were to come under further pressure as a result of a good U.S. labour market report ... , we would regard this as ‘merely’ a correction within an intact upswing,” Commerzbank analysts said in a note.
Rally on Gold market happened when U.S. President Donald Trump said he would impose additional tariffs on Chinese imports, renewing trade tensions between the two countries, dragging the dollar down from two-year highs and sending bond yields lower.
Trump said on Thursday he would impose an additional 10% tariff on $300 billion worth of Chinese imports starting Sept. 1, as talks aimed at easting tensions between the world’s two largest economies continue.
“Trump just came out and said he is announcing a 10% tariff on China that sunk the dollar index and brought some safe-haven demand for gold,” said Jim Wyckoff, senior analyst with Kitco Metals.
“Some people positioned for a more robust expression of dovishness from Fed and they didn’t get it. Gold responded to the fact that there is a lot of ambiguity now on how the Fed will tackle the monetary policy going forward,” said Bart Melek, head of commodity strategies at TD Securities in Toronto.
Trump also said if trade negotiations fail to progress he could raise tariffs further - even beyond the 25% levy he has already imposed on $250 billion of imports from China.
“Any escalation in Sino-U.S. trade tensions will likely trap the Federal Reserve on a dovish slope – reigniting market-implied rate cut pricing,” OCBC analysts said in a note.
The October Fed funds rate futures have jumped to now fully price in a rate cut in September, compared with only around 60% before the tariff announcement. Another 25 basis point move is priced in by December.
Meanwhile, holdings of SPDR Gold Trust, the world’s largest gold-backed exchange-traded fund, rose 0.53% to 827.82 tonnes on Thursday from on Wednesday.
Spot gold may retest a resistance at $1,449 per ounce, a break above which could lead to a gain into the range of $1,461-$1,474, said Reuters technical analyst Wang Tao.
“The trend in gold is up,” said Bob Haberkorn, senior market strategist at RJO Futures.
CFTC data shows that net long position stands at high levels around 250K contracts. This equals to the record of 2018, but still keeps some room till absolute number of 316K:

Source: cftc.gov
Charting by Investing.com
As we can see, the major driving factors are a bit different for FX market and for the Gold. If FX investors mostly watch for Fed statement, US interest rates decision and treat US-Sino piking as additional factor in favor of Fed dovish policy - Gold market mostly reacts on political background as "run into quality" effect could be much stronger compares to US interest rates.
But particular this moment makes overall situation tricky. Yesterday we already talked about it in our FX research. D. Trump already lays $250 Bln of Chinese export under tribute of 25% tax. And our question is - do you see some negative effect on US economy? Or maybe we see some collapse of USD as a result of this taxation? Nope. US statistics looks pretty nice. Maybe Fed has cut the rate immediately on tariffs imposing? "No" as well.
So, why then do you think that 10% over $300 Bln. will force Fed to cut the rate in September only because somebody thinks that this tariffs "theoretically" should hurt US economy in long-term perspective?
Fed has agreed on compromise in July, as single rate cut has no strong effect on economy in long-term. They satisfied the markets and use this rate cut to change rhetoric on the future. Hardly Fed will become a market's hostage for the second time.
Finally, recall our old talks about tariffs effect on US and China economy. Our stubborn position was in favor of US, as we think that tariffs will hurt China faster and stronger than US. For example, do you know, that bankruptcies in China private sector and defaults on corporate debt have increased many times?
Fathom consulting reports that The PBoC is absorbing bad debt onto its balance sheet
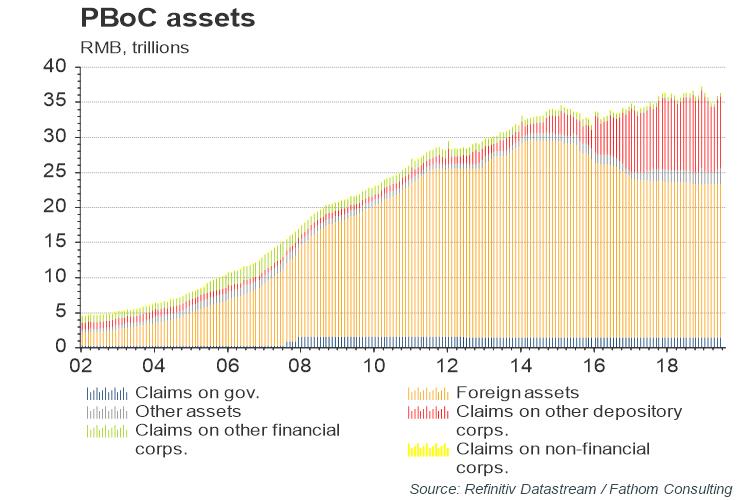
In response to rising financial stress in China — as evidenced by rising bond defaults, increasing numbers of non-performing loans and rumours of yet another bank bailout over the weekend — the People’s Bank of China has stepped into action.
Since 2016, when we believe policymakers threw in the towel on their half-hearted attempt to rebalance, instead doubling down on the increasingly inefficient old growth model, the stock of assets held by the PBoC against other depository corporations has almost quadrupled.
If such lending is done to encourage banks to purchase non-performing loans with an implicit understanding that the central bank will not demand repayment should the lender default, then this effectively writes off the bad debt.
The PBoC’s books balance as its assets simply switch from the original claim on the bank to ownership of the non-performing collateral. If we are right, and the PBoC is absorbing bad debt onto its balance sheet, then this could amount to as much as 8 trillion yuan and rising.
This is the reason why we think that it is too early to celebrate unstoppable Gold rally and free fall of Fed interest rates. In short-term perspective - September Fed statement could become the moment of big pain, screams and despair among most "hot head" investors. Our suggestion that there was a lot of emotions in recent reaction on D. Trump statement rather than common sense.
Technical
Monthly
Monthly trend stands bullish. Market confidently stands above YPR1 and natural former resistance area of 1380. This confirms that bullish sentiment is still valid. August stands as inside month by far and reaction on our OP target looks too small for monthly scale.
Technically, the reason of shy reaction on OP target could be the acceleration to the target, as almost the whole way was passed just in one month.This could have some consequences. First is, our retracement could be smaller, second - market should proceed higher, at least to 1.618 butterfly target @ 1530$.
Still, as we have not just butterfly but OP as well, we still watch for retracement, at least until clear signs of upside breakout will appear.
Next two upside targets - 1530$ of 1.618 butterfly extension and 1655 as XOP target of the same major AB=CD pattern.
So, monthly time frame shows that long-term bullish context still stands intact.

Weekly
On weekly chart we have some details that could change short term market behavior. Precisely speaking, reaction on monthly OP could be different. Weekly Overbought level now stands around 1480, which lets market to flirt with 1450 target and gives room to breath.
Second, last week has become bullish reversal one as price has formed new lows but closed above the top of previous week. Reversal candles as a rule have some continuation. MACD trend stands bullish here as well.
It means that market before major reaction on OP target could hit some short-term near-stand upside targets. Hence, we need to keep an eye on reversal pattern which includes some upside continuation. This is for the case if monthly OP reaction will start indeed:

Conversely, in a case of real upside breakout of 1450 level and upside continuation.. we can't exclude it totally. In fact, weekly consolidation looks like flag pattern. We need to be careful to any signs on lower time frame, trying to understand what scenario market is following to.
Daily
Trying to combine all things that we know, as technical, as fundamental, we come to the following result - possible 3-Drive "Sell" pattern on daily. By recent action market has shown no support to idea of possible H&S pattern or deeper AB=CD retracement. Thursday session also has become a reversal one.
Also here we have clear signs of bullish dynamic pressure. MACD trend points down, while price forms higher lows and higher tops. Daily trend has turned bullish as well. Overbought level here stands at 1466, but it will increase when gold starts climbing higher.
Thus, it seems that we should get another upside swing to 1467-1475 level before situation could change.

Intraday
4H chart shows that gold stands in upside channel. As we've come to conclusion that we have bullish short-term context, we need retracement for position taking. There are two ways possible here. First is - reaching of the channel's border first and retracement second, or - minor retracement before upside continuation:

The channel's border stands around 1458 level. Here, on 1H chart market has formed "222" Sell pattern. If we get lucky, we would get AB-CD downside action to 1430 K-support area. Chances to get XOP downside action to 1418 Fib support looks phantom.
Otherwise, it could minor retracement and gold forms upside butterfly with 1.618 extension right around 1459 level. In this case we will watch for retracement after butterfly will be formed, following the 1st scenario that we've mentioned on 4H chart.

Conclusion
Fundamental and technical analysis shows that gold keeps long-term bullish sentiment. Now we have to adjust our expectation and change the pattern that should trigger downside retracement that we're waiting for. Yes, we still expect technical respect of major target but change the pattern which could trigger it.
Real upside breakout of 1450 target is also possible, but it demands for additional strong fundamental driving factors, such as reciprocal measures from China and we treat this scenario as less probable by far.
The technical portion of Sive's analysis owes a great deal to Joe DiNapoli's methods, and uses a number of Joe's proprietary indicators. Please note that Sive's analysis is his own view of the market and is not endorsed by Joe DiNapoli or any related companies.
In general gold has the same driving factors this week as FX market, but it shows a bit different reaction because of political component. For instance, FX market under recent D. Trump statement sees only softer USD, while for gold market this is also political risks and demand for safe haven assets. This is the reason why gold has dropped weaker on Fed statement and grown stronger on D. Trump speech.
Gold slipped to a two-week low on Thursday, a day after the U.S. Federal Reserve cut interest rates for the first time in a decade but dampened expectations of future rate reductions, which sent the dollar to a 26-month peak.
U.S. Fed Chairman Jerome Powell sent “mixed messages” with his forward guidance when he cut U.S. rates by 25 basis points, the first cut since the global financial crisis in 2008, FXTM analyst Lukman Otunuga said.
“The key takeaway that is causing gold to trade lower is that Powell said it’s not the beginning of a long series of rate cuts. Markets are now questioning whether it’s a one-and-done (step),” he added.
After the Fed comments, the dollar index rose to its highest since May 2017, making the non-yielding bullion expensive for holders of other currencies.
“The dollar has broken out on the charts and looks like it is going to push higher still, yet another reason to pursue caution when it comes to the long side in the precious group,” INTL FCStone analyst Edward Meir said in a note.
Lower interest rates and resurgent investor and central bank buying are expected to help gold prices cement recent gains and hold above $1,400 an ounce next year, a Reuters poll showed on Thursday.
“In the long term, gold is still supported even though the Fed may disappoint markets, other major central banks across the globe are expected to cut rates,” Otunuga said.
“Future rate cuts will be contingent on economic data from the United States and U.S.-China trade developments.”
“Even if gold were to come under further pressure as a result of a good U.S. labour market report ... , we would regard this as ‘merely’ a correction within an intact upswing,” Commerzbank analysts said in a note.
Rally on Gold market happened when U.S. President Donald Trump said he would impose additional tariffs on Chinese imports, renewing trade tensions between the two countries, dragging the dollar down from two-year highs and sending bond yields lower.
Trump said on Thursday he would impose an additional 10% tariff on $300 billion worth of Chinese imports starting Sept. 1, as talks aimed at easting tensions between the world’s two largest economies continue.
“Trump just came out and said he is announcing a 10% tariff on China that sunk the dollar index and brought some safe-haven demand for gold,” said Jim Wyckoff, senior analyst with Kitco Metals.
“Some people positioned for a more robust expression of dovishness from Fed and they didn’t get it. Gold responded to the fact that there is a lot of ambiguity now on how the Fed will tackle the monetary policy going forward,” said Bart Melek, head of commodity strategies at TD Securities in Toronto.
Trump also said if trade negotiations fail to progress he could raise tariffs further - even beyond the 25% levy he has already imposed on $250 billion of imports from China.
“Any escalation in Sino-U.S. trade tensions will likely trap the Federal Reserve on a dovish slope – reigniting market-implied rate cut pricing,” OCBC analysts said in a note.
The October Fed funds rate futures have jumped to now fully price in a rate cut in September, compared with only around 60% before the tariff announcement. Another 25 basis point move is priced in by December.
Meanwhile, holdings of SPDR Gold Trust, the world’s largest gold-backed exchange-traded fund, rose 0.53% to 827.82 tonnes on Thursday from on Wednesday.
Spot gold may retest a resistance at $1,449 per ounce, a break above which could lead to a gain into the range of $1,461-$1,474, said Reuters technical analyst Wang Tao.
“The trend in gold is up,” said Bob Haberkorn, senior market strategist at RJO Futures.
CFTC data shows that net long position stands at high levels around 250K contracts. This equals to the record of 2018, but still keeps some room till absolute number of 316K:
Source: cftc.gov
Charting by Investing.com
As we can see, the major driving factors are a bit different for FX market and for the Gold. If FX investors mostly watch for Fed statement, US interest rates decision and treat US-Sino piking as additional factor in favor of Fed dovish policy - Gold market mostly reacts on political background as "run into quality" effect could be much stronger compares to US interest rates.
But particular this moment makes overall situation tricky. Yesterday we already talked about it in our FX research. D. Trump already lays $250 Bln of Chinese export under tribute of 25% tax. And our question is - do you see some negative effect on US economy? Or maybe we see some collapse of USD as a result of this taxation? Nope. US statistics looks pretty nice. Maybe Fed has cut the rate immediately on tariffs imposing? "No" as well.
So, why then do you think that 10% over $300 Bln. will force Fed to cut the rate in September only because somebody thinks that this tariffs "theoretically" should hurt US economy in long-term perspective?
Fed has agreed on compromise in July, as single rate cut has no strong effect on economy in long-term. They satisfied the markets and use this rate cut to change rhetoric on the future. Hardly Fed will become a market's hostage for the second time.
Finally, recall our old talks about tariffs effect on US and China economy. Our stubborn position was in favor of US, as we think that tariffs will hurt China faster and stronger than US. For example, do you know, that bankruptcies in China private sector and defaults on corporate debt have increased many times?
Fathom consulting reports that The PBoC is absorbing bad debt onto its balance sheet
In response to rising financial stress in China — as evidenced by rising bond defaults, increasing numbers of non-performing loans and rumours of yet another bank bailout over the weekend — the People’s Bank of China has stepped into action.
Since 2016, when we believe policymakers threw in the towel on their half-hearted attempt to rebalance, instead doubling down on the increasingly inefficient old growth model, the stock of assets held by the PBoC against other depository corporations has almost quadrupled.
If such lending is done to encourage banks to purchase non-performing loans with an implicit understanding that the central bank will not demand repayment should the lender default, then this effectively writes off the bad debt.
The PBoC’s books balance as its assets simply switch from the original claim on the bank to ownership of the non-performing collateral. If we are right, and the PBoC is absorbing bad debt onto its balance sheet, then this could amount to as much as 8 trillion yuan and rising.
This is the reason why we think that it is too early to celebrate unstoppable Gold rally and free fall of Fed interest rates. In short-term perspective - September Fed statement could become the moment of big pain, screams and despair among most "hot head" investors. Our suggestion that there was a lot of emotions in recent reaction on D. Trump statement rather than common sense.
Technical
Monthly
Monthly trend stands bullish. Market confidently stands above YPR1 and natural former resistance area of 1380. This confirms that bullish sentiment is still valid. August stands as inside month by far and reaction on our OP target looks too small for monthly scale.
Technically, the reason of shy reaction on OP target could be the acceleration to the target, as almost the whole way was passed just in one month.This could have some consequences. First is, our retracement could be smaller, second - market should proceed higher, at least to 1.618 butterfly target @ 1530$.
Still, as we have not just butterfly but OP as well, we still watch for retracement, at least until clear signs of upside breakout will appear.
Next two upside targets - 1530$ of 1.618 butterfly extension and 1655 as XOP target of the same major AB=CD pattern.
So, monthly time frame shows that long-term bullish context still stands intact.
Weekly
On weekly chart we have some details that could change short term market behavior. Precisely speaking, reaction on monthly OP could be different. Weekly Overbought level now stands around 1480, which lets market to flirt with 1450 target and gives room to breath.
Second, last week has become bullish reversal one as price has formed new lows but closed above the top of previous week. Reversal candles as a rule have some continuation. MACD trend stands bullish here as well.
It means that market before major reaction on OP target could hit some short-term near-stand upside targets. Hence, we need to keep an eye on reversal pattern which includes some upside continuation. This is for the case if monthly OP reaction will start indeed:
Conversely, in a case of real upside breakout of 1450 level and upside continuation.. we can't exclude it totally. In fact, weekly consolidation looks like flag pattern. We need to be careful to any signs on lower time frame, trying to understand what scenario market is following to.
Daily
Trying to combine all things that we know, as technical, as fundamental, we come to the following result - possible 3-Drive "Sell" pattern on daily. By recent action market has shown no support to idea of possible H&S pattern or deeper AB=CD retracement. Thursday session also has become a reversal one.
Also here we have clear signs of bullish dynamic pressure. MACD trend points down, while price forms higher lows and higher tops. Daily trend has turned bullish as well. Overbought level here stands at 1466, but it will increase when gold starts climbing higher.
Thus, it seems that we should get another upside swing to 1467-1475 level before situation could change.
Intraday
4H chart shows that gold stands in upside channel. As we've come to conclusion that we have bullish short-term context, we need retracement for position taking. There are two ways possible here. First is - reaching of the channel's border first and retracement second, or - minor retracement before upside continuation:
The channel's border stands around 1458 level. Here, on 1H chart market has formed "222" Sell pattern. If we get lucky, we would get AB-CD downside action to 1430 K-support area. Chances to get XOP downside action to 1418 Fib support looks phantom.
Otherwise, it could minor retracement and gold forms upside butterfly with 1.618 extension right around 1459 level. In this case we will watch for retracement after butterfly will be formed, following the 1st scenario that we've mentioned on 4H chart.
Conclusion
Fundamental and technical analysis shows that gold keeps long-term bullish sentiment. Now we have to adjust our expectation and change the pattern that should trigger downside retracement that we're waiting for. Yes, we still expect technical respect of major target but change the pattern which could trigger it.
Real upside breakout of 1450 target is also possible, but it demands for additional strong fundamental driving factors, such as reciprocal measures from China and we treat this scenario as less probable by far.
The technical portion of Sive's analysis owes a great deal to Joe DiNapoli's methods, and uses a number of Joe's proprietary indicators. Please note that Sive's analysis is his own view of the market and is not endorsed by Joe DiNapoli or any related companies.
")