Sive Morten
Special Consultant to the FPA
- Messages
- 18,673
Fundamentals
Weekly Gold Tading Report prepared by Sive Morten exclusively for ForexPeaceArmy.com
Reuters reports Gold rose on Friday as investors assessed U.S. non-farm payrolls data that may indicate the Federal Reserve will delay an immediate interest rate hike, but was still on course for a weekly fall.
Nonfarm payrolls increased 215,000 last month as a pickup in construction and manufacturing employment offset further declines in the mining sector, the Labor Department said on Friday. The unemployment rate held at a seven-year low of 5.3 percent.
"The trade is still speculating that this is still going to be a more protracted process than had been anticipated," said Eli Tesfaye, senior market strategist for brokerage RJO Futures in Chicago, calling the report "not overly positive" for economic conditions and more on the neutral side.
Analysts continued to see gold's upside as temporary, due to strong prospects for the dollar as investors position themselves for an interest rate increase in the United States this year.
Higher interest rates would put non-yield-bearing gold under further pressure, increasing the opportunity cost of holding the metal.
A slew of upbeat U.S. economic data, including Thursday's positive weekly jobless claims, shows "there's not really much to stop the Fed from increasing rates", said Ric Spooner, chief market analyst at CMC Markets in Sydney.
"There's not a lot of natural reasons for investors to buy gold at the moment. The dollar is getting stronger and there's no real sign of inflation on the horizon with weaker oil prices and other commodities," Spooner said.
Guys we suggest you to read the fundamental part in our EUR research that was published yesterday, since gold has similar reaction on NFP data. From one point of view this could mean nothing but possible postponing of first rate hike on October or December as it was said above.
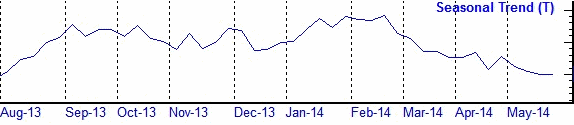
From other point of view (and we think it is closer to reality) markets could treat coming rate hike as “done thing” and start to look over horizon, beyond it. And at the end of the August seasonal trend will shift bullish (see chart below) and hardly we will get tightening rate cycle. Probably this will be isolated issue. This could be the reason why gold has risen despite NFP data mostly was positive.
Recent CFTC data does not bring us any clarity, since as open interest as investors positions barely has changed. Recent couple of months was really tough ones for gold market and it seems that investors have taken some pause to re-assess current situation. So, again we will have to rely on technical issues.
Here is detailed breakdown of speculative positions:
Open interest:
 Shorts:
 Longs:
 Summary:
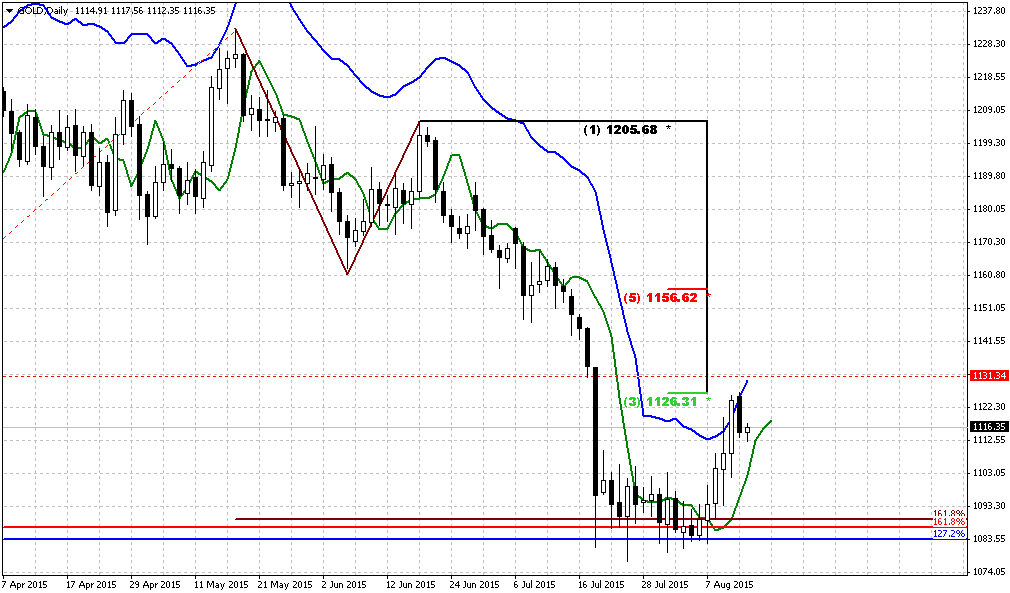
Technicals
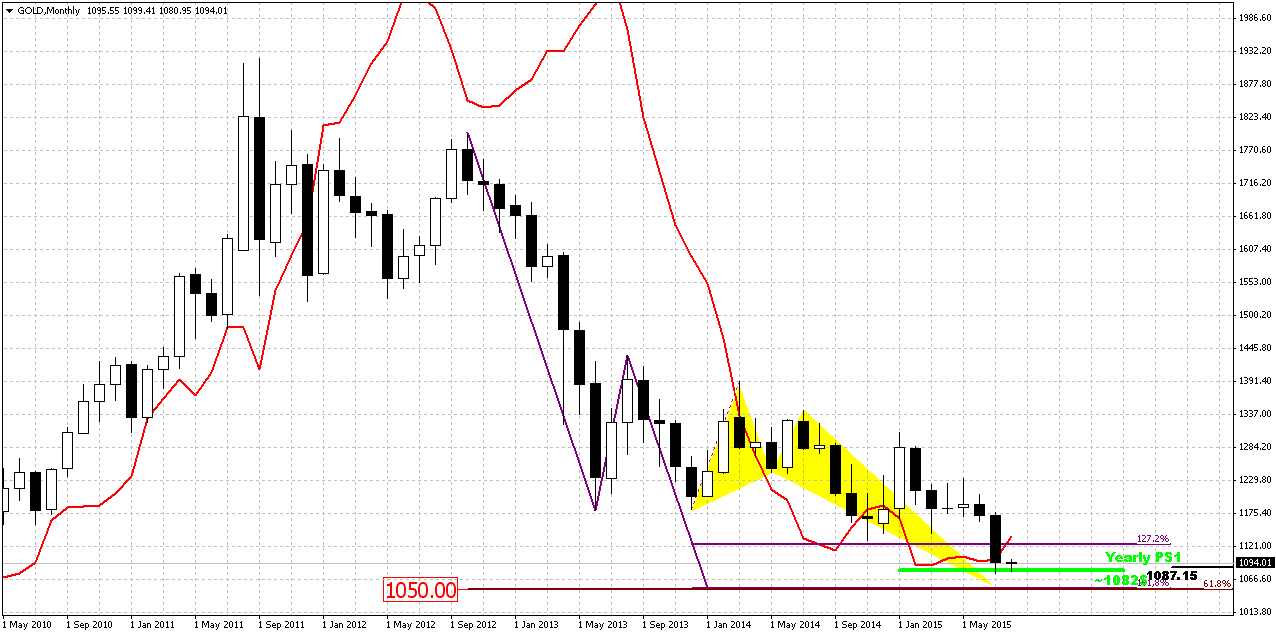
Monthly
Last week market has closed just 1$ higher than on previous one. So picture on monthly chart has not changed. August candle is still very small to make any impact on overall picture.
So, now we have just one long-term pattern in progress that has not achieved it’s target yet. This is VOB pattern. It suggests at least 0.618 AB-CD down. And this target is 1050$.
We also have got completed pivot points framework target. Again it has confirmed its reliability. Once we’ve said that in the beginning of the year market showed solid upside action. Gold was able to exceed yearly pivot, passed half way to Yearly Pivot resistance 1 but right now has reversed down and closed below YPP. From technical point of view this is bearish sign and market has hit next destination point of this analysis –yearly pivot support 1 around 1083$.
Since long time frames has not changed significantly, our major task for coming week will be to understand what chances exist that market will drop lower. Or at least find something important that could give us early signs of possible downward breakout or vice versa – upside deeper retracement. All these stuff will be mostly tactical since it stand on daily and lower charts.
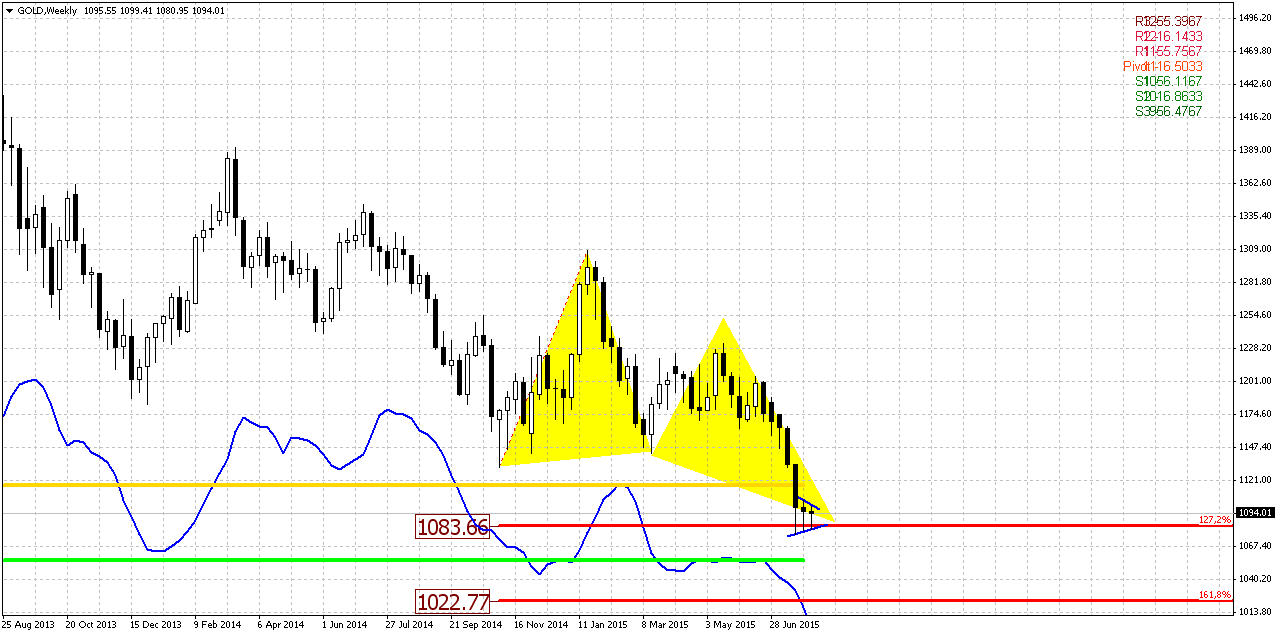
Weekly
Last week gold again has formed inside candle. Trend is bearish here. Weekly setup has worked at 100%. Market has hit 1080 target. Still this is just first destination of butterfly – 1.27 extension. As we see acceleration right this level, there are big chances that market will go to next one – 1.618 around 1025 area. Other bearish signs that we have – price stands below MPP and three weeks consolidation more and more reminds bearish pennant.
At the same time, as market right now stands at strong support, chances on short-term upside bounce still exist.
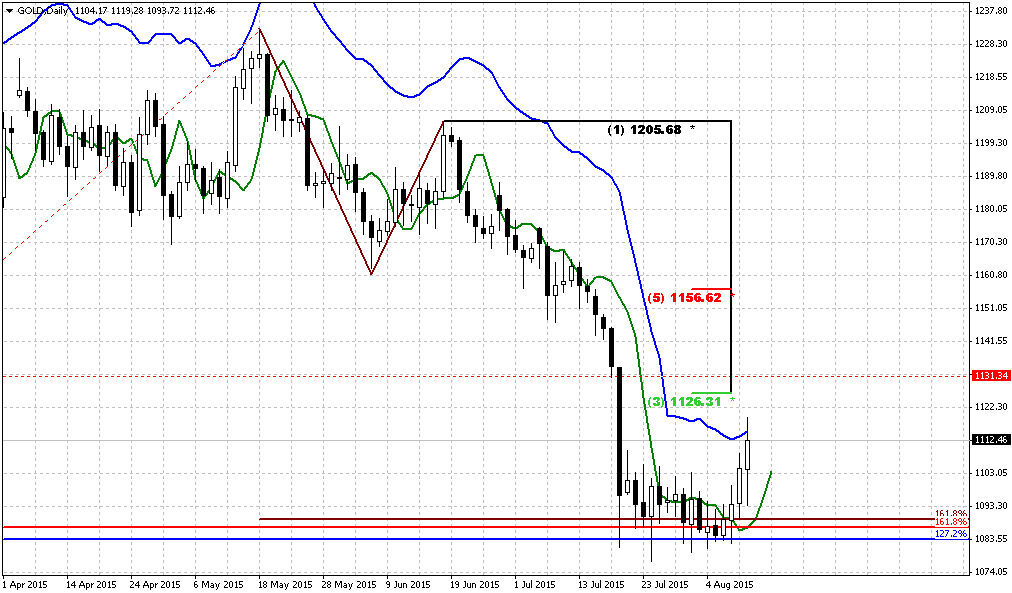
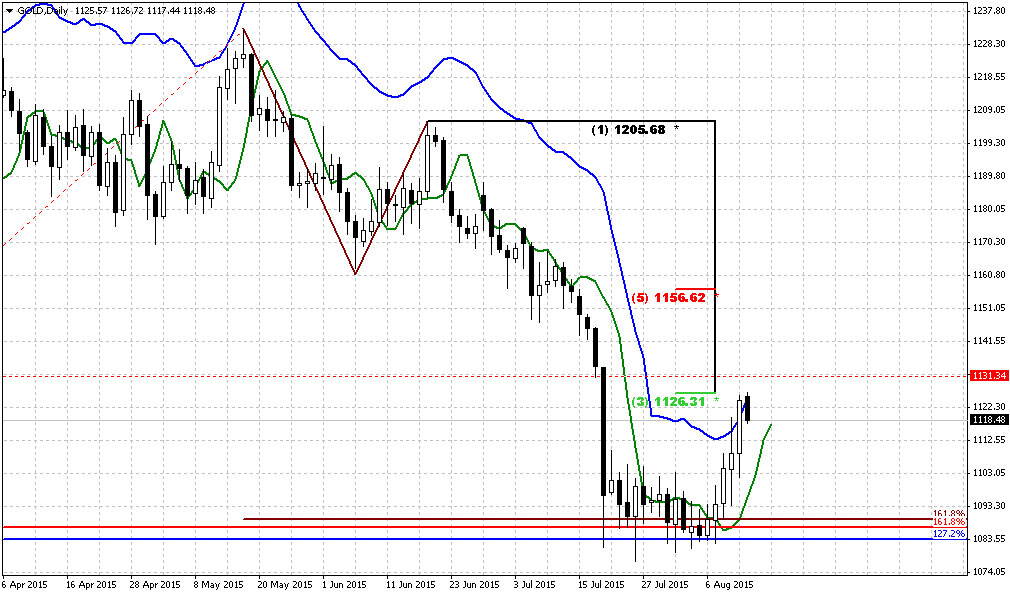
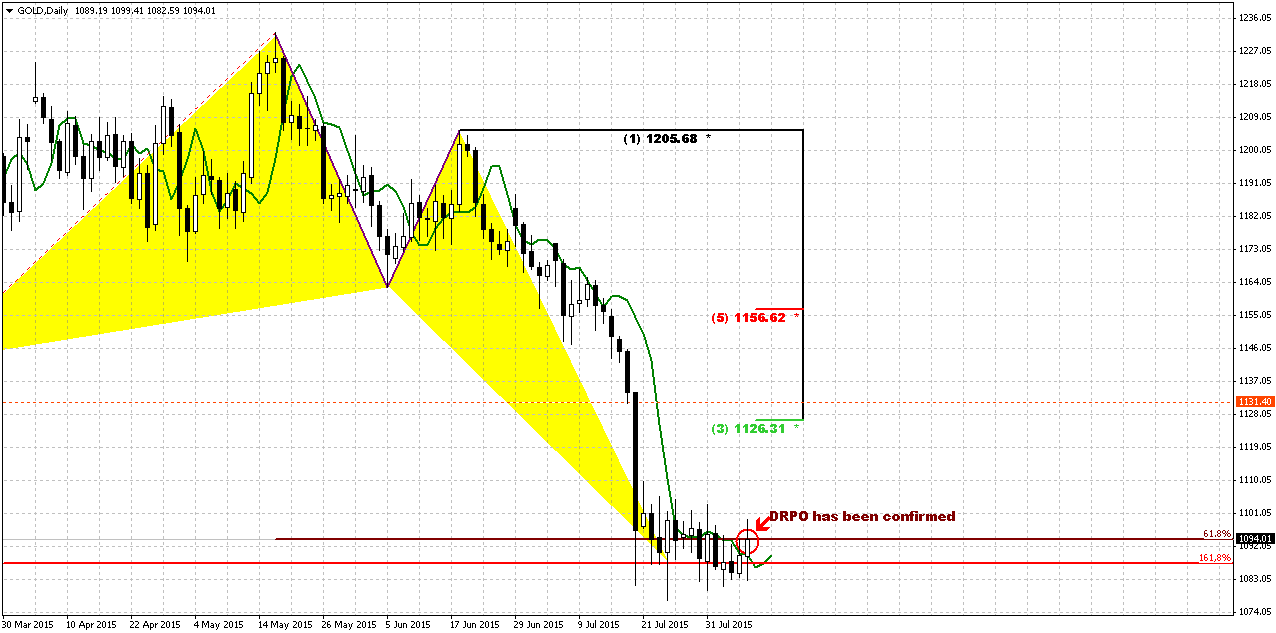
Daily
Daily chart again provides major information for short-term trading. 1080 level, as we’ve mentioned many times, was oversold, is butterfly and inner AB-CD 1.618 targets. Also this is YPS1. So, as a result we have impressive gathering of supports of different kind. We expect that gold could re-test previously broken important 1130 lows. As we’ve said recently we should watching for some DiNapoli directional pattern and shape of DRPO “Buy” is becoming brighter as time is passing by. Finally on Friday DRPO “Buy” pattern has been confirmed. This pattern is important for us by two reasons. First is, DRPO is isolated trading setup, pattern. Second – this is indicator. If it will fail and we will get DRPO “Failure”, that is also directional pattern, we will get clear sign of further downward continuation.
So, short-term conclusion – it is too early to go short, since market at strong support and oversold and we’ve got bullish directional pattern. If DRPO will not fail – gold probably will hit predefined 1126-1130 level. Speaking about the shape of DRPO, it is not perfect of cause. Bottom is flat, while we prefer to see clear two well-recognizable spikes down. They indicate inability of bears to continue move down, a kind of capitulation. But may be flat bottom was formed due strong support area. Anyway, let’s see what will happen with this DRPO. Finally we’ve got the major thing – the pattern, and soon should get the direction, depending on how market will work with DRPO.
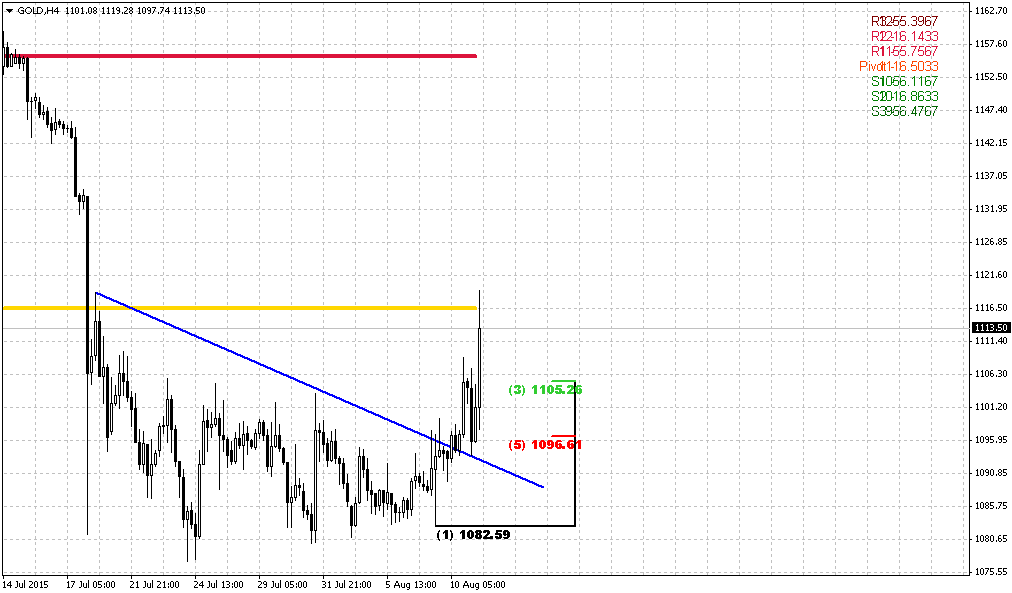
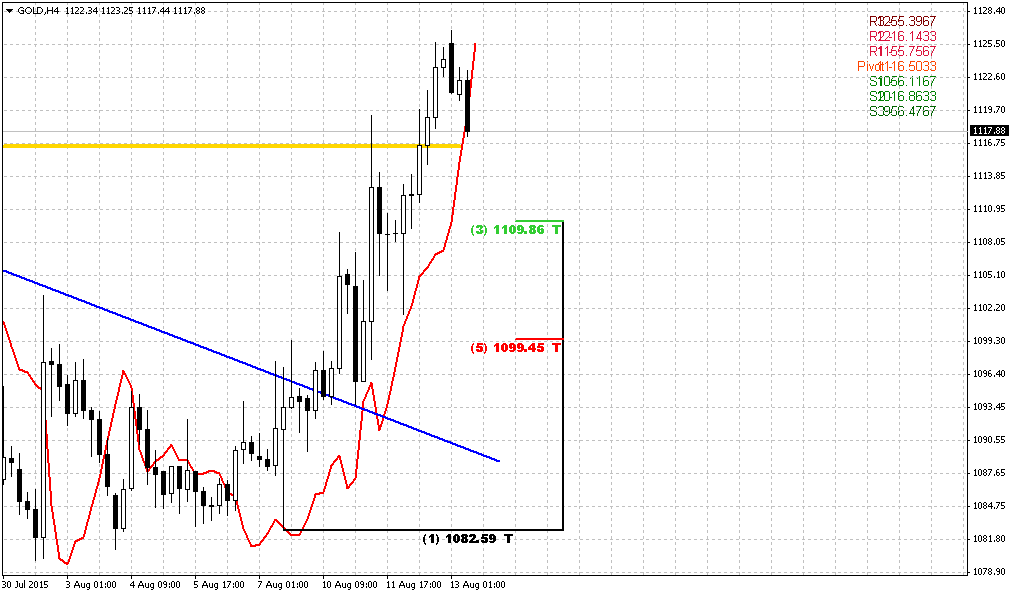
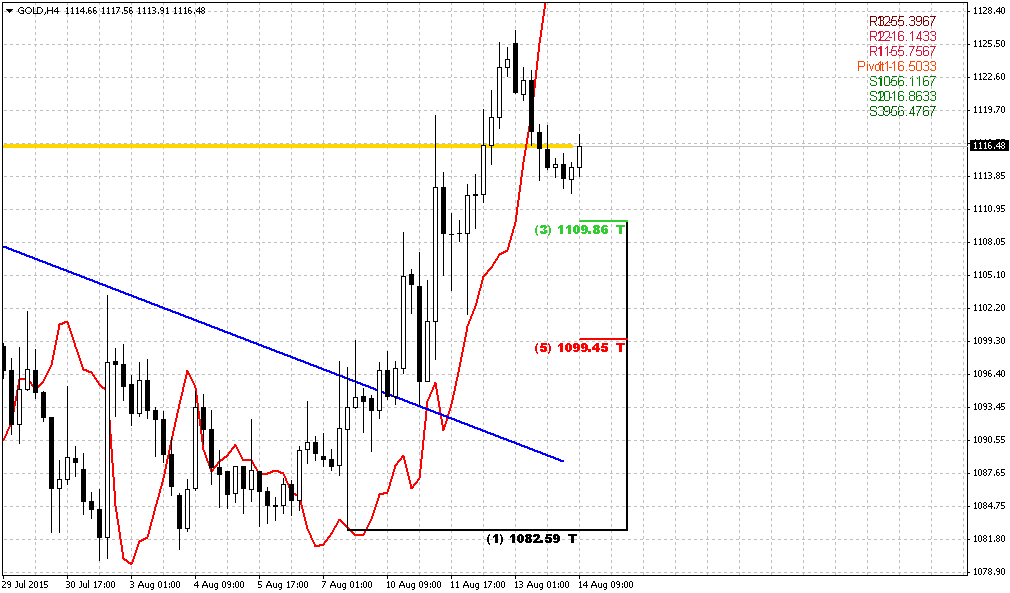
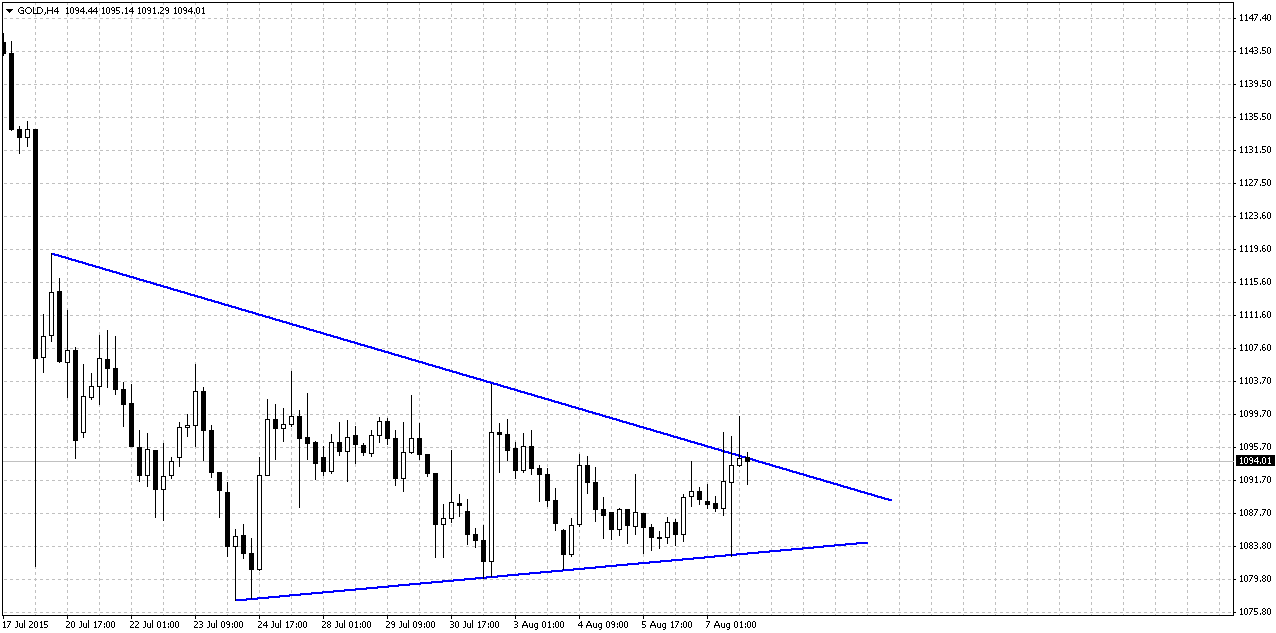
4-hour
Now we need to combine other patterns that we have with daily DRPO pattern. Thus, on 4-hour chart trend is bullish and we have triangle pattern. On Monday probably the most important thing should happen, i.e. breakout, or – its failure. Gold right now stands around resistance trend line. Upside breakout will increase chances that DRPO will work.
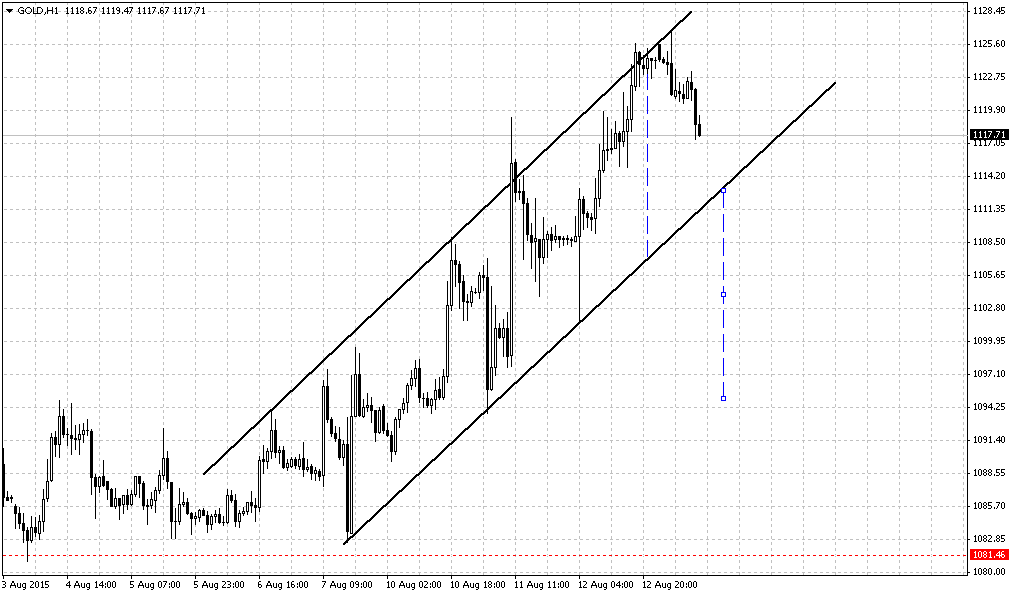
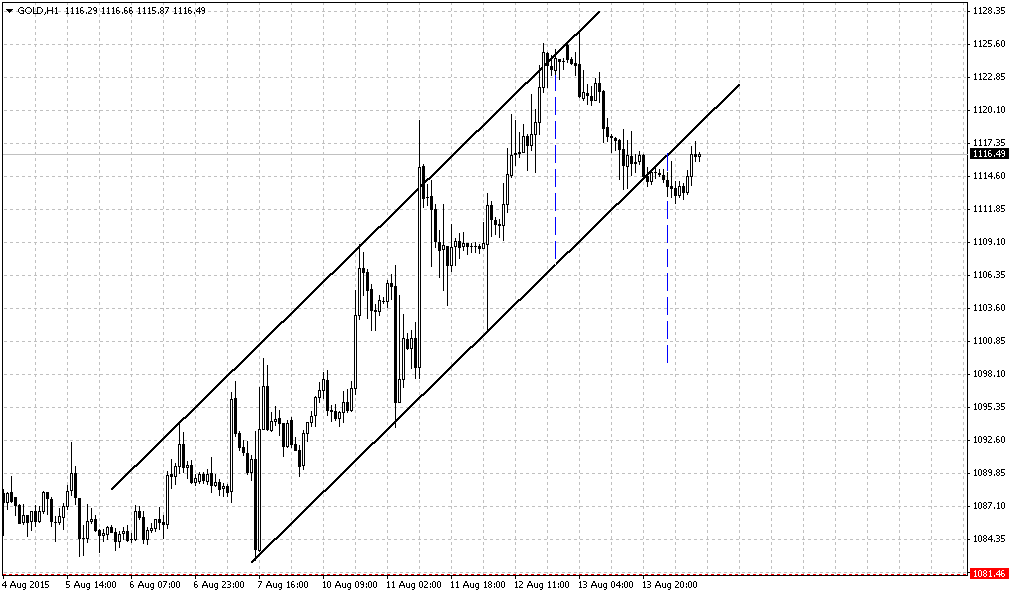
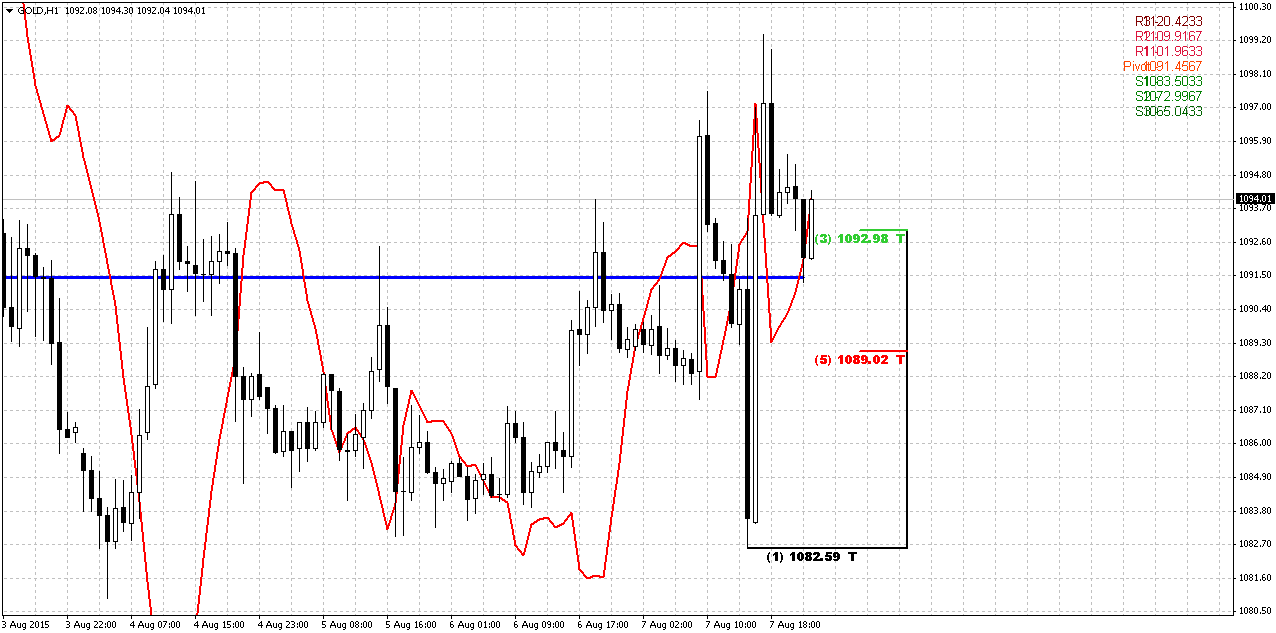
1-hour
Hourly chart shows market reaction on NFP release. Since gold has hit trend line resistance, it already has shown 3/8 retracement. Here guys, we do not want to see too deep retracement down, because if market will break 5/8 Fib support it will increase hazard of closing below 3x3 on daily chart and DRPO failure. Here have bullish stop grabber that theoretically assumes upside breakout. So, if you’re thinking about long position on gold market, it makes sense to think on Fib levels. An area below 1089 Fib support, will be let’s call it “zone of risk” where chances of DRPO failure will increase. And if gold will drop there – do not take long position. Besides, in this case gold also will be below WPP.
That’s being said perfect bullish scenario suggests that gold will hold above WPP and grabber will work.
Conclusion:
Long-term picture remains bearish and we do not see any serious headwinds for further downward continuation. 1050 is probably nearest perspective that we could imagine, because gold really could drop even lower.
On short-term charts market stands at strong support that could launch short-term technical bounce to 1130 area. Daily traders should monitor daily DRPO “Buy” pattern.
The technical portion of Sive's analysis owes a great deal to Joe DiNapoli's methods, and uses a number of Joe's proprietary indicators. Please note that Sive's analysis is his own view of the market and is not endorsed by Joe DiNapoli or any related companies.
Weekly Gold Tading Report prepared by Sive Morten exclusively for ForexPeaceArmy.com
Reuters reports Gold rose on Friday as investors assessed U.S. non-farm payrolls data that may indicate the Federal Reserve will delay an immediate interest rate hike, but was still on course for a weekly fall.
Nonfarm payrolls increased 215,000 last month as a pickup in construction and manufacturing employment offset further declines in the mining sector, the Labor Department said on Friday. The unemployment rate held at a seven-year low of 5.3 percent.
"The trade is still speculating that this is still going to be a more protracted process than had been anticipated," said Eli Tesfaye, senior market strategist for brokerage RJO Futures in Chicago, calling the report "not overly positive" for economic conditions and more on the neutral side.
Analysts continued to see gold's upside as temporary, due to strong prospects for the dollar as investors position themselves for an interest rate increase in the United States this year.
Higher interest rates would put non-yield-bearing gold under further pressure, increasing the opportunity cost of holding the metal.
A slew of upbeat U.S. economic data, including Thursday's positive weekly jobless claims, shows "there's not really much to stop the Fed from increasing rates", said Ric Spooner, chief market analyst at CMC Markets in Sydney.
"There's not a lot of natural reasons for investors to buy gold at the moment. The dollar is getting stronger and there's no real sign of inflation on the horizon with weaker oil prices and other commodities," Spooner said.
Guys we suggest you to read the fundamental part in our EUR research that was published yesterday, since gold has similar reaction on NFP data. From one point of view this could mean nothing but possible postponing of first rate hike on October or December as it was said above.
From other point of view (and we think it is closer to reality) markets could treat coming rate hike as “done thing” and start to look over horizon, beyond it. And at the end of the August seasonal trend will shift bullish (see chart below) and hardly we will get tightening rate cycle. Probably this will be isolated issue. This could be the reason why gold has risen despite NFP data mostly was positive.
Recent CFTC data does not bring us any clarity, since as open interest as investors positions barely has changed. Recent couple of months was really tough ones for gold market and it seems that investors have taken some pause to re-assess current situation. So, again we will have to rely on technical issues.
Here is detailed breakdown of speculative positions:
Open interest:
Technicals
Monthly
Last week market has closed just 1$ higher than on previous one. So picture on monthly chart has not changed. August candle is still very small to make any impact on overall picture.
So, now we have just one long-term pattern in progress that has not achieved it’s target yet. This is VOB pattern. It suggests at least 0.618 AB-CD down. And this target is 1050$.
We also have got completed pivot points framework target. Again it has confirmed its reliability. Once we’ve said that in the beginning of the year market showed solid upside action. Gold was able to exceed yearly pivot, passed half way to Yearly Pivot resistance 1 but right now has reversed down and closed below YPP. From technical point of view this is bearish sign and market has hit next destination point of this analysis –yearly pivot support 1 around 1083$.
Since long time frames has not changed significantly, our major task for coming week will be to understand what chances exist that market will drop lower. Or at least find something important that could give us early signs of possible downward breakout or vice versa – upside deeper retracement. All these stuff will be mostly tactical since it stand on daily and lower charts.
Weekly
Last week gold again has formed inside candle. Trend is bearish here. Weekly setup has worked at 100%. Market has hit 1080 target. Still this is just first destination of butterfly – 1.27 extension. As we see acceleration right this level, there are big chances that market will go to next one – 1.618 around 1025 area. Other bearish signs that we have – price stands below MPP and three weeks consolidation more and more reminds bearish pennant.
At the same time, as market right now stands at strong support, chances on short-term upside bounce still exist.
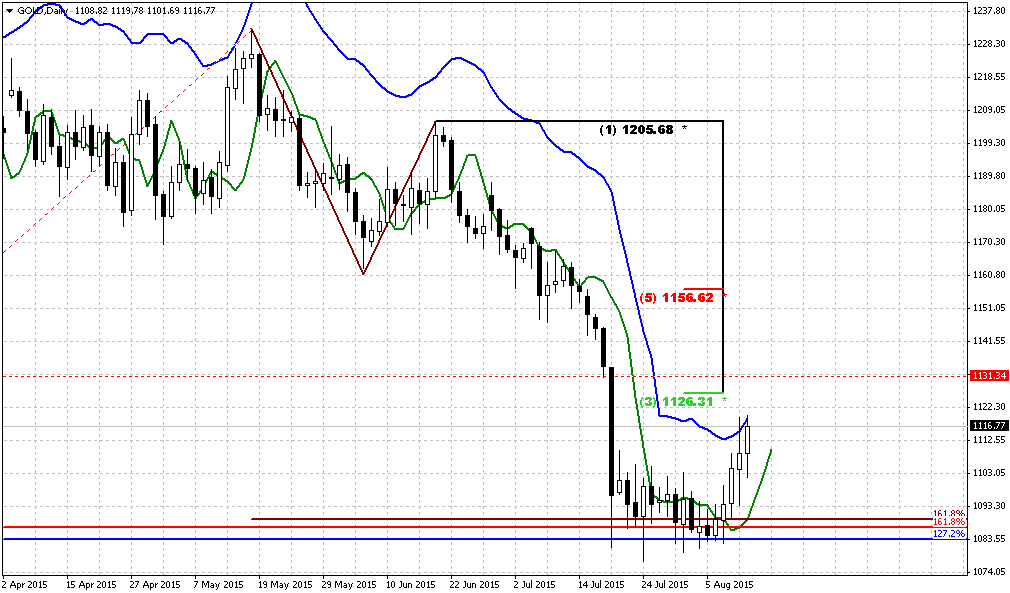
Daily
Daily chart again provides major information for short-term trading. 1080 level, as we’ve mentioned many times, was oversold, is butterfly and inner AB-CD 1.618 targets. Also this is YPS1. So, as a result we have impressive gathering of supports of different kind. We expect that gold could re-test previously broken important 1130 lows. As we’ve said recently we should watching for some DiNapoli directional pattern and shape of DRPO “Buy” is becoming brighter as time is passing by. Finally on Friday DRPO “Buy” pattern has been confirmed. This pattern is important for us by two reasons. First is, DRPO is isolated trading setup, pattern. Second – this is indicator. If it will fail and we will get DRPO “Failure”, that is also directional pattern, we will get clear sign of further downward continuation.
So, short-term conclusion – it is too early to go short, since market at strong support and oversold and we’ve got bullish directional pattern. If DRPO will not fail – gold probably will hit predefined 1126-1130 level. Speaking about the shape of DRPO, it is not perfect of cause. Bottom is flat, while we prefer to see clear two well-recognizable spikes down. They indicate inability of bears to continue move down, a kind of capitulation. But may be flat bottom was formed due strong support area. Anyway, let’s see what will happen with this DRPO. Finally we’ve got the major thing – the pattern, and soon should get the direction, depending on how market will work with DRPO.
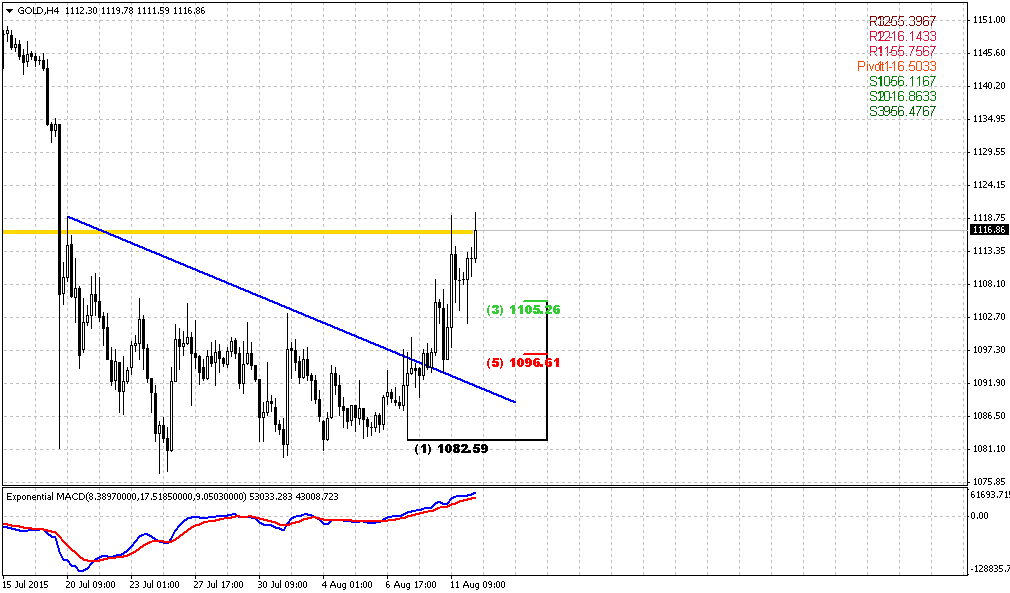
4-hour
Now we need to combine other patterns that we have with daily DRPO pattern. Thus, on 4-hour chart trend is bullish and we have triangle pattern. On Monday probably the most important thing should happen, i.e. breakout, or – its failure. Gold right now stands around resistance trend line. Upside breakout will increase chances that DRPO will work.
1-hour
Hourly chart shows market reaction on NFP release. Since gold has hit trend line resistance, it already has shown 3/8 retracement. Here guys, we do not want to see too deep retracement down, because if market will break 5/8 Fib support it will increase hazard of closing below 3x3 on daily chart and DRPO failure. Here have bullish stop grabber that theoretically assumes upside breakout. So, if you’re thinking about long position on gold market, it makes sense to think on Fib levels. An area below 1089 Fib support, will be let’s call it “zone of risk” where chances of DRPO failure will increase. And if gold will drop there – do not take long position. Besides, in this case gold also will be below WPP.
That’s being said perfect bullish scenario suggests that gold will hold above WPP and grabber will work.
Conclusion:
Long-term picture remains bearish and we do not see any serious headwinds for further downward continuation. 1050 is probably nearest perspective that we could imagine, because gold really could drop even lower.
On short-term charts market stands at strong support that could launch short-term technical bounce to 1130 area. Daily traders should monitor daily DRPO “Buy” pattern.
The technical portion of Sive's analysis owes a great deal to Joe DiNapoli's methods, and uses a number of Joe's proprietary indicators. Please note that Sive's analysis is his own view of the market and is not endorsed by Joe DiNapoli or any related companies.