Sive Morten
Special Consultant to the FPA
- Messages
- 18,659
Fundamentals
This week has become just a continuation of previous one - the same driving factors, the same expectations. Gold also, as other markets across the board was watching for JPowell speech and recent D. Trump comments on China tariffs.
As Reuters reports - Gold surged 2% on Friday as investors interpreted U.S. Federal Reserve Chair Jerome Powell’s speech as leaning toward a dovish monetary policy stance and President Donald Trump’s latest comments exacerbated trade tensions with China.
“The fact that he (Powell) said that they (the Fed) will act appropriately to sustain expansion is pretty bullish for gold. The two primary tools they have are quantitative easing (QE) or lower rates - both those tools will cause gold to go higher,” said Bob Haberkorn, senior market strategist at RJO Futures.
“The move this morning is just more people buying gold simply with the expectations that interest rates will be lower by year-end.”
Powell said the U.S. economy is in a “favorable place,” but gave few clues about interest rate cuts at its next meeting. However, he listed a series of economic and geopolitical risks the Fed is monitoring, noting these were linked to the trade spat.
“We shouldn’t be surprised if we see the Fed deliver a full percentage point in rate cuts over the next 12 months and a new QE program as we may only need a couple of the following macro events to blow up: trade uncertainties, weakness in China and Germany, Brexit, Hong Kong, and the dissolution of the Italian government,” Edward Moya, a senior market analyst at OANDA, said in a note.
Powell’s speech prompted a backlash from Trump on Twitter, asking whether the Fed chair was a greater “enemy” than China’s leader Xi Jinping.
Trump also ratcheted up the rhetoric on China, ordering U.S. companies to look at ways to close operations in the country, which sent equities tumbling and drove further inflows into safe-haven gold.
This came after China unveiled retaliatory tariffs against about $75 billion worth of U.S. goods.
“This means there is no resolution, the escalation continues. Investors are selling the risk and buying gold,” said SP Angel analyst Sergey Raevskiy.
Gold has risen nearly 8% so far this month and about 19% this year, and was set for a fourth straight week of gains.
Yesterday we've talked a lot about new Fed policy and its major objects in our FX research. As we've come to conclusion that Fed policy is not about new dovish cycle against recession but supportive measure to keep US economy moderate pace as long as possible. It means that rate cut injections should keep good US economy performance and positive statistics, and mostly will work as deterrent to growth despite short-term acceleration in a moment of rate cut. Still, we do not know how successful this strategy will be and how it will be able to support US growth in reality, thus, we do not suggest that good US statistics will be able to stop gold's rally totally.
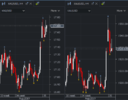
In shorter-term perspective situation remains tricky. Price hovers around major top. It is wide opinion that gold has reached temporal ceil and needs some relief, as technically market is overbought and net long positions have increased this week to 300K and stand very close to absolute highs of 316K:

Source: cftc.gov
Charting by Investing.com
In fact, we have the same background as of driving fundamental factors as technical factors that we've discussed last week. It is not too much purchasing power remains on gold and healthy retracement expectations float around. As we have to follow probabilities - odd stand against taking long-term, strategical position on gold market right now. At the same time, wide fluctuations around 1550 area are not excluded.
Technical
Monthly
As we've said in previous two weeks, despite reaching of major monthly target - Gold is flirting around, and doesn't hurry up with retracement start. Still, basic facts stand in favor of pullback, that should happen.
As we mentioned last week, next two upside targets - 1530$ of 1.618 butterfly extension and 1655 as XOP target of the same major AB=CD pattern. XOP seems a bit too far, but butterfly extension is the one that we need. Besides, it stands relatively close to major 5/8 Fib resistance level of 1585 and monthly Overbought @1550$ area.
Thus, we put this area - 1530-1585 as tactical ceil at current moment and expect that gold will show healthy retracement out there by fundamental reasons that we've mentioned.
Butterfly target has been hit relatively fast. Pattern itself suggests 3/8 retracement as minimal target. Hardly butterfly will fail as it is accompanied by Overbought and major Fib resistance level.

Weekly
Last week we've mentioned two other extensions that stand in the same monthly area. This is larger AB-CD and minor ab-cd patterns. Both of them have XOPs in the same area - 1555-1570, which agrees with our monthly range. This week gold has formed inside candle, but has shown upside action as soon as has got some relief of overbought condition.
Upside action probably will become slower, but gold could try to reach major targets by momentum. So, we do not totally deny scenarios when gold could reach 1560-1570 weekly targets. The daily and intraday performance should clarify whether gold will proceed higher or not, depending on patterns that we will get there.

Daily
J Powell has laid bullish foundation for short-term gold performance as market shows solid upside momentum here. Still, action has not exceeded yet the range of daily high wave pattern. This is the first thing that we need to keep an eye on next week. Unfortunately we do not have anything else here, on daily chart.
The only thing that we could add more, is the action that doesn't match an idea of downside retracement by far. It hints on upside continuation in nearest time.

Intraday
Using of stop entry orders on Friday has given good results, as market held the lows, i.e. Stop "sell" order has got no fill, while Stop "Buy" around 1507 tops should put you in trade. Now we recall our butterfly idea and suggest that nearest target stands around 1550, next is 1570:

On the 1H chart, as on EUR, we need just last upside swing and Fib levels on it. Here is as well, 3/8 Fib level agrees with WPP around 1516 area is a first aspirant to consider long entry. We will keep an eye on possible patterns as well. Thus, if we will get "222" Buy" there - much better. Next level is 5/8 Fib support around 1508, which is also natural support level of former consolidation.

Conclusion
Fundamental and technical analysis shows that gold keeps long-term bullish sentiment, but due technical overextension is coming to an area where chances on healthy pullback looks very probable.
Still, currently we do not have yet definite signs of reversal and keep watching on 1530-1570 area where this could happen.
The technical portion of Sive's analysis owes a great deal to Joe DiNapoli's methods, and uses a number of Joe's proprietary indicators. Please note that Sive's analysis is his own view of the market and is not endorsed by Joe DiNapoli or any related companies.
This week has become just a continuation of previous one - the same driving factors, the same expectations. Gold also, as other markets across the board was watching for JPowell speech and recent D. Trump comments on China tariffs.
As Reuters reports - Gold surged 2% on Friday as investors interpreted U.S. Federal Reserve Chair Jerome Powell’s speech as leaning toward a dovish monetary policy stance and President Donald Trump’s latest comments exacerbated trade tensions with China.
“The fact that he (Powell) said that they (the Fed) will act appropriately to sustain expansion is pretty bullish for gold. The two primary tools they have are quantitative easing (QE) or lower rates - both those tools will cause gold to go higher,” said Bob Haberkorn, senior market strategist at RJO Futures.
“The move this morning is just more people buying gold simply with the expectations that interest rates will be lower by year-end.”
Powell said the U.S. economy is in a “favorable place,” but gave few clues about interest rate cuts at its next meeting. However, he listed a series of economic and geopolitical risks the Fed is monitoring, noting these were linked to the trade spat.
“We shouldn’t be surprised if we see the Fed deliver a full percentage point in rate cuts over the next 12 months and a new QE program as we may only need a couple of the following macro events to blow up: trade uncertainties, weakness in China and Germany, Brexit, Hong Kong, and the dissolution of the Italian government,” Edward Moya, a senior market analyst at OANDA, said in a note.
Powell’s speech prompted a backlash from Trump on Twitter, asking whether the Fed chair was a greater “enemy” than China’s leader Xi Jinping.
Trump also ratcheted up the rhetoric on China, ordering U.S. companies to look at ways to close operations in the country, which sent equities tumbling and drove further inflows into safe-haven gold.
This came after China unveiled retaliatory tariffs against about $75 billion worth of U.S. goods.
“This means there is no resolution, the escalation continues. Investors are selling the risk and buying gold,” said SP Angel analyst Sergey Raevskiy.
Gold has risen nearly 8% so far this month and about 19% this year, and was set for a fourth straight week of gains.
Yesterday we've talked a lot about new Fed policy and its major objects in our FX research. As we've come to conclusion that Fed policy is not about new dovish cycle against recession but supportive measure to keep US economy moderate pace as long as possible. It means that rate cut injections should keep good US economy performance and positive statistics, and mostly will work as deterrent to growth despite short-term acceleration in a moment of rate cut. Still, we do not know how successful this strategy will be and how it will be able to support US growth in reality, thus, we do not suggest that good US statistics will be able to stop gold's rally totally.
In shorter-term perspective situation remains tricky. Price hovers around major top. It is wide opinion that gold has reached temporal ceil and needs some relief, as technically market is overbought and net long positions have increased this week to 300K and stand very close to absolute highs of 316K:
Source: cftc.gov
Charting by Investing.com
In fact, we have the same background as of driving fundamental factors as technical factors that we've discussed last week. It is not too much purchasing power remains on gold and healthy retracement expectations float around. As we have to follow probabilities - odd stand against taking long-term, strategical position on gold market right now. At the same time, wide fluctuations around 1550 area are not excluded.
Technical
Monthly
As we've said in previous two weeks, despite reaching of major monthly target - Gold is flirting around, and doesn't hurry up with retracement start. Still, basic facts stand in favor of pullback, that should happen.
As we mentioned last week, next two upside targets - 1530$ of 1.618 butterfly extension and 1655 as XOP target of the same major AB=CD pattern. XOP seems a bit too far, but butterfly extension is the one that we need. Besides, it stands relatively close to major 5/8 Fib resistance level of 1585 and monthly Overbought @1550$ area.
Thus, we put this area - 1530-1585 as tactical ceil at current moment and expect that gold will show healthy retracement out there by fundamental reasons that we've mentioned.
Butterfly target has been hit relatively fast. Pattern itself suggests 3/8 retracement as minimal target. Hardly butterfly will fail as it is accompanied by Overbought and major Fib resistance level.
Weekly
Last week we've mentioned two other extensions that stand in the same monthly area. This is larger AB-CD and minor ab-cd patterns. Both of them have XOPs in the same area - 1555-1570, which agrees with our monthly range. This week gold has formed inside candle, but has shown upside action as soon as has got some relief of overbought condition.
Upside action probably will become slower, but gold could try to reach major targets by momentum. So, we do not totally deny scenarios when gold could reach 1560-1570 weekly targets. The daily and intraday performance should clarify whether gold will proceed higher or not, depending on patterns that we will get there.
Daily
J Powell has laid bullish foundation for short-term gold performance as market shows solid upside momentum here. Still, action has not exceeded yet the range of daily high wave pattern. This is the first thing that we need to keep an eye on next week. Unfortunately we do not have anything else here, on daily chart.
The only thing that we could add more, is the action that doesn't match an idea of downside retracement by far. It hints on upside continuation in nearest time.
Intraday
Using of stop entry orders on Friday has given good results, as market held the lows, i.e. Stop "sell" order has got no fill, while Stop "Buy" around 1507 tops should put you in trade. Now we recall our butterfly idea and suggest that nearest target stands around 1550, next is 1570:
On the 1H chart, as on EUR, we need just last upside swing and Fib levels on it. Here is as well, 3/8 Fib level agrees with WPP around 1516 area is a first aspirant to consider long entry. We will keep an eye on possible patterns as well. Thus, if we will get "222" Buy" there - much better. Next level is 5/8 Fib support around 1508, which is also natural support level of former consolidation.
Conclusion
Fundamental and technical analysis shows that gold keeps long-term bullish sentiment, but due technical overextension is coming to an area where chances on healthy pullback looks very probable.
Still, currently we do not have yet definite signs of reversal and keep watching on 1530-1570 area where this could happen.
The technical portion of Sive's analysis owes a great deal to Joe DiNapoli's methods, and uses a number of Joe's proprietary indicators. Please note that Sive's analysis is his own view of the market and is not endorsed by Joe DiNapoli or any related companies.