Sive Morten
Special Consultant to the FPA
- Messages
- 18,699
Fundamentals
Reuters reports, Gold fell over 2 percent on Friday, extending a three-day slide to a two-week low, and silver dropped the most since September 2013 on free-falling oil prices and a strong dollar.
Spot gold was down 1.9 percent at $1,168.56 an ounce by 1:28 p.m. EDT (1816 GMT), after hitting a low of $1,165.04. U.S. gold futures for December delivery closed down $21.40 an ounce at $1,175.20, but ended November slightly higher.
U.S. oil prices tumbled 7 percent, extending a huge rout on bearish sentiment.
The U.S. dollar rose versus commodity currencies such as the Canadian dollar and Norwegian crown on OPEC's decision not to reduce output.
"Everything is stemming from crude (oil). People are liquidating," said Phillip Streible, senior commodities broker at RJO Futures in Chicago.
Traders awaited the outcome of a referendum in Switzerland on Sunday on a motion to force the Swiss National Bank to raise gold holdings to 20 percent of its foreign exchange reserves, repatriate its bullion and undertake never to sell it.
"The likelihood of this going through is pretty remote," said Ross Norman, chief executive officer of broker Sharps Pixley.
A surprise "yes" vote could prompt the Swiss central bank to buy about 1,500 tonnes of gold over the next few years, analysts said.
Elsewhere, India has decided to scrap the rule that required trading companies to export 20 percent of the gold they imported, known as the 80:20 scheme, local television channels reported on Friday, citing government sources.
CFTC data is not available on this week, guys, it seems due Thanksgiving celebration. But SPDR fund data continues to show outflow…
Technicals
Monthly
As we’ve said two of our patterns have been completed - bearish grabber @ 1400 and recent dynamic pressure that have led market to 1180 lows and clear them out. Still we have another pattern in progress that is Volatility breakout (VOB). It suggests at least 0.618 AB-CD down. And this target is 1050$.
On previous week we’ve mentioned potential bullish grabber on gold market as November MACDP=1183,04. But last week we’ve got absolutely dramatic action. Right at last trading session of November gold has dropped significantly lower and destroyed any chances to get grabber. Trend has shifted bearish again on monthly chart. Although we’ve expressed our doubts on grabber since no real purchases supported it, but right now we’ve got final confirmation. It seems that CFTC data positive explosion 2 weeks ago mostly was really exclusion, since it has not got any continuation since then.
Now the time has come to be bother with second question – how deep market could drop below 1180.
Again we have to keep a close eye on CFTC and SPDR data because it will warn us about possible changing.
Another factor that could impact on gold market is possible gold buying from SNB. We’ve said about it on previous week:
Swiss gold referendum's support falls short of majority: poll | Reuters
But last public opinion poll points on decreasing of supporters of this measure from 44 to 38%. Thus, currently the chances on SNB purchases are not very significant.
Finally the major driving factor for Gold is inflation and particularly here US economy has problem. All stats are improving across the board but wages and wealth of middle class stagnates. Although this is typical for first stage of grow in economical cycle, but this does not support gold appreciation by far. Still, it seems that situation slightly starts to change here. Our ultimate target stands at 1050 and this is just 80 bucks above recent 1130 lows… Many international banks, such as ABN AMRO, GS, Societe General recently told about 800$ at the end of 2015-mid 2016, but we have solid doubts on this forecast. The point is that Fed “plans” to change rate somewhere in 2015. It means that inflation probably will become visible somehow. And in these conditions gold will react even earlier, as well as Treasury bond market. Anyway, let’s get first to our 1050 level and then we will discuss – could we count on 800$ or not.

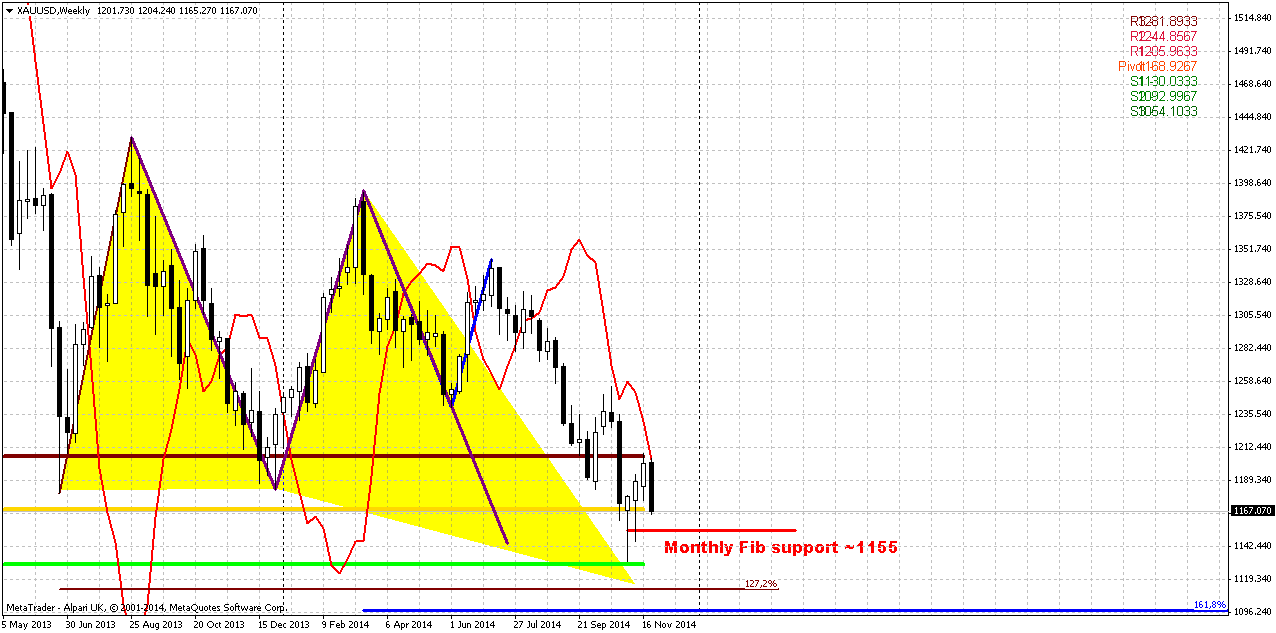
Weekly
Weekly chart adds even more confidence with bullish perspective. It has a lot of important things. First of all, gold has failed to pass through MPP, just tested it and closed below. This tells that bearish trend is still valid. Right now we’ve drawn new monthly pivot levels for December. Although there is just one butterfly drawn on the chart – we have two. But reaction on reaching 1.27 of minor butterfly, MPS1, Fib level and inner AB=CD pattern is coming to an end. But how do we know that market will drop below 1130’s? Because we also have bearish grabber here, guys and it has minor target below 1130 lows that will be also MPS1. This, in turn means that stops will be grabbed and market will accelerate lower. Our next target for coming week is 1100 level. It includes 1.27 of large butterfly and inner 1.618 AB=CD target.
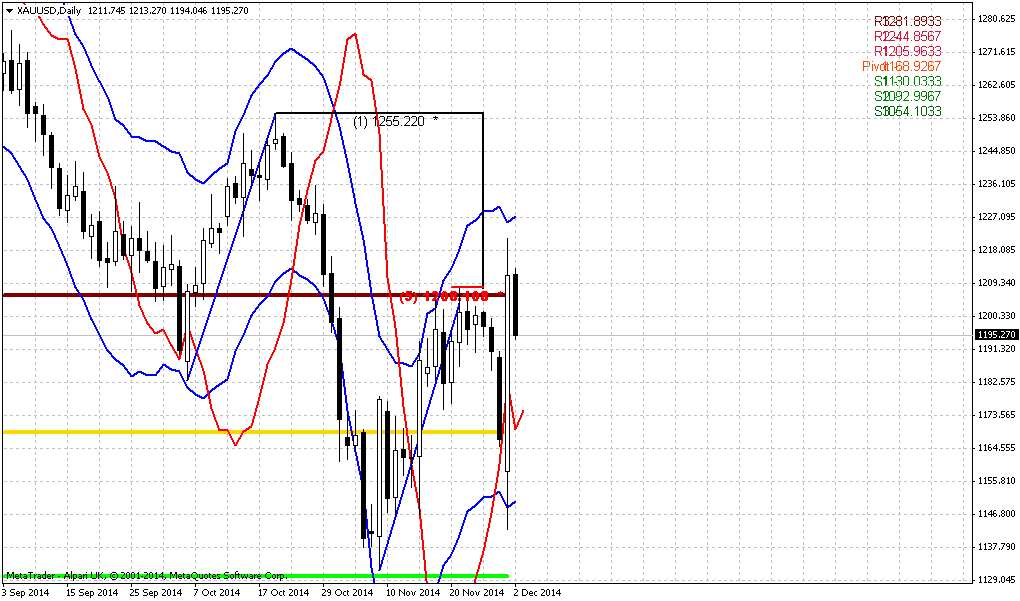
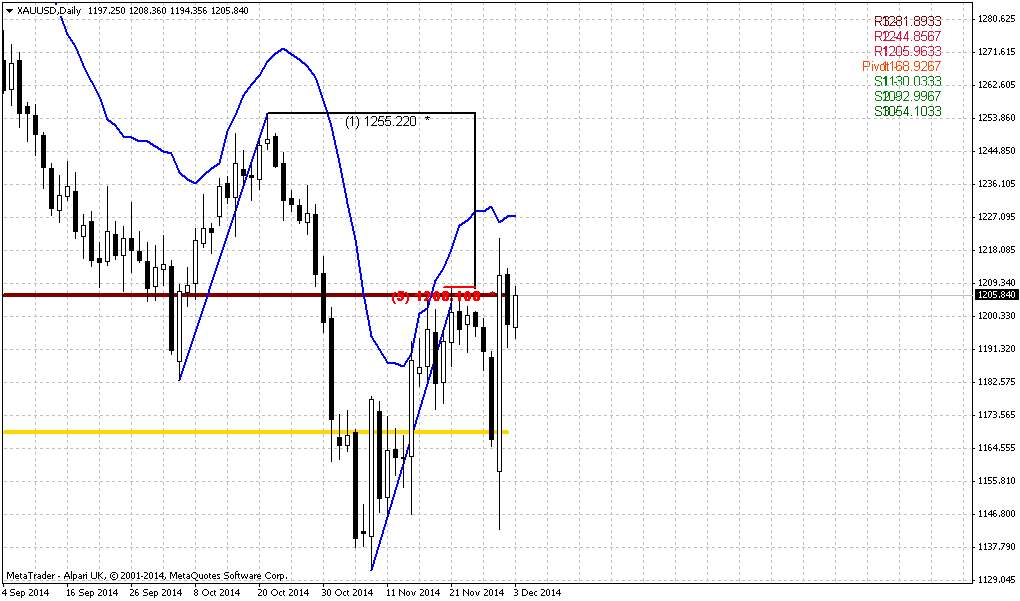
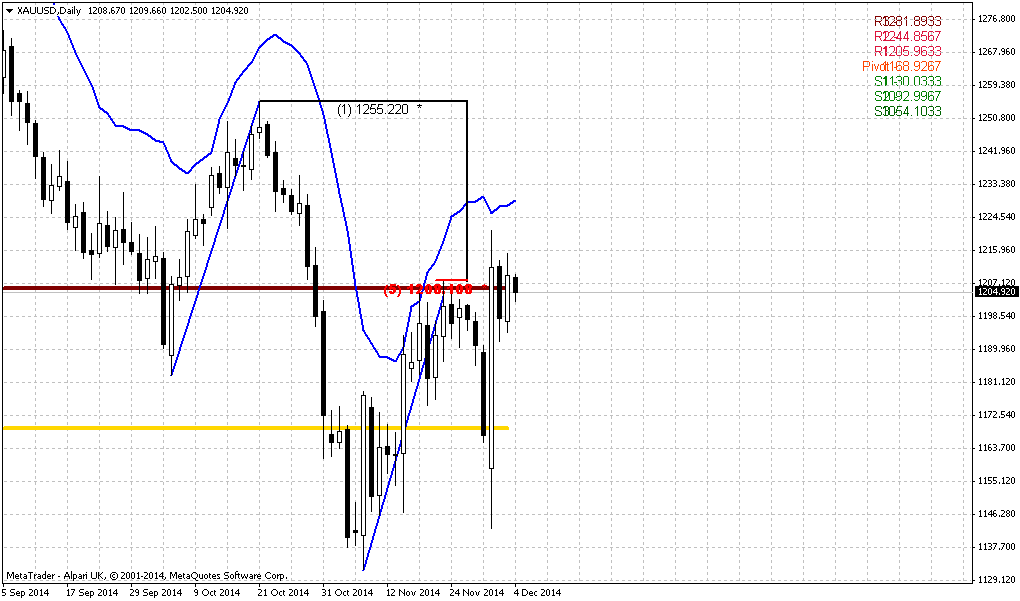
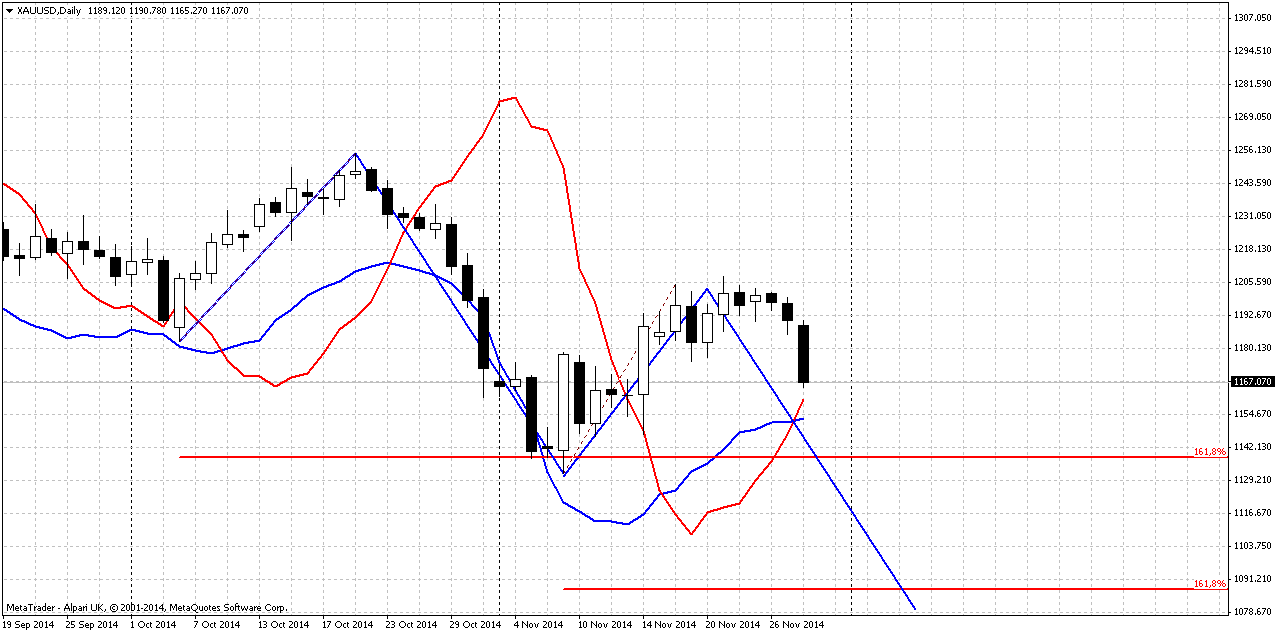
Daily
Another pattern that points on the same 1100 area we have on daily chart, and this pattern is potential 1.618 3-Drive “Buy”. “1.618” means that drives stand at 1.618 extension from each other. This pattern really could work, since retracements are very harmonic as by depth as by slope of action. Second drive stands at 1.618 of the first one, thus, 3rd drive should be somewhere around 1090 area. As recent retracement up was also precisely 5/8 – it will give as additional AB=CD pattern as final part of 3-drive pattern.
Still, here we also weren’t able to escape some problems and complexity. It comes from MACDP and OscP indicators. Recall that on Friday we’ve mentioned possible bullish grabber, as gold has come very close to MACDP line. Due recent plunge down we could treat chances of this pattern as shy but… MACDP crosses oscillator predictor in the same point. It means that when gold will touch MACDP – it will reach oversold and it will be difficult to pass through this area and just shift trend bearish. Other words, combination of MACDP and OscP in one point significantly increases chances on appearing of the grabber. Although it could fail later but from bearish perspective appearing of grabber is not really desirable moment. It makes situation complex. Besides, as we’ve seen above – 1130 is not just previous lows, this is also new MPS1. It means that in the beginning of the week gold will meet some technical supportive factor, and it will need additional power to overcome it. During last plunge gold had this power, so let’s see what will happen now. At the same time we can’t say that this mission is impossible. Commodities markets can stay in oversold longer than financial ones and you can see example of this on recent move down.
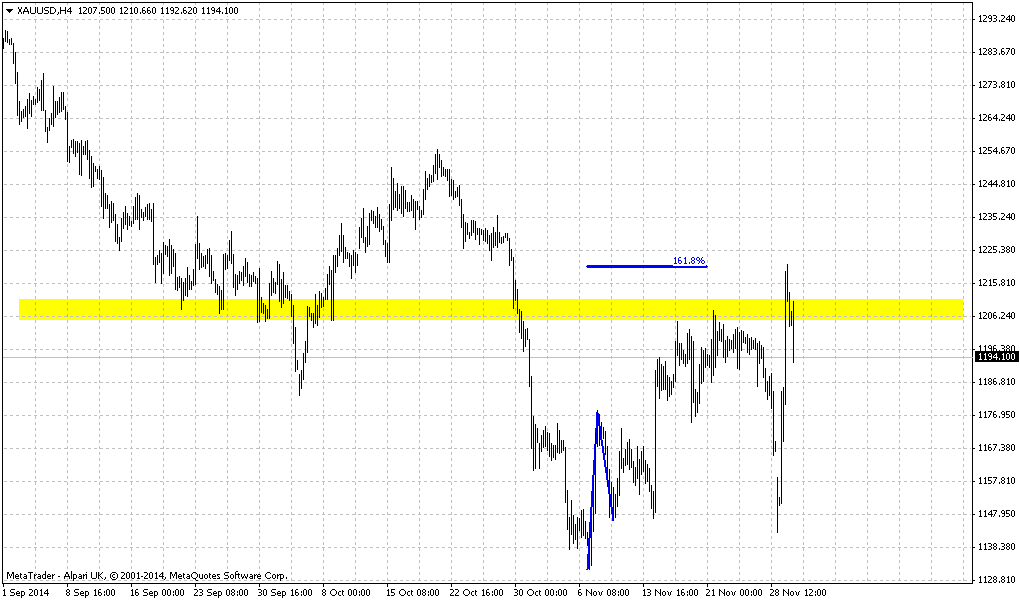
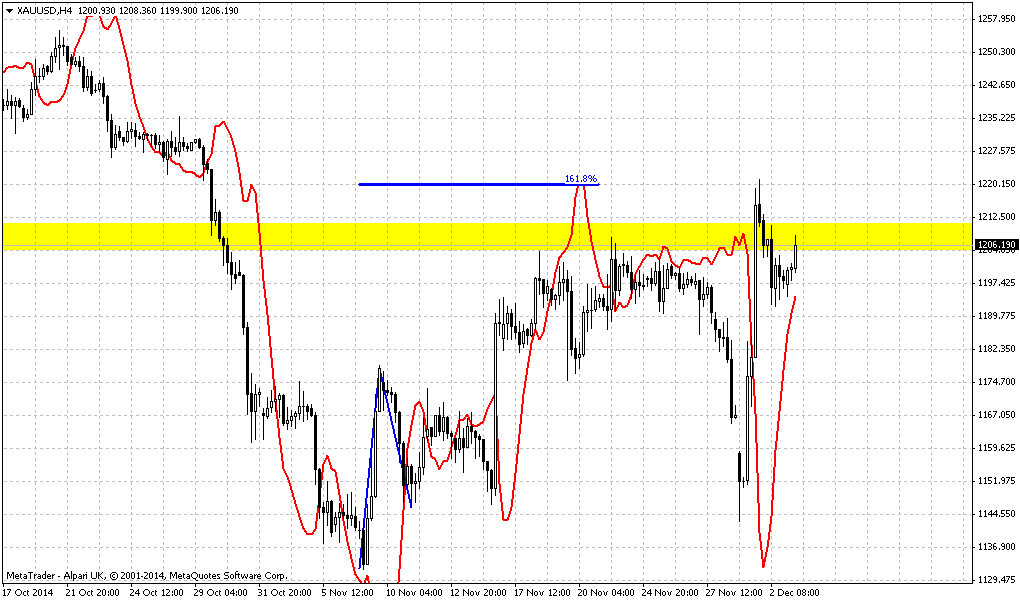
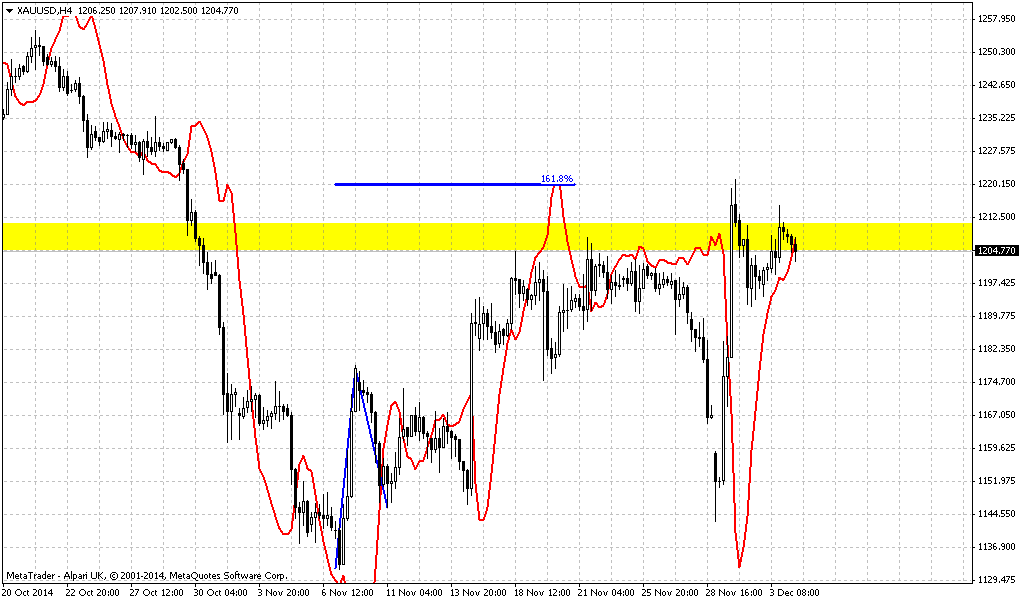
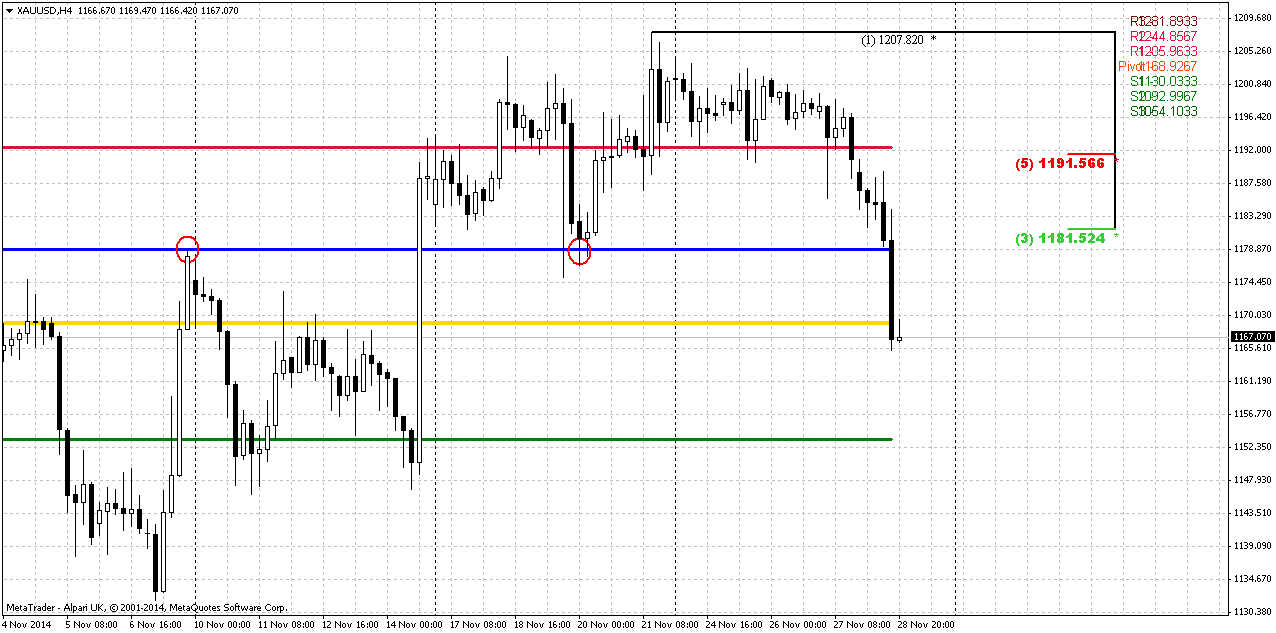
4-hour
As this is still a question whether we will get grabber on daily or not, we should prepare for short entry. Here we see that market has formed reversal swing – move down is greater than recent move up. At the same time market will open somewhere around new MPP, i.e. at resistance (if we will not get gap down on SNB voting of cause) and some retracement up could happen on Monday. If this really happen we probably should watch for 1180 area. This is combination of former lows, Fib level and WPP. Also, 1180s is previous daily lows. Thus, if retracement up will happen – this level will be particular interesting. As conclusion to our discussion, we could say that bearish arguments right now look more solid and have real fundamental and financial background. Bullish signs mostly technical and stand as possible and potential, but currently they have not appeared yet. That’s why we still stand with our bearish view and think that bearish position looks more preferable.
Conclusion:
Major bullish pattern has not been formed and scenario on possible 1360 action was canceled. Recent price behavior looks perfect from normal bearish development point of view and has solid economical background. Also market has formed multiple bearish signs that suggest deeper downside action. Currently we have no reasons to refuse our previous analysis and expectation of reaching 1050 area in medium-term perspective.
In short-term perspective we have some complication factors, but it is not the fact yet that these patterns will be formed. That’s why we should prepare for short entry if retracement up will happen. Besides, we even could get open gap down on negative results of SNB voting that could give psychological effect on market participants.
The technical portion of Sive's analysis owes a great deal to Joe DiNapoli's methods, and uses a number of Joe's proprietary indicators. Please note that Sive's analysis is his own view of the market and is not endorsed by Joe DiNapoli or any related companies.
Reuters reports, Gold fell over 2 percent on Friday, extending a three-day slide to a two-week low, and silver dropped the most since September 2013 on free-falling oil prices and a strong dollar.
Spot gold was down 1.9 percent at $1,168.56 an ounce by 1:28 p.m. EDT (1816 GMT), after hitting a low of $1,165.04. U.S. gold futures for December delivery closed down $21.40 an ounce at $1,175.20, but ended November slightly higher.
U.S. oil prices tumbled 7 percent, extending a huge rout on bearish sentiment.
The U.S. dollar rose versus commodity currencies such as the Canadian dollar and Norwegian crown on OPEC's decision not to reduce output.
"Everything is stemming from crude (oil). People are liquidating," said Phillip Streible, senior commodities broker at RJO Futures in Chicago.
Traders awaited the outcome of a referendum in Switzerland on Sunday on a motion to force the Swiss National Bank to raise gold holdings to 20 percent of its foreign exchange reserves, repatriate its bullion and undertake never to sell it.
"The likelihood of this going through is pretty remote," said Ross Norman, chief executive officer of broker Sharps Pixley.
A surprise "yes" vote could prompt the Swiss central bank to buy about 1,500 tonnes of gold over the next few years, analysts said.
Elsewhere, India has decided to scrap the rule that required trading companies to export 20 percent of the gold they imported, known as the 80:20 scheme, local television channels reported on Friday, citing government sources.
CFTC data is not available on this week, guys, it seems due Thanksgiving celebration. But SPDR fund data continues to show outflow…
Technicals
Monthly
As we’ve said two of our patterns have been completed - bearish grabber @ 1400 and recent dynamic pressure that have led market to 1180 lows and clear them out. Still we have another pattern in progress that is Volatility breakout (VOB). It suggests at least 0.618 AB-CD down. And this target is 1050$.
On previous week we’ve mentioned potential bullish grabber on gold market as November MACDP=1183,04. But last week we’ve got absolutely dramatic action. Right at last trading session of November gold has dropped significantly lower and destroyed any chances to get grabber. Trend has shifted bearish again on monthly chart. Although we’ve expressed our doubts on grabber since no real purchases supported it, but right now we’ve got final confirmation. It seems that CFTC data positive explosion 2 weeks ago mostly was really exclusion, since it has not got any continuation since then.
Now the time has come to be bother with second question – how deep market could drop below 1180.
Again we have to keep a close eye on CFTC and SPDR data because it will warn us about possible changing.
Another factor that could impact on gold market is possible gold buying from SNB. We’ve said about it on previous week:
Swiss gold referendum's support falls short of majority: poll | Reuters
But last public opinion poll points on decreasing of supporters of this measure from 44 to 38%. Thus, currently the chances on SNB purchases are not very significant.
Finally the major driving factor for Gold is inflation and particularly here US economy has problem. All stats are improving across the board but wages and wealth of middle class stagnates. Although this is typical for first stage of grow in economical cycle, but this does not support gold appreciation by far. Still, it seems that situation slightly starts to change here. Our ultimate target stands at 1050 and this is just 80 bucks above recent 1130 lows… Many international banks, such as ABN AMRO, GS, Societe General recently told about 800$ at the end of 2015-mid 2016, but we have solid doubts on this forecast. The point is that Fed “plans” to change rate somewhere in 2015. It means that inflation probably will become visible somehow. And in these conditions gold will react even earlier, as well as Treasury bond market. Anyway, let’s get first to our 1050 level and then we will discuss – could we count on 800$ or not.
Weekly
Weekly chart adds even more confidence with bullish perspective. It has a lot of important things. First of all, gold has failed to pass through MPP, just tested it and closed below. This tells that bearish trend is still valid. Right now we’ve drawn new monthly pivot levels for December. Although there is just one butterfly drawn on the chart – we have two. But reaction on reaching 1.27 of minor butterfly, MPS1, Fib level and inner AB=CD pattern is coming to an end. But how do we know that market will drop below 1130’s? Because we also have bearish grabber here, guys and it has minor target below 1130 lows that will be also MPS1. This, in turn means that stops will be grabbed and market will accelerate lower. Our next target for coming week is 1100 level. It includes 1.27 of large butterfly and inner 1.618 AB=CD target.
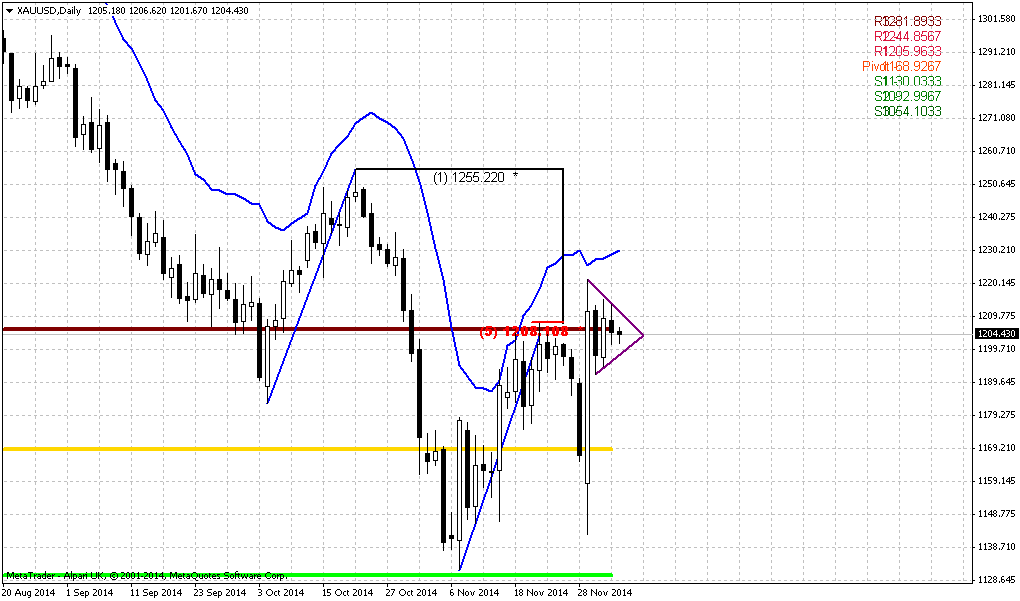
Daily
Another pattern that points on the same 1100 area we have on daily chart, and this pattern is potential 1.618 3-Drive “Buy”. “1.618” means that drives stand at 1.618 extension from each other. This pattern really could work, since retracements are very harmonic as by depth as by slope of action. Second drive stands at 1.618 of the first one, thus, 3rd drive should be somewhere around 1090 area. As recent retracement up was also precisely 5/8 – it will give as additional AB=CD pattern as final part of 3-drive pattern.
Still, here we also weren’t able to escape some problems and complexity. It comes from MACDP and OscP indicators. Recall that on Friday we’ve mentioned possible bullish grabber, as gold has come very close to MACDP line. Due recent plunge down we could treat chances of this pattern as shy but… MACDP crosses oscillator predictor in the same point. It means that when gold will touch MACDP – it will reach oversold and it will be difficult to pass through this area and just shift trend bearish. Other words, combination of MACDP and OscP in one point significantly increases chances on appearing of the grabber. Although it could fail later but from bearish perspective appearing of grabber is not really desirable moment. It makes situation complex. Besides, as we’ve seen above – 1130 is not just previous lows, this is also new MPS1. It means that in the beginning of the week gold will meet some technical supportive factor, and it will need additional power to overcome it. During last plunge gold had this power, so let’s see what will happen now. At the same time we can’t say that this mission is impossible. Commodities markets can stay in oversold longer than financial ones and you can see example of this on recent move down.
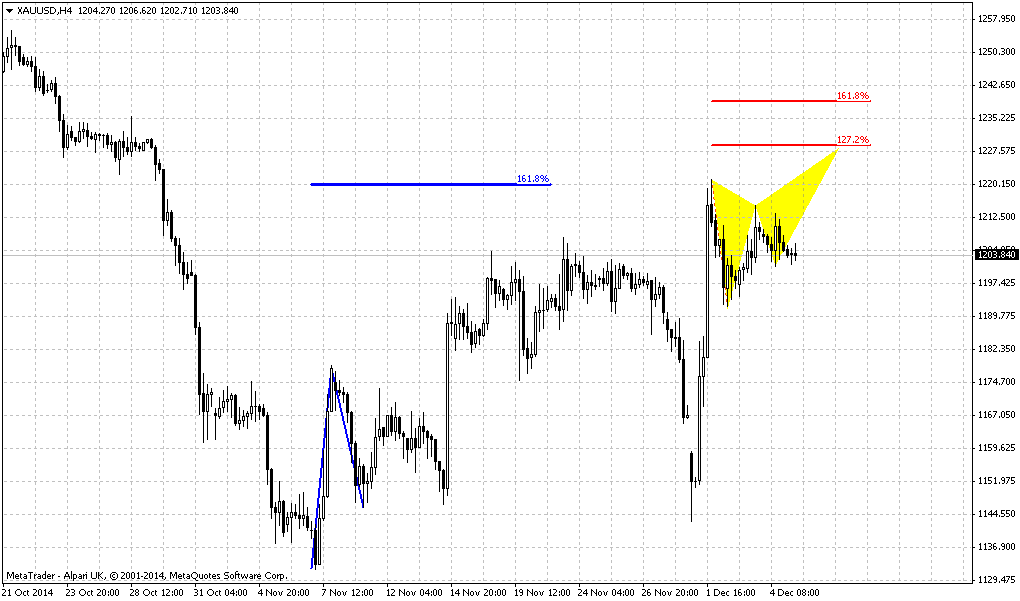
4-hour
As this is still a question whether we will get grabber on daily or not, we should prepare for short entry. Here we see that market has formed reversal swing – move down is greater than recent move up. At the same time market will open somewhere around new MPP, i.e. at resistance (if we will not get gap down on SNB voting of cause) and some retracement up could happen on Monday. If this really happen we probably should watch for 1180 area. This is combination of former lows, Fib level and WPP. Also, 1180s is previous daily lows. Thus, if retracement up will happen – this level will be particular interesting. As conclusion to our discussion, we could say that bearish arguments right now look more solid and have real fundamental and financial background. Bullish signs mostly technical and stand as possible and potential, but currently they have not appeared yet. That’s why we still stand with our bearish view and think that bearish position looks more preferable.
Conclusion:
Major bullish pattern has not been formed and scenario on possible 1360 action was canceled. Recent price behavior looks perfect from normal bearish development point of view and has solid economical background. Also market has formed multiple bearish signs that suggest deeper downside action. Currently we have no reasons to refuse our previous analysis and expectation of reaching 1050 area in medium-term perspective.
In short-term perspective we have some complication factors, but it is not the fact yet that these patterns will be formed. That’s why we should prepare for short entry if retracement up will happen. Besides, we even could get open gap down on negative results of SNB voting that could give psychological effect on market participants.
The technical portion of Sive's analysis owes a great deal to Joe DiNapoli's methods, and uses a number of Joe's proprietary indicators. Please note that Sive's analysis is his own view of the market and is not endorsed by Joe DiNapoli or any related companies.