Sive Morten
Special Consultant to the FPA
- Messages
- 18,695
Fundamentals
Weekly Gold Tading Report prepared by Sive Morten exclusively for ForexPeaceArmy.com
Reuters reports, Gold fell more than 1 percent on Friday, after U.S. November non-farm payrolls data beat forecasts, fueling expectations that the Federal Reserve will raise interest rates sooner rather than later and lifting the dollar.
Labor Department data showed the U.S. economy added 321,000 new jobs last month, the largest number in nearly three years, and wages increased.
That sparked a rally in the U.S. dollar, which hit multi year highs and prompted traders to bet the Fed will raise rates earlier in 2015 than formerly thought.
Spot gold was down 1.2 percent at $1,190.90 an ounce at 2:42 p.m. EST (1942 GMT), while U.S. gold futures settled down $17.30 an ounce, or 1.4 percent, at $1,190.40. In the wake of the data, spot gold hit a low of $1,186.10, down 1.6 percent. Some traders said they were surprised it did not fall further.
For the week, however, spot gold rose around 2 percent after heavy short-covering lifted prices 4 percent on Monday, its biggest daily gain in more than a year. Traders said this could attract short-term buying next week, while others suggested the market was stabilizing around current levels.
"It will be interesting to see how (gold) develops as we move towards the FOMC meeting on Dec. 17," ABN Amro analyst Georgette Boele said. "If we have a more hawkish Fed, more of an adjustment in interest rate expectations, and a still higher dollar," it will be negative for gold.
Higher rates boost the opportunity cost of holding non-yielding gold and lift the dollar, in which the metal is priced.
In the physical bullion markets, Chinese buying remained steady with premiums unchanged at about $1-$2 on Friday.
"Physical demand continues to underpin both the silver and gold markets," Kitco Metals Inc said in a note.
Data from the Istanbul Gold Exchange showed gold imports into Turkey more than doubled year on year to 46.9 tonnes in November, its strongest monthly imports in more than six years.
CFTC data shows huge drop in Open Interest. At the same time we see that net long position has increased. It means that its growth mostly has happened due closing of shorts, rather than opening of new longs, although long positions also have increased slightly. Currently it is difficult to understand how it will impact on market balance soon, but it seems that investors have closed shorts that were opened on expectation of 1140 breakout. Does it mean that investors do not believe in soon downward breakout? But at the same time they do not hurry to increase longs… May be this has happened due coming end of the financial year…
Net long position has not changed significantly:
At the same time recent SPDR data does not support upside gold retracement. For the period when gold has reached 1210 area – net outflow from SPDR fund stands ~ for 1% or 7 tonnes of gold (from 727 tonnes in beginning of November to 720 tonnes currently).
Here is detailed breakdown:
Open interest:
 Shorts:
 Longs:

Technicals
Monthly
As we’ve said two of our patterns have been completed - bearish grabber @ 1400 and recent dynamic pressure that have led market to 1180 lows and clear them out. Still we have another pattern in progress that is Volatility breakout (VOB). It suggests at least 0.618 AB-CD down. And this target is 1050$.
Right now monthly chart has lost its piquancy. Bullish grabber has not been formed. In December we could get either just trend shifting back to bullish, or bearish grabber that will suggest further downward action.
At the same time recent CFTC data makes me think that December mostly will be quiet month. Investors have contracted their positions significantly, pointing that they do not believe in soon downward breakout but also do not fascinating with upside perspectives. Most probable explanation is reducing positions before year end, bonuses calculation and long holidays. This also makes us think that hardly Fed will make any drastical comments on December 17th. They probably will not shake market before holidays and postpone new rhetoric to 2015. If market will remain below 1210 – this will confirm our thoughts. At the same time this will hint on further decreasing in the beginning of 2015, because December candle will be small and will look mostly as consolidation after big drop and preparation for downward continuation.
The major driving factor for Gold is inflation and particularly here US economy has problem. Although recent report has shown shy increase in wages, but inflation still stands flat. Accompanied by positive NFP numbers increasing chances on sooner rate hiking will be negative combination for gold. That’s why currently we do not see reasons yet to cancel our 1050$ target.

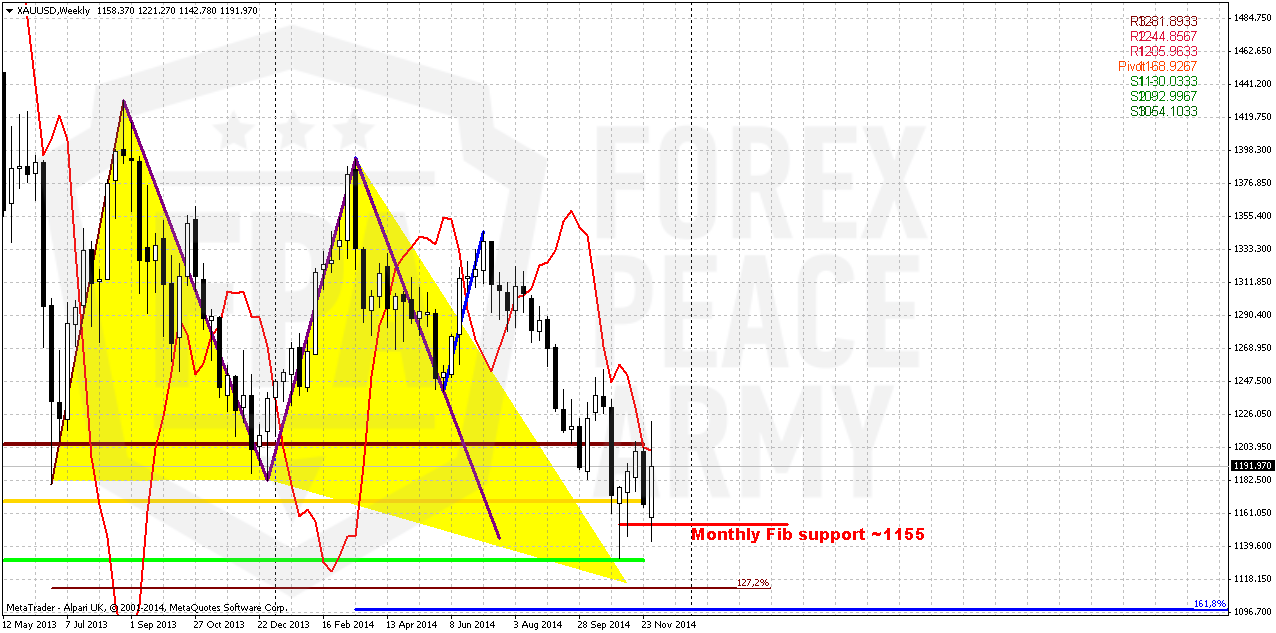
Weekly
Weekly chart again shows most important moments. On last week we’ve got another bearish grabber. So, now we have two of them in a row. Although market stands above MPP, but it has failed again pass through MPR1. This tells that bearish trend is still valid. Although there is just one butterfly drawn on the chart – we have two. But reaction on reaching 1.27 of minor butterfly, MPS1, Fib level and inner AB=CD pattern is coming to an end. Grabbers have minor target below 1130 lows that will be also MPS1. This, in turn means that stops will be grabbed and market will accelerate lower. Our next target for coming week is 1100 level. It includes 1.27 of large butterfly and inner 1.618 AB=CD target.
From pure technical approach we again meet with “1210 level” question. We will be able to return back to discussion of further gold appreciation only if market will erase grabbers and take out of current highs.
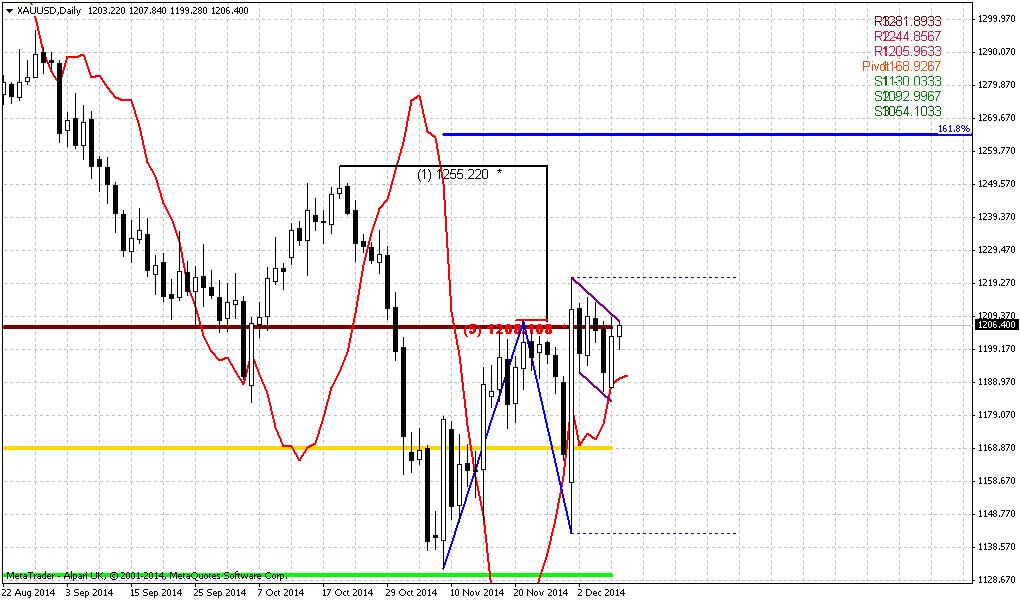
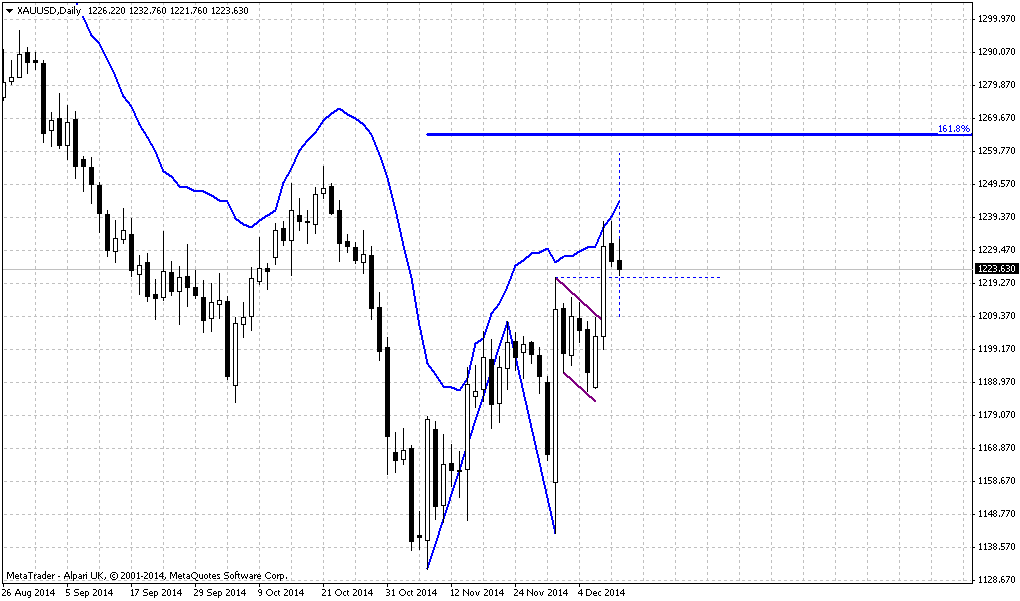
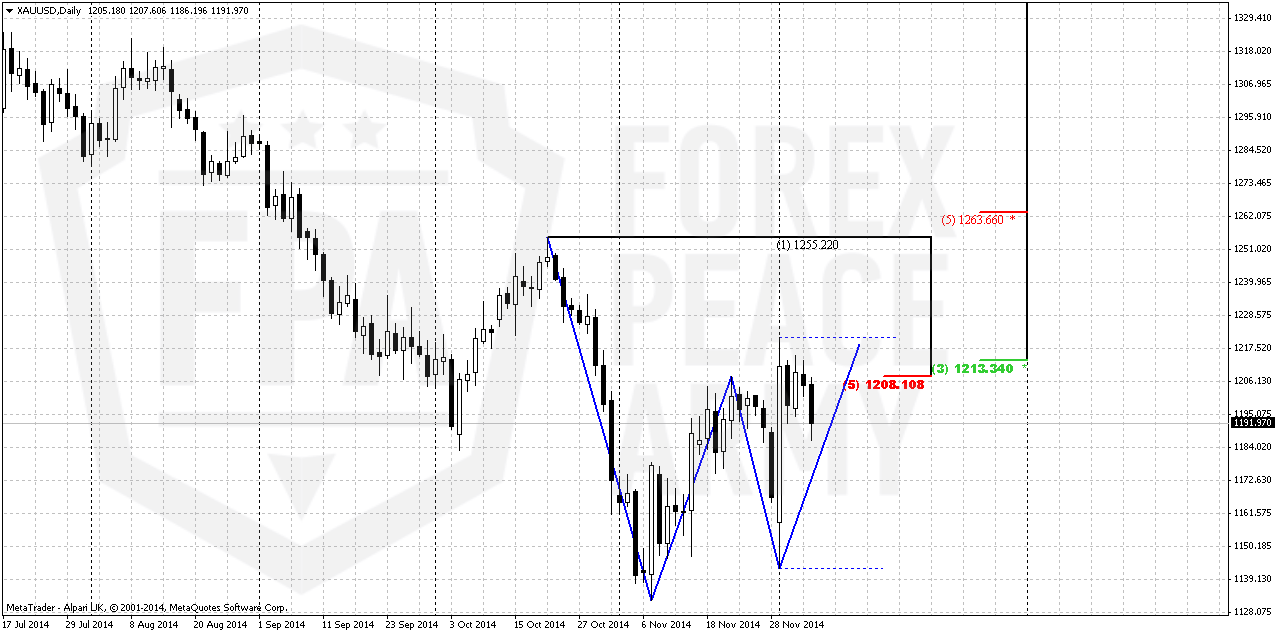
Daily
Picture on daily chart should be analyzed in relation to weekly one. Current top is in fact the top of bearish grabber on weekly chart. At the same time this top points on significant resistance level – gold has formed Agreement at K-resistance area. This, in turn gives us “222” Sell pattern as well.
Since this is simultaneously as strong resistance as top of bearish grabber – this level seems extremely important. Market has to pass through it to return bullish sentiment and expectations. This is also an area of MPR1 and moving above it will tell that bearish sentiment probably was broken. The only bullish moment here is the strength of recent upside action. CD leg has been completed with just 1 day. Fast CD leg very often suggests further upside continuation, but again to prove it market will have to take out of recent top.
Also it is possible that market will stay inside the range of big candle. This happens very often – big candle could hold action for considerable period of time, and usually direction will be determined by whether market will take out top or bottom of this big candle.
Short position here looks preferable by two reasons. First is, gold stands near strong resistance and has weekly grabber as background. Second – market stands very close to invalidation point of bearish setup. Taking long position seems not very logical, because we have bearish patterns in place. Better to wait when they will fail. Thus, currently we have just 1 choice – either taking short position or do nothing.
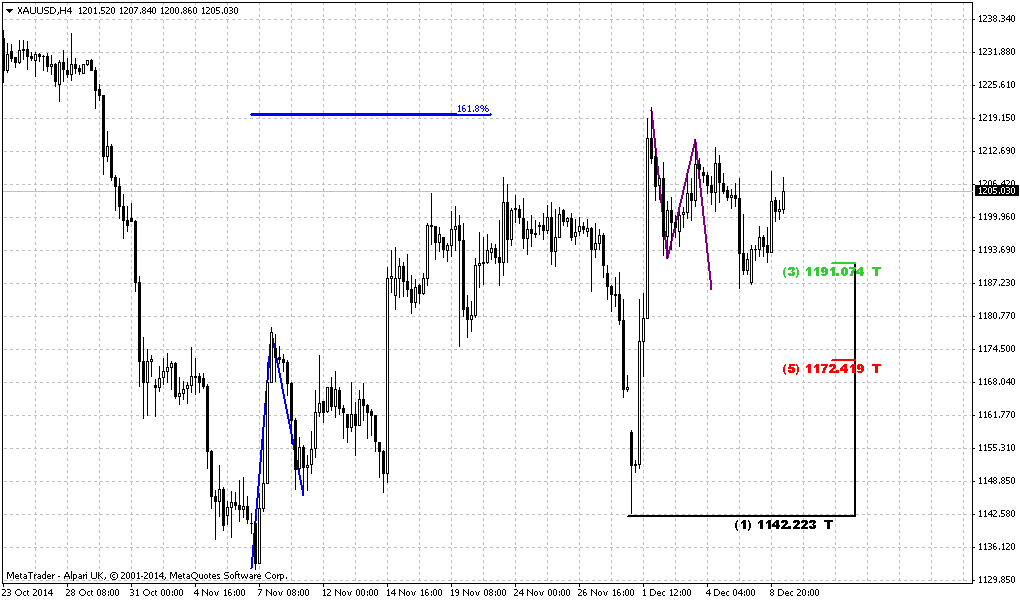
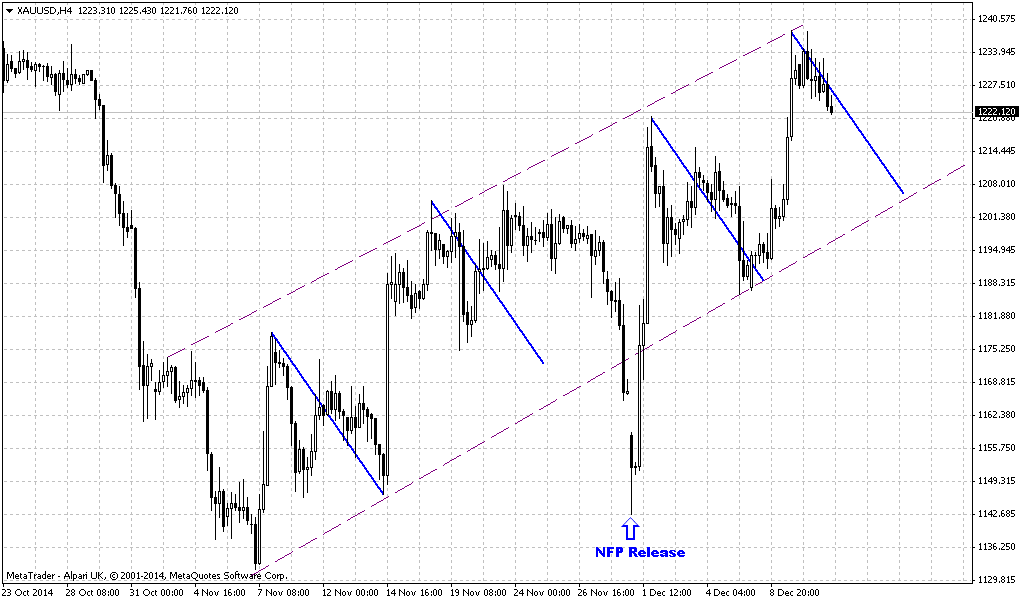
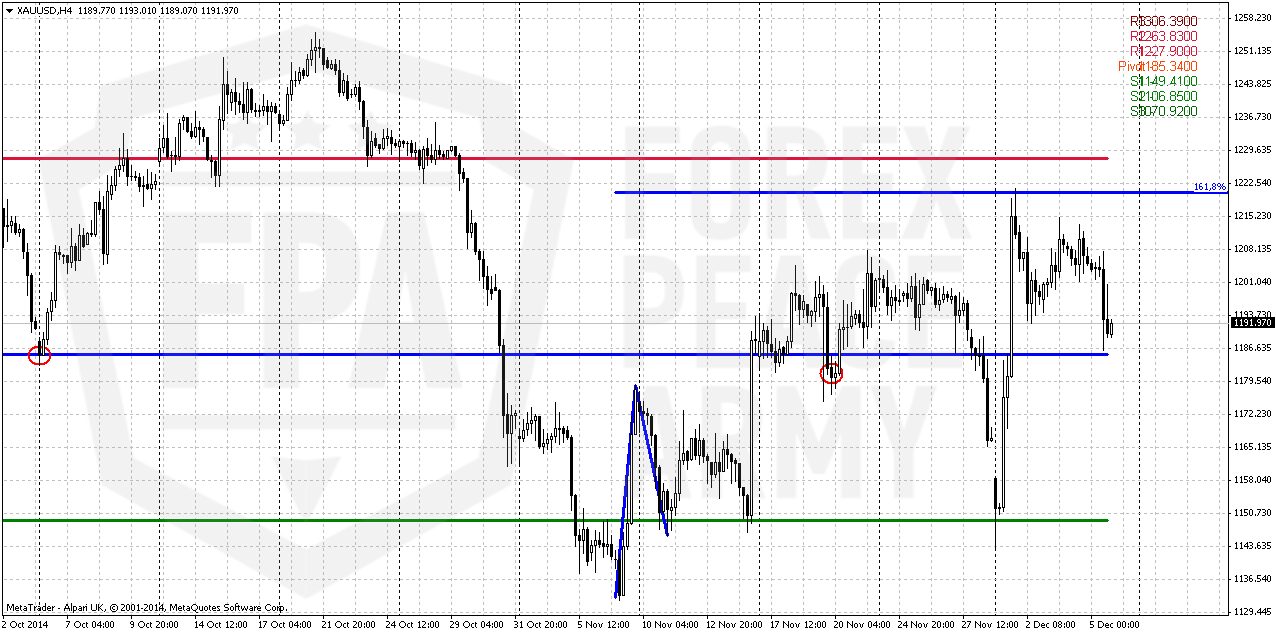
4-hour
This chart does not show any clear patterns and our major task on coming week is to understand what market intends to do, what direction it will choose. Here we probably should watch for 1185 area. This is former bottoms, also this will be WPP. Moving below it will increase chances on further downward action. Trend here is bearish already.
Although recent action seems as AB-CD retracement down, but market shows acceleration and this increases chances on further downward action. Chances on downward action exist, since we’ve estimated that recent rallies were triggered by short covering. As this procedure has limited effect – market needs real purchases to push it higher. But last CFTC data does not show any long increasing. As a result, market could move lower.
Conclusion:
Currently we have no reasons to refuse our previous analysis and expectation of reaching 1050 area in medium-term perspective. Yes, two big short-covering rally has happened within recent 2-3 weeks, but this does not look curious at the eve of the end of financial year and may be investors do not expect crucial breakout at the end of the year. Still, as buying activity still stagnates – it is difficult to expect upside breakout right now.
In short-term perspective we have bearish picture. Existing of bearish grabbers on weekly, “222” Sell on daily and inability of gold to pass through major 1210-1220 resistance, market could move lower in nearest future. Fed December 17th meeting could add some action, but somehow we think that Fed hardly will shake markets at the end of December. Anyway, using dry numbers – we will be able to speak on bullish perspectives if market will move above recent top.
The technical portion of Sive's analysis owes a great deal to Joe DiNapoli's methods, and uses a number of Joe's proprietary indicators. Please note that Sive's analysis is his own view of the market and is not endorsed by Joe DiNapoli or any related companies.
Weekly Gold Tading Report prepared by Sive Morten exclusively for ForexPeaceArmy.com
Reuters reports, Gold fell more than 1 percent on Friday, after U.S. November non-farm payrolls data beat forecasts, fueling expectations that the Federal Reserve will raise interest rates sooner rather than later and lifting the dollar.
Labor Department data showed the U.S. economy added 321,000 new jobs last month, the largest number in nearly three years, and wages increased.
That sparked a rally in the U.S. dollar, which hit multi year highs and prompted traders to bet the Fed will raise rates earlier in 2015 than formerly thought.
Spot gold was down 1.2 percent at $1,190.90 an ounce at 2:42 p.m. EST (1942 GMT), while U.S. gold futures settled down $17.30 an ounce, or 1.4 percent, at $1,190.40. In the wake of the data, spot gold hit a low of $1,186.10, down 1.6 percent. Some traders said they were surprised it did not fall further.
For the week, however, spot gold rose around 2 percent after heavy short-covering lifted prices 4 percent on Monday, its biggest daily gain in more than a year. Traders said this could attract short-term buying next week, while others suggested the market was stabilizing around current levels.
"It will be interesting to see how (gold) develops as we move towards the FOMC meeting on Dec. 17," ABN Amro analyst Georgette Boele said. "If we have a more hawkish Fed, more of an adjustment in interest rate expectations, and a still higher dollar," it will be negative for gold.
Higher rates boost the opportunity cost of holding non-yielding gold and lift the dollar, in which the metal is priced.
In the physical bullion markets, Chinese buying remained steady with premiums unchanged at about $1-$2 on Friday.
"Physical demand continues to underpin both the silver and gold markets," Kitco Metals Inc said in a note.
Data from the Istanbul Gold Exchange showed gold imports into Turkey more than doubled year on year to 46.9 tonnes in November, its strongest monthly imports in more than six years.
CFTC data shows huge drop in Open Interest. At the same time we see that net long position has increased. It means that its growth mostly has happened due closing of shorts, rather than opening of new longs, although long positions also have increased slightly. Currently it is difficult to understand how it will impact on market balance soon, but it seems that investors have closed shorts that were opened on expectation of 1140 breakout. Does it mean that investors do not believe in soon downward breakout? But at the same time they do not hurry to increase longs… May be this has happened due coming end of the financial year…
Net long position has not changed significantly:
At the same time recent SPDR data does not support upside gold retracement. For the period when gold has reached 1210 area – net outflow from SPDR fund stands ~ for 1% or 7 tonnes of gold (from 727 tonnes in beginning of November to 720 tonnes currently).
Here is detailed breakdown:
Open interest:
Technicals
Monthly
As we’ve said two of our patterns have been completed - bearish grabber @ 1400 and recent dynamic pressure that have led market to 1180 lows and clear them out. Still we have another pattern in progress that is Volatility breakout (VOB). It suggests at least 0.618 AB-CD down. And this target is 1050$.
Right now monthly chart has lost its piquancy. Bullish grabber has not been formed. In December we could get either just trend shifting back to bullish, or bearish grabber that will suggest further downward action.
At the same time recent CFTC data makes me think that December mostly will be quiet month. Investors have contracted their positions significantly, pointing that they do not believe in soon downward breakout but also do not fascinating with upside perspectives. Most probable explanation is reducing positions before year end, bonuses calculation and long holidays. This also makes us think that hardly Fed will make any drastical comments on December 17th. They probably will not shake market before holidays and postpone new rhetoric to 2015. If market will remain below 1210 – this will confirm our thoughts. At the same time this will hint on further decreasing in the beginning of 2015, because December candle will be small and will look mostly as consolidation after big drop and preparation for downward continuation.
The major driving factor for Gold is inflation and particularly here US economy has problem. Although recent report has shown shy increase in wages, but inflation still stands flat. Accompanied by positive NFP numbers increasing chances on sooner rate hiking will be negative combination for gold. That’s why currently we do not see reasons yet to cancel our 1050$ target.
Weekly
Weekly chart again shows most important moments. On last week we’ve got another bearish grabber. So, now we have two of them in a row. Although market stands above MPP, but it has failed again pass through MPR1. This tells that bearish trend is still valid. Although there is just one butterfly drawn on the chart – we have two. But reaction on reaching 1.27 of minor butterfly, MPS1, Fib level and inner AB=CD pattern is coming to an end. Grabbers have minor target below 1130 lows that will be also MPS1. This, in turn means that stops will be grabbed and market will accelerate lower. Our next target for coming week is 1100 level. It includes 1.27 of large butterfly and inner 1.618 AB=CD target.
From pure technical approach we again meet with “1210 level” question. We will be able to return back to discussion of further gold appreciation only if market will erase grabbers and take out of current highs.
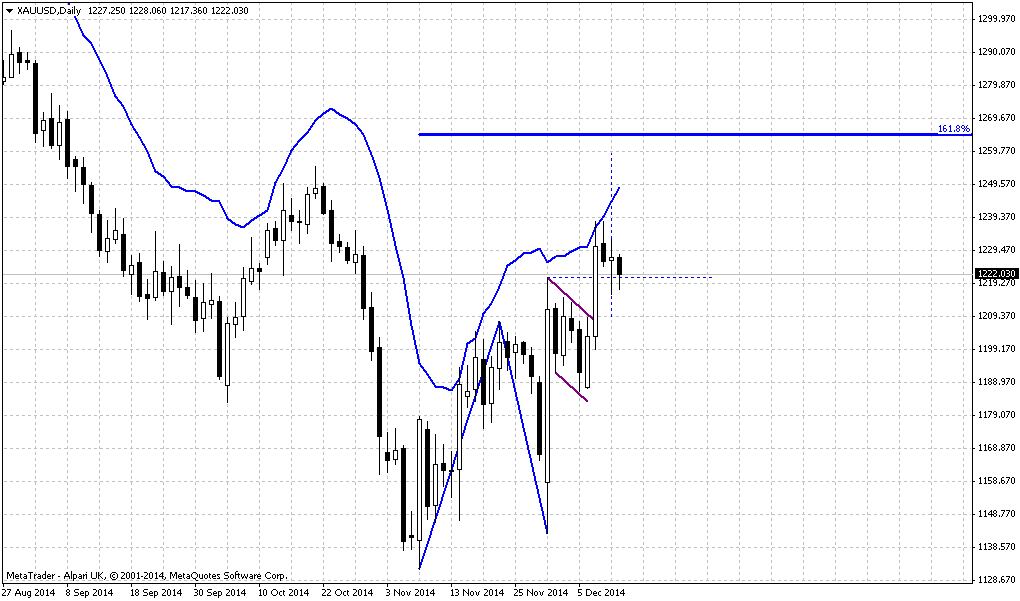
Daily
Picture on daily chart should be analyzed in relation to weekly one. Current top is in fact the top of bearish grabber on weekly chart. At the same time this top points on significant resistance level – gold has formed Agreement at K-resistance area. This, in turn gives us “222” Sell pattern as well.
Since this is simultaneously as strong resistance as top of bearish grabber – this level seems extremely important. Market has to pass through it to return bullish sentiment and expectations. This is also an area of MPR1 and moving above it will tell that bearish sentiment probably was broken. The only bullish moment here is the strength of recent upside action. CD leg has been completed with just 1 day. Fast CD leg very often suggests further upside continuation, but again to prove it market will have to take out of recent top.
Also it is possible that market will stay inside the range of big candle. This happens very often – big candle could hold action for considerable period of time, and usually direction will be determined by whether market will take out top or bottom of this big candle.
Short position here looks preferable by two reasons. First is, gold stands near strong resistance and has weekly grabber as background. Second – market stands very close to invalidation point of bearish setup. Taking long position seems not very logical, because we have bearish patterns in place. Better to wait when they will fail. Thus, currently we have just 1 choice – either taking short position or do nothing.
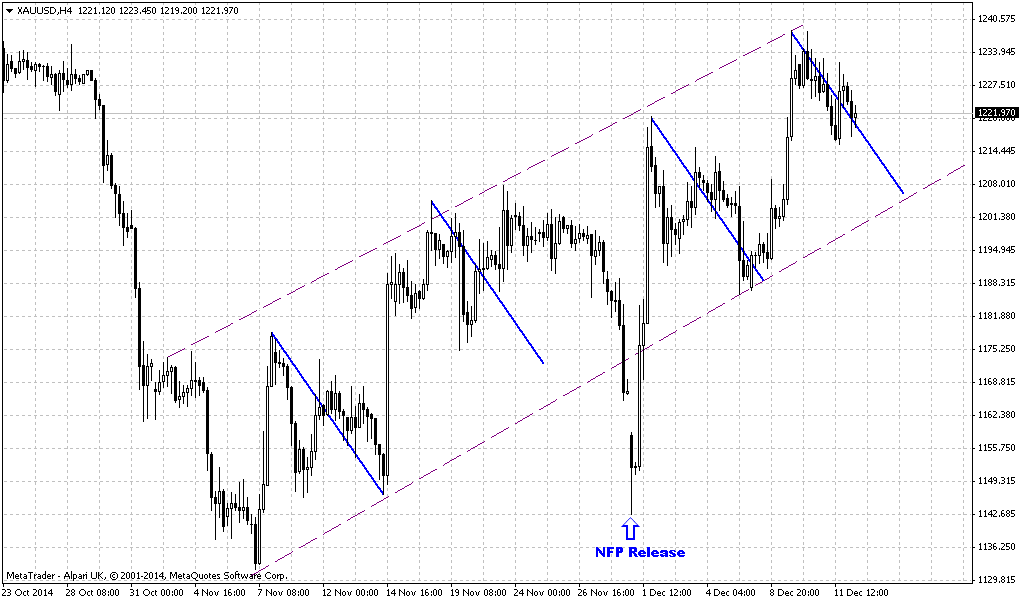
4-hour
This chart does not show any clear patterns and our major task on coming week is to understand what market intends to do, what direction it will choose. Here we probably should watch for 1185 area. This is former bottoms, also this will be WPP. Moving below it will increase chances on further downward action. Trend here is bearish already.
Although recent action seems as AB-CD retracement down, but market shows acceleration and this increases chances on further downward action. Chances on downward action exist, since we’ve estimated that recent rallies were triggered by short covering. As this procedure has limited effect – market needs real purchases to push it higher. But last CFTC data does not show any long increasing. As a result, market could move lower.
Conclusion:
Currently we have no reasons to refuse our previous analysis and expectation of reaching 1050 area in medium-term perspective. Yes, two big short-covering rally has happened within recent 2-3 weeks, but this does not look curious at the eve of the end of financial year and may be investors do not expect crucial breakout at the end of the year. Still, as buying activity still stagnates – it is difficult to expect upside breakout right now.
In short-term perspective we have bearish picture. Existing of bearish grabbers on weekly, “222” Sell on daily and inability of gold to pass through major 1210-1220 resistance, market could move lower in nearest future. Fed December 17th meeting could add some action, but somehow we think that Fed hardly will shake markets at the end of December. Anyway, using dry numbers – we will be able to speak on bullish perspectives if market will move above recent top.
The technical portion of Sive's analysis owes a great deal to Joe DiNapoli's methods, and uses a number of Joe's proprietary indicators. Please note that Sive's analysis is his own view of the market and is not endorsed by Joe DiNapoli or any related companies.