Sive Morten
Special Consultant to the FPA
- Messages
- 18,695
Fundamentals
As Reuters informs - gold rebounded from an early dip to a six-month low on short covering on Friday, but is still on track for its largest annual loss in 32 years, as the Federal Reserve's plan to scale back its monetary stimulus and expectations of narrower U.S. government deficits have weighed on bullion. The Fed said this week that the U.S. economy was strong enough to scale back its massive bond-buying stimulus, winding down an era of easy money that saw gold rally to an all-time high of $1,920.30 an ounce in 2011. The metal, a traditional inflation hedge and safe haven, also came under heavy selling pressure after the U.S. Congress reached a two-year budget deal earlier in the week, which is set to ease automatic spending cuts and reduce the risk of a government shutdown. "There is a real fundamental logic behind the selloff in gold, and it comes down to a real change in the way governments look at financing their activities as they are becoming more responsible," said Rob Lutts, chief investment officer of Cabot Money Management which has $550 million in client assets. "People are now saying there is no need for gold as a protection as much," Lutts said.
Spot gold hits its lowest since June on Friday at $1,185.10 an ounce, closing in on a 3-1/2-year low reached on June 28. The market clawed back some ground later in the session, up 1 percent at $1,202 by 2:53 p.m. EST on a combination of short covering and physical buying, traders said. Option traders said there was limited buying of puts and other strategies to protect downside risk, while all eyes are on a possible sharp pullback if prices break below the June low of $1,180.71.
FUND MANAGERS BEARISH
Bullman Asset Management manager Nick Bullman said that gold could fall further as the Fed has only just started to taper, and investors have become very negative towards the metal because there is no sign of inflation. "We are in an environment where we are going to need a much bigger problem in the world than we foresee for gold to recapture any of its lustre," Baring Asset Management investment manager Andrew Cole said.
As a gauge of investor sentiment, holdings in the SPDR Gold Trust <GLD>, the world's largest gold-backed exchange-traded fund, fell 3.90 tonnes to 808.72 tonnes on Thursday, the lowest in nearly five years. Outflows from the top eight gold ETFs have totalled about 720 tonnes as investors channel more money to equities.
I didn’t find new CFTC numbers, guys, so the chart is the same as on previous week. Data shows strong contraction of net long position with falling open interest – the same information as CME futures trading volume, right? It means that traders just stand in process of closing existing long positions but do not take new ones. Currently it is difficult to say – whether this is a preparation for financial year end or this indicates some possibility of upward action.
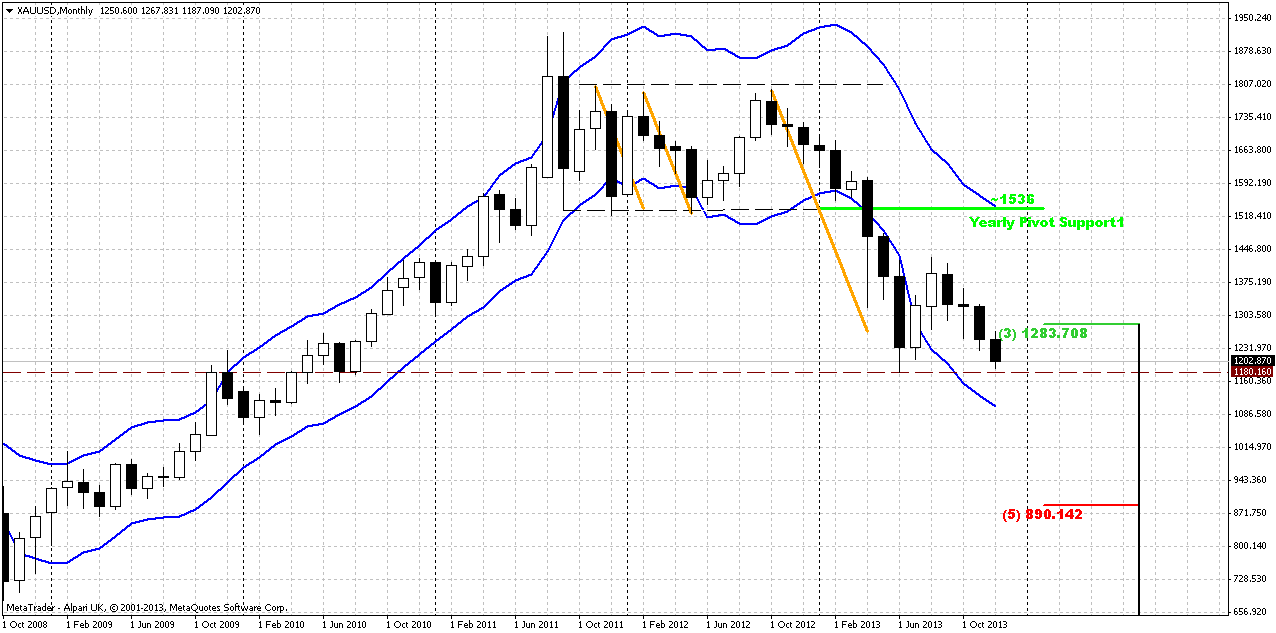
Monthly
Market slowly but stably moves lower here. There was no outstanding action on previous week, thus, we hardly could see any changes on monthly chart. Chances on appearing of possible upward AB=CD are melting week by week. Market has moved and closed below October lows. Fundamental situation and CFTC data stand not in favor of possible appreciation. As market was significantly oversold we’ve suggested retracement up. Thus, we’ve made an assumption of possible deeper upward retracement that could take a shape of AB=CD, and invalidation for this setup is previous lows around 1170s. If market will pass through it, then, obviously we will not see any AB=CD up. And now, as market has broken through 1250, next target is precisely previous lows around 1180 – price almost has achieved it. In fact this will be the last chance for possible upward bounce, if, say, market will show something like double bottom. Price is not at oversold right now and not at major support, so really bearish market should reach previous lows level. Gold will be jiggered if it wouldn’t test previous lows, since this is very typical for gold market. That’s being said – primary object for monitoring right now is price action around previous lows. Whether we will see true breakout or it will be failure break and wash&rinse of lows. Latter action in general is very typical for double bottoms and fake breakout could be the first sign of possible retracement up.
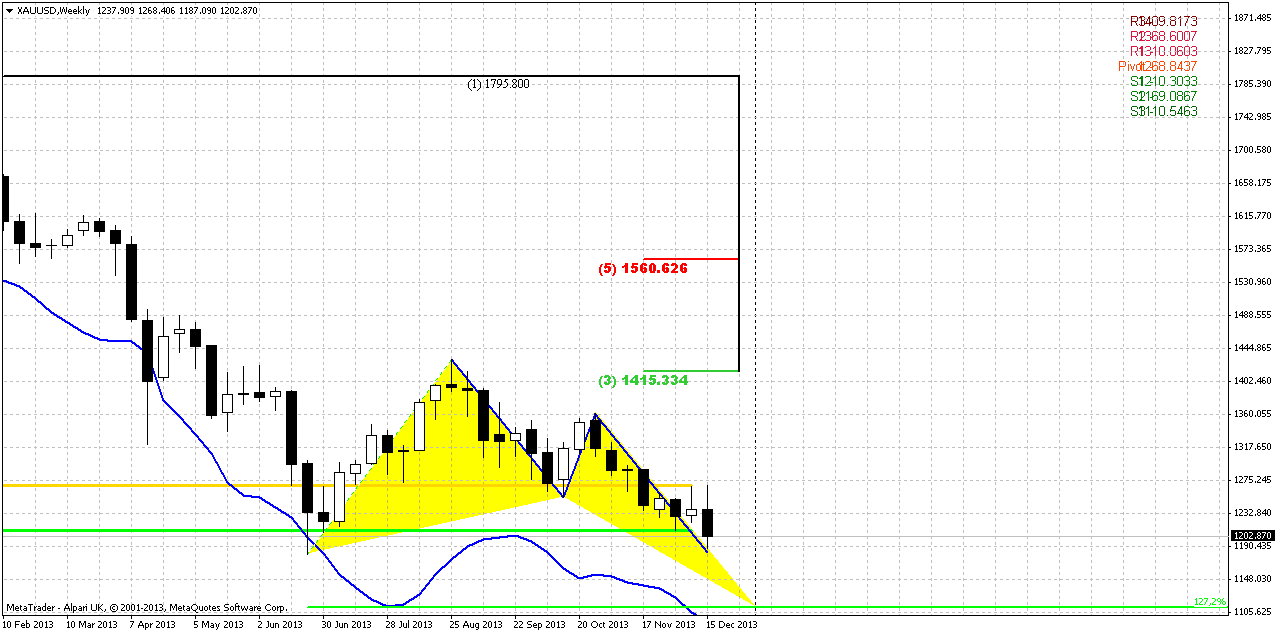
Weekly
Overall context here is bearish as well. As we’ve said previously, price has broken through major 5/8 Fib support here. FOMC decision has led to further downward continuation, but market significantly has reduced the pace – either due end of the year or due changing situation on the market. At the same time SPDR fund data and overall fundamental picture still shows bearish sentiment on the market.
Concerning targets – they are the same. First is previous lows and target of AB-CD down. More extended target, if price will not only clear out lows but hold below it – possible butterfly “buy” around 1100 area. I suspect that we should be ready at minimum to clear out of previous lows.
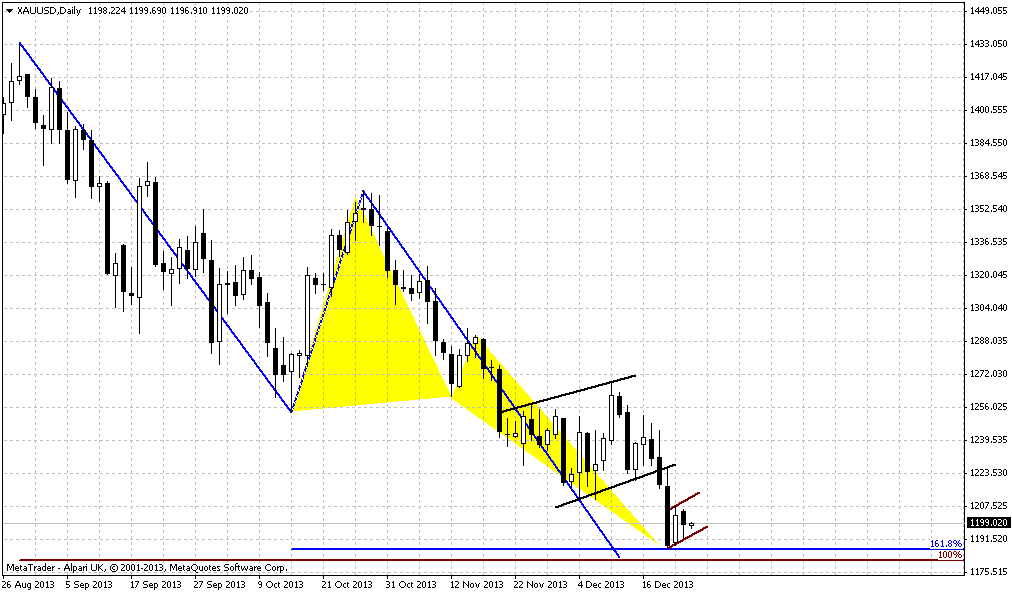
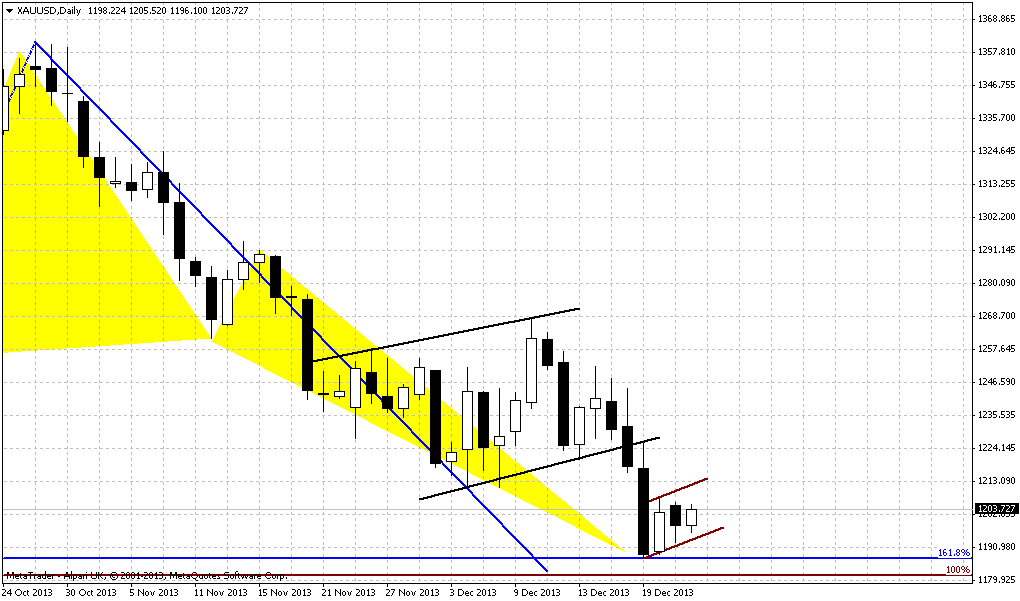
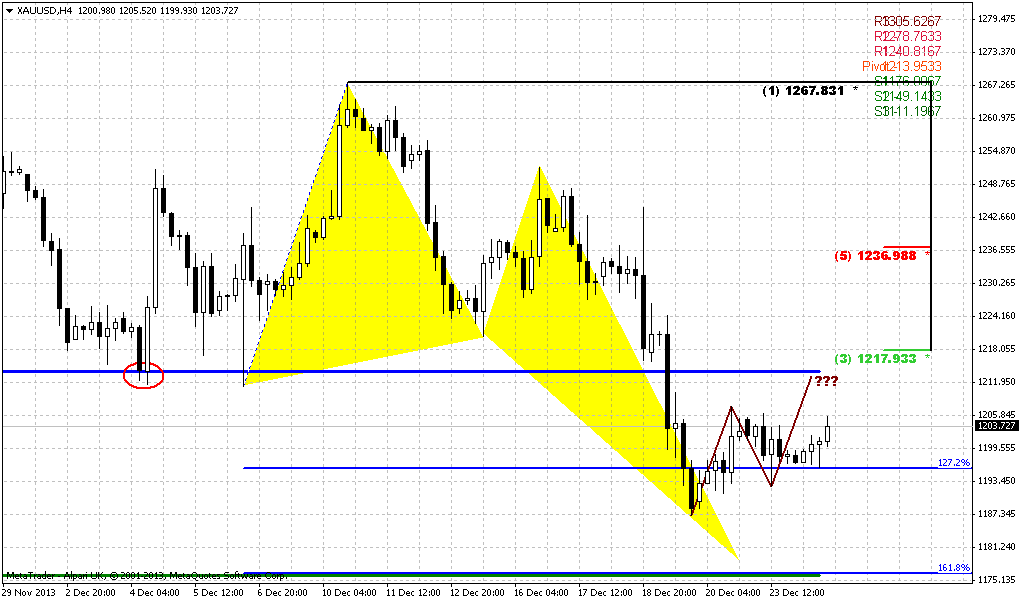
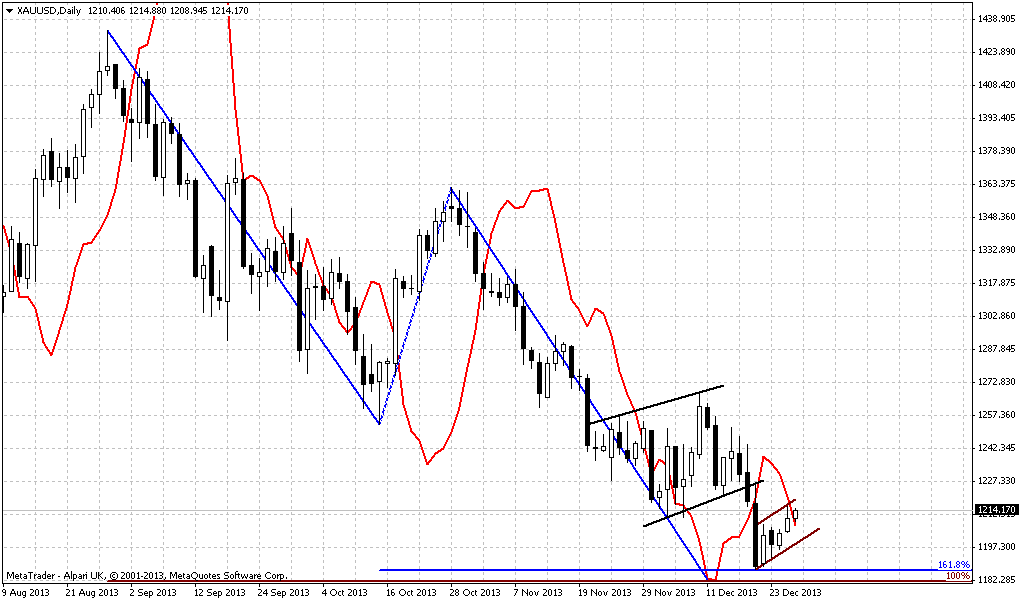
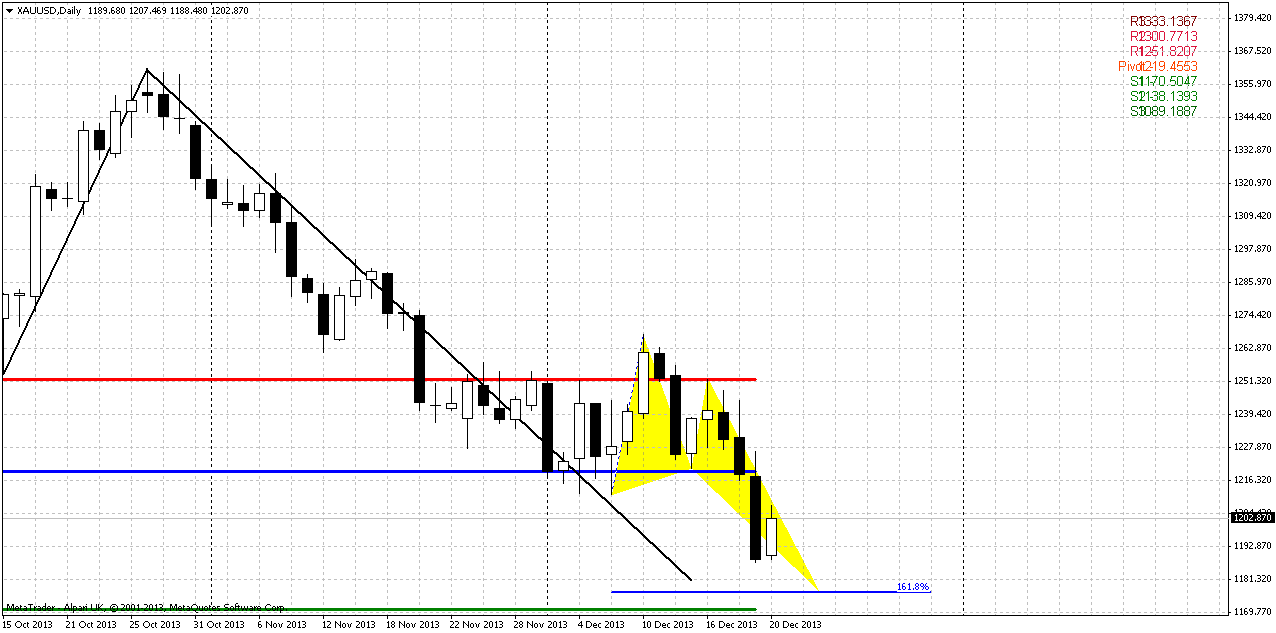
Daily
Trend here is bearish as well, market just hangs above the target and gradually is forming butterfly “buy” pattern. As market has achieved 1.27 extension too fast, this usually means that market will continue to 1.618 target at minimum. Existing of butterfly lets us approximately estimate minimum downside target – 1165-1170 area. It includes daily AB=CD target, butterfly and WPS1 for coming week. Thus, if it will be fake breakout, market probably should stop somewhere around 1165-1170 area. As we have a lot of stop orders right under 1180 – as they will be triggered, market will accelerate lower and probably will reach specified levels.
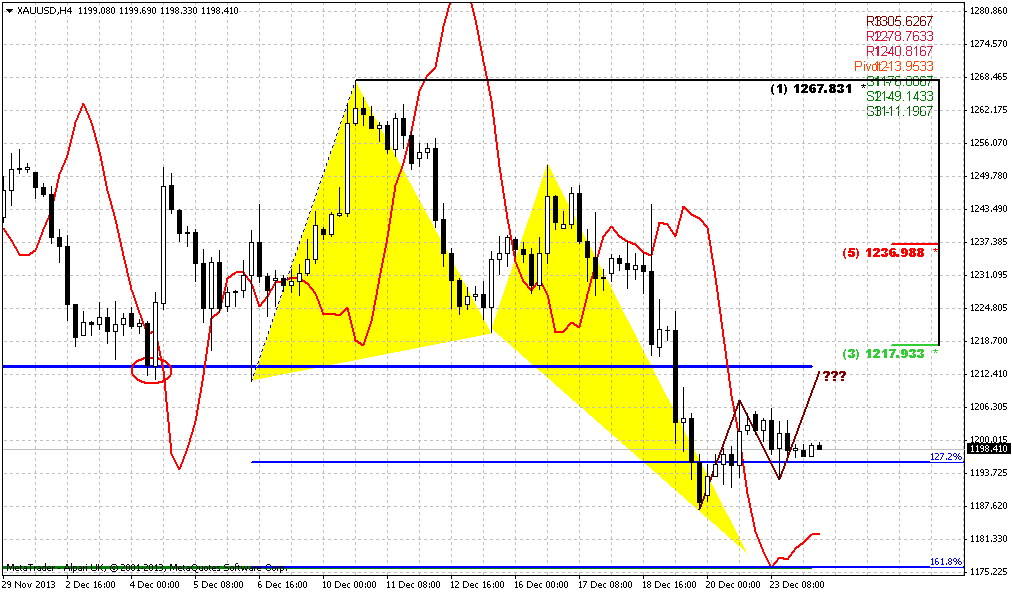
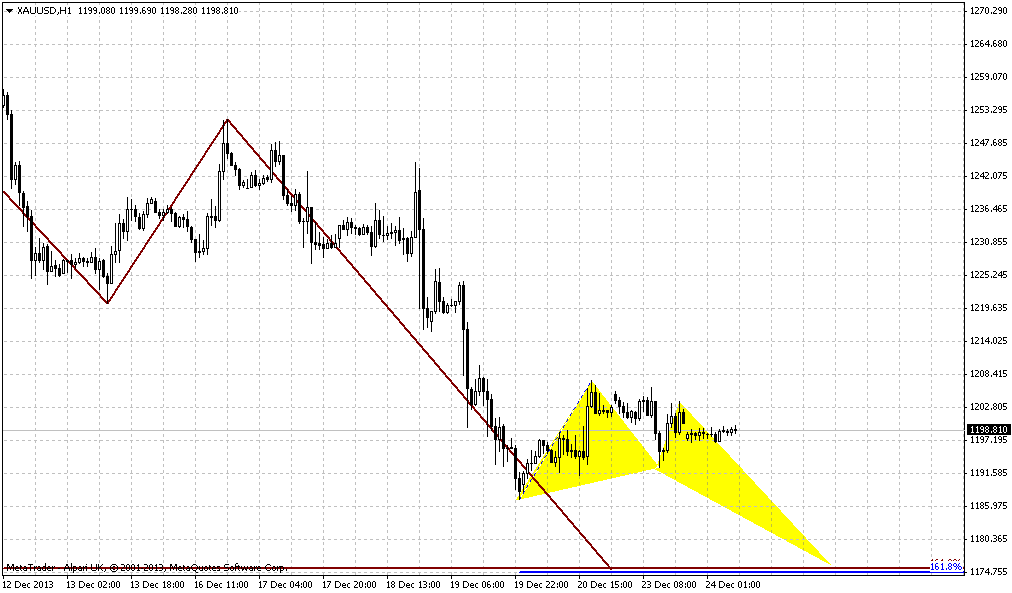
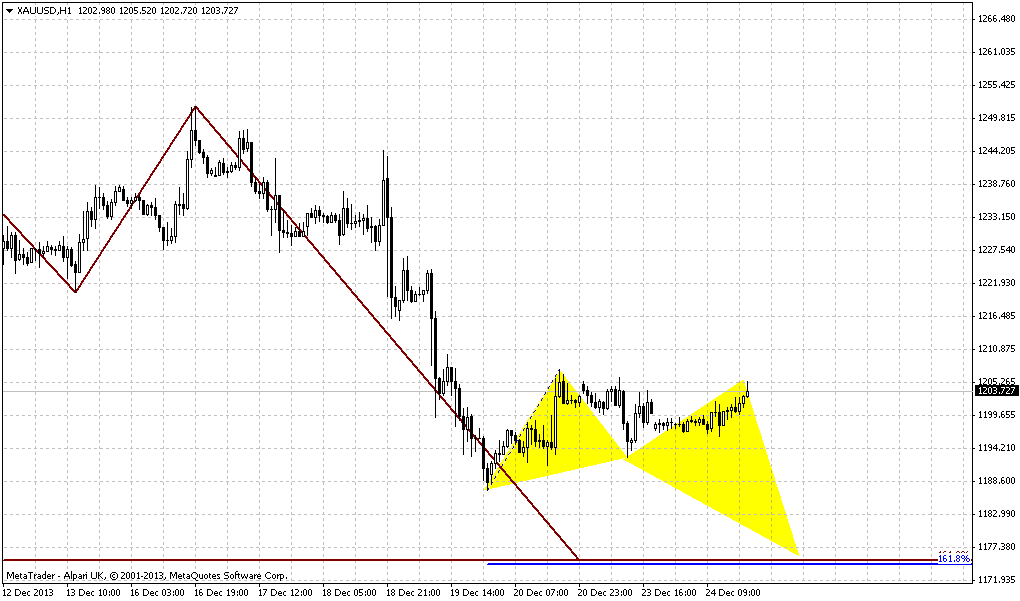
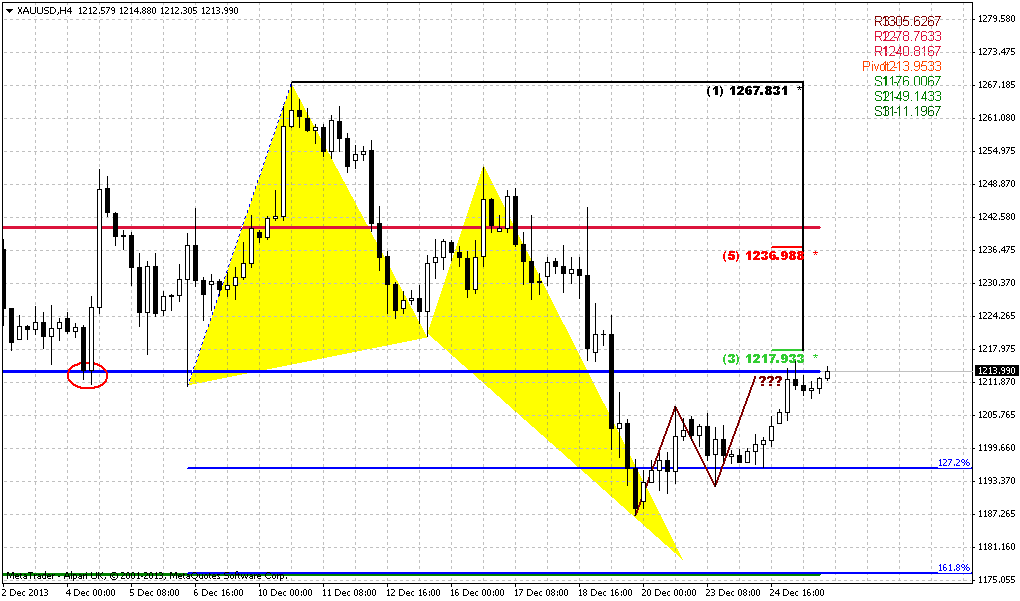
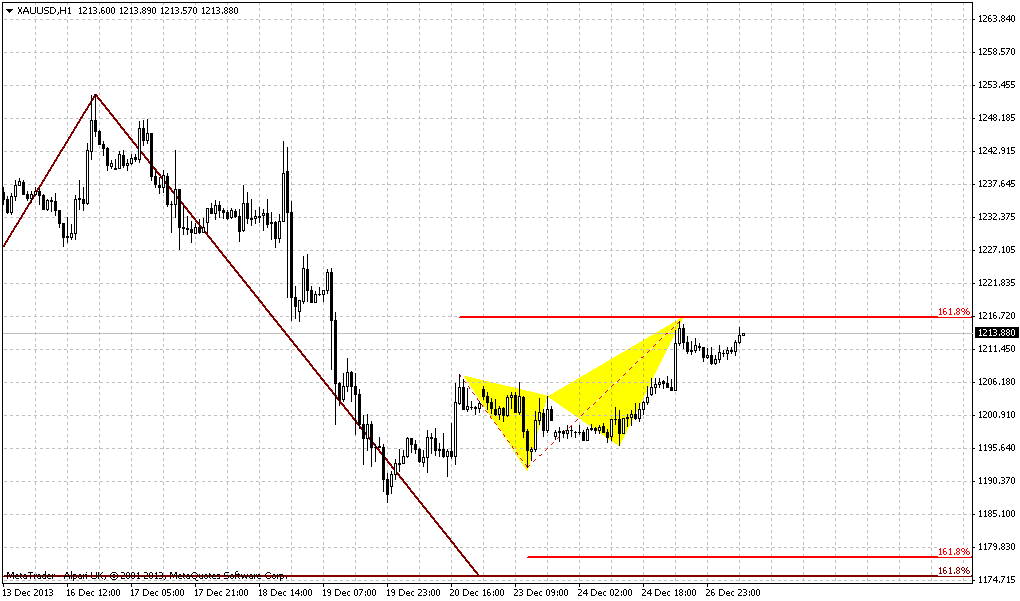
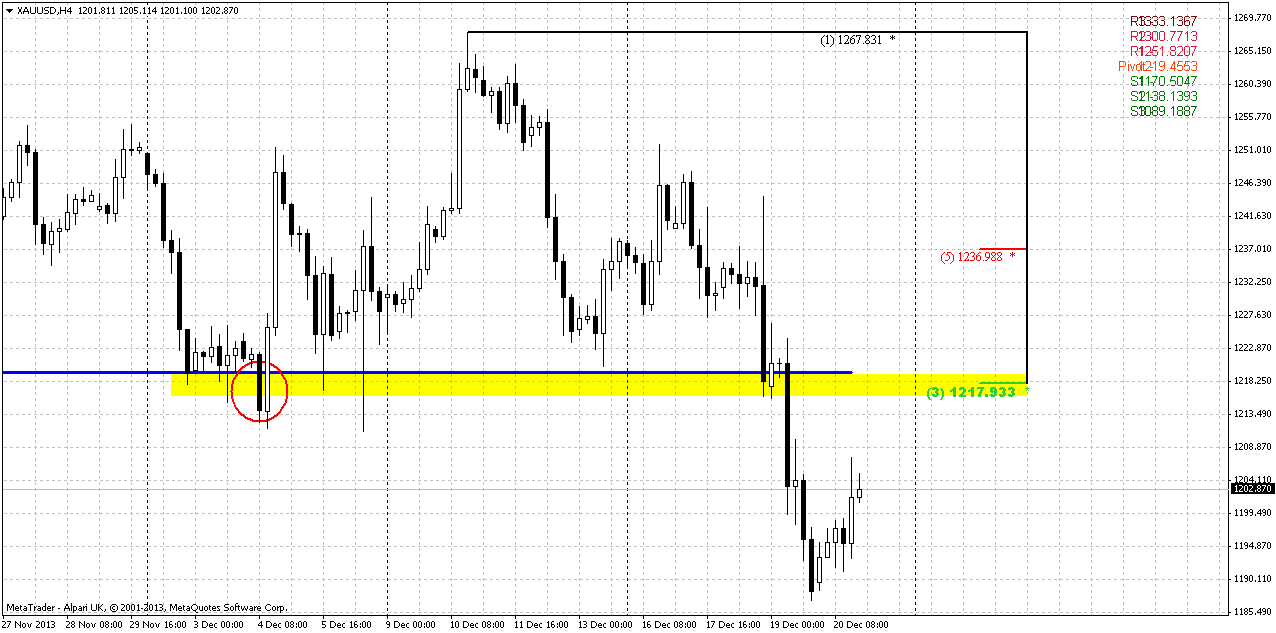
B]4-hour[/B]
In very short-term perspective, it is possible that market will show a bit higher move up. There are two reasons for that. First is existing of WPP around 1220 area, second – the habit of gold market to re-test broken supports. Also this level includes major 3/8 Fib resistance level. Also, if you will take a look at hourly chart, you’ll see that latest candle was really fast there and this point on possible upward continuation. Anyway, guys, despite how it will happen – the core stands the same – we expect turmoil around 1180s lows.
Conclusion:
Market still holds bearish in a long-term and slowly but stably drifts lower. In short term perspective closing of financial year could hold investors from strong action and taking large directional position. This already could be seen from most recent CFTC report and CME trading volumes data.
In short-term perspective we expect challenge of 1180 lows, very probably it will happen till the end of the year. Depending on whether this will be true or fake breakout we will be able to discuss further action.
The technical portion of Sive's analysis owes a great deal to Joe DiNapoli's methods, and uses a number of Joe's proprietary indicators. Please note that Sive's analysis is his own view of the market and is not endorsed by Joe DiNapoli or any related companies.
As Reuters informs - gold rebounded from an early dip to a six-month low on short covering on Friday, but is still on track for its largest annual loss in 32 years, as the Federal Reserve's plan to scale back its monetary stimulus and expectations of narrower U.S. government deficits have weighed on bullion. The Fed said this week that the U.S. economy was strong enough to scale back its massive bond-buying stimulus, winding down an era of easy money that saw gold rally to an all-time high of $1,920.30 an ounce in 2011. The metal, a traditional inflation hedge and safe haven, also came under heavy selling pressure after the U.S. Congress reached a two-year budget deal earlier in the week, which is set to ease automatic spending cuts and reduce the risk of a government shutdown. "There is a real fundamental logic behind the selloff in gold, and it comes down to a real change in the way governments look at financing their activities as they are becoming more responsible," said Rob Lutts, chief investment officer of Cabot Money Management which has $550 million in client assets. "People are now saying there is no need for gold as a protection as much," Lutts said.
Spot gold hits its lowest since June on Friday at $1,185.10 an ounce, closing in on a 3-1/2-year low reached on June 28. The market clawed back some ground later in the session, up 1 percent at $1,202 by 2:53 p.m. EST on a combination of short covering and physical buying, traders said. Option traders said there was limited buying of puts and other strategies to protect downside risk, while all eyes are on a possible sharp pullback if prices break below the June low of $1,180.71.
FUND MANAGERS BEARISH
Bullman Asset Management manager Nick Bullman said that gold could fall further as the Fed has only just started to taper, and investors have become very negative towards the metal because there is no sign of inflation. "We are in an environment where we are going to need a much bigger problem in the world than we foresee for gold to recapture any of its lustre," Baring Asset Management investment manager Andrew Cole said.
As a gauge of investor sentiment, holdings in the SPDR Gold Trust <GLD>, the world's largest gold-backed exchange-traded fund, fell 3.90 tonnes to 808.72 tonnes on Thursday, the lowest in nearly five years. Outflows from the top eight gold ETFs have totalled about 720 tonnes as investors channel more money to equities.
I didn’t find new CFTC numbers, guys, so the chart is the same as on previous week. Data shows strong contraction of net long position with falling open interest – the same information as CME futures trading volume, right? It means that traders just stand in process of closing existing long positions but do not take new ones. Currently it is difficult to say – whether this is a preparation for financial year end or this indicates some possibility of upward action.
Monthly
Market slowly but stably moves lower here. There was no outstanding action on previous week, thus, we hardly could see any changes on monthly chart. Chances on appearing of possible upward AB=CD are melting week by week. Market has moved and closed below October lows. Fundamental situation and CFTC data stand not in favor of possible appreciation. As market was significantly oversold we’ve suggested retracement up. Thus, we’ve made an assumption of possible deeper upward retracement that could take a shape of AB=CD, and invalidation for this setup is previous lows around 1170s. If market will pass through it, then, obviously we will not see any AB=CD up. And now, as market has broken through 1250, next target is precisely previous lows around 1180 – price almost has achieved it. In fact this will be the last chance for possible upward bounce, if, say, market will show something like double bottom. Price is not at oversold right now and not at major support, so really bearish market should reach previous lows level. Gold will be jiggered if it wouldn’t test previous lows, since this is very typical for gold market. That’s being said – primary object for monitoring right now is price action around previous lows. Whether we will see true breakout or it will be failure break and wash&rinse of lows. Latter action in general is very typical for double bottoms and fake breakout could be the first sign of possible retracement up.
Weekly
Overall context here is bearish as well. As we’ve said previously, price has broken through major 5/8 Fib support here. FOMC decision has led to further downward continuation, but market significantly has reduced the pace – either due end of the year or due changing situation on the market. At the same time SPDR fund data and overall fundamental picture still shows bearish sentiment on the market.
Concerning targets – they are the same. First is previous lows and target of AB-CD down. More extended target, if price will not only clear out lows but hold below it – possible butterfly “buy” around 1100 area. I suspect that we should be ready at minimum to clear out of previous lows.
Daily
Trend here is bearish as well, market just hangs above the target and gradually is forming butterfly “buy” pattern. As market has achieved 1.27 extension too fast, this usually means that market will continue to 1.618 target at minimum. Existing of butterfly lets us approximately estimate minimum downside target – 1165-1170 area. It includes daily AB=CD target, butterfly and WPS1 for coming week. Thus, if it will be fake breakout, market probably should stop somewhere around 1165-1170 area. As we have a lot of stop orders right under 1180 – as they will be triggered, market will accelerate lower and probably will reach specified levels.
B]4-hour[/B]
In very short-term perspective, it is possible that market will show a bit higher move up. There are two reasons for that. First is existing of WPP around 1220 area, second – the habit of gold market to re-test broken supports. Also this level includes major 3/8 Fib resistance level. Also, if you will take a look at hourly chart, you’ll see that latest candle was really fast there and this point on possible upward continuation. Anyway, guys, despite how it will happen – the core stands the same – we expect turmoil around 1180s lows.
Conclusion:
Market still holds bearish in a long-term and slowly but stably drifts lower. In short term perspective closing of financial year could hold investors from strong action and taking large directional position. This already could be seen from most recent CFTC report and CME trading volumes data.
In short-term perspective we expect challenge of 1180 lows, very probably it will happen till the end of the year. Depending on whether this will be true or fake breakout we will be able to discuss further action.
The technical portion of Sive's analysis owes a great deal to Joe DiNapoli's methods, and uses a number of Joe's proprietary indicators. Please note that Sive's analysis is his own view of the market and is not endorsed by Joe DiNapoli or any related companies.