Sive Morten
Special Consultant to the FPA
- Messages
- 18,695
Fundamentals
Weekly Gold Tading Report prepared by Sive Morten exclusively for ForexPeaceArmy.com
Reuters reports, Gold Gold rose the most in 2-1/2 weeks on Friday in thin post-Christmas trading, boosted by short-covering after China's central bank was reported to be considering a loosening of liquidity requirements at the country's banks.
Spot gold gained 2.1 percent to a session high of $1,199.00 an ounce, supported by an increase in crude oil prices. The gain eased slightly as oil prices turned negative and the U.S. dollar rose against a basket of currencies.
Gold prices were buoyed throughout the day by news reports that China, the world's top consumer of gold, was considering a policy change to reinvigorate the economy by allowing banks to have more money available for lending and investment.
The possibility of easier lending in China, the top consumer of many raw materials, prompted investors to cover short positions in gold.
"The surprise let-up in Chinese tightening may actually help gold because that is where the investors will turn," said George Gero, precious metals strategist for RBC Capital Markets in New York.
Gold triggered buy-stops after crossing $1,180 a lb, but encountered resistance at the 20-day moving average just below $1,200 a lb, Gero said.
A slowdown in Chinese growth has weakened physical demand for many commodities, including metals.
Liquidity remained thin the day after the Christmas holiday as key markets such places as Australia, Hong Kong, Singapore and the UK were closed on Friday. New York trading was open.
Despite Friday's gains, investor sentiment toward the metal is unlikely to improve in the first few months of 2015, as markets expect the U.S. economy to show continued signs of strength that will lead the Federal Reserve to start increasing interest rates.
Higher rates weigh on non-interest-bearing bullion.
CFTC data gives no update on 23rd of December, thus the last numbers are those that stand on 16th of December. As longs as shorts were contracted a bit. Thus, major sentiment shifting has happened 2 weeks ago. We’ve seen mass short covering, and then CFTC showed increasing in speculative long positions and shy growth of open interest.
Here is detailed breakdown of speculative positions:
Open interest:
 Shorts:
 Longs:

So, guys, recent chill out in upside rally looks worrying. It has started rather well, but faded out rather fast. Currently it is not quite clear whether the reason is Xmas and end of financial year or indeed it was just retracement. It is difficult to argue with the facts – SDPR is stagnating, CFTC also does not support yet big shift that have happened 3 weeks ago and finally - spot market in Asia gives discounts to London quotes. This is not typical situation at all. Big players still expect that gold will remain under pressure. That’s being said it looks like our major target is to not overestimate recent events. It could happen so that bearish positions will be re-established in January, but if they not – this indeed will be sign of shifting sentiment on gold market. Also we do not expect any solid activity till the end of the year. Probably market will remain thin, quiet and lazy a bit.
Technicals
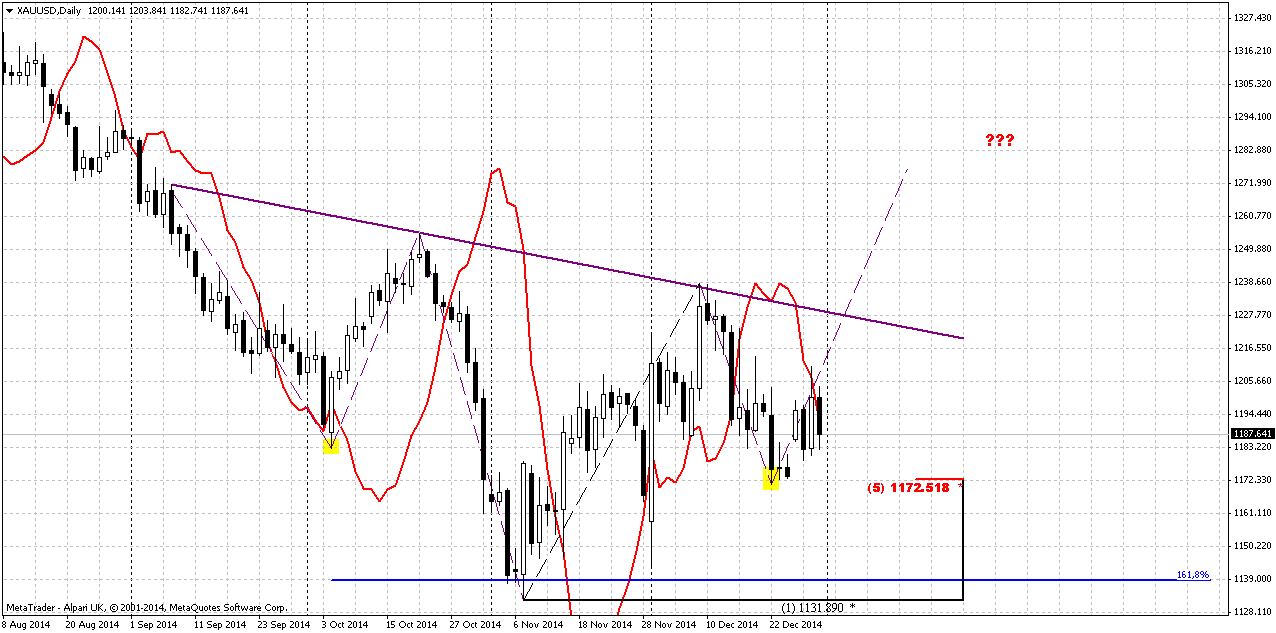
Monthly
It is difficult to add something really new here, on monthly chart, since market has closed just 30 cents higher compares to previous week. Currently we have last big pattern in progress that is Volatility breakout (VOB). It suggests at least 0.618 AB-CD down. And this target is 1050$.
On previous week we’ve said monthly chart has lost its piquancy. Bullish grabber has not been formed. In December we could get either just trend shifting back to bullish, or bearish grabber that will suggest further downward action. Massive closing of short positions could mean that December might become quiet month. Investors have contracted their positions significantly, pointing that they do not believe in soon downward breakout but also do not fascinating with upside perspectives. Most probable explanation is reducing positions before year end, bonuses calculation and long holidays.
The major driving factor for Gold is inflation and particularly here US economy has problem. Although recent report has shown shy increase in wages, but inflation still stands flat. Accompanied by positive NFP numbers increasing chances on sooner rate hiking will be negative combination for gold. That’s why currently we do not see reasons yet to cancel our 1050$ target. Commerzbank analyst also think that gold will remain under pressure in the first half of 2015 with 1100$ target.
At the same time guys we see some structural shifts in market sentiment and just can’t ignore it. Hardly could we call mass short covering, increasing longs and SDPR storage just occasional. That’s why although we probably keep our long-term target at 1050$ for awhile, but in short-term perspective we do not exclude deeper retracement to 1265$ area. Recently this tendency has paused a bit, but January will give the answer – either it will continue or short positions will be re-established and market indeed will continue move down. Right now situation is too contradictive to say definitely what direction will be chosen. Following to pure technical picture we could say that gold keeps chances as for possible 1265$ action as for 1050$ just because gold stands at the edge and goes nowhere.

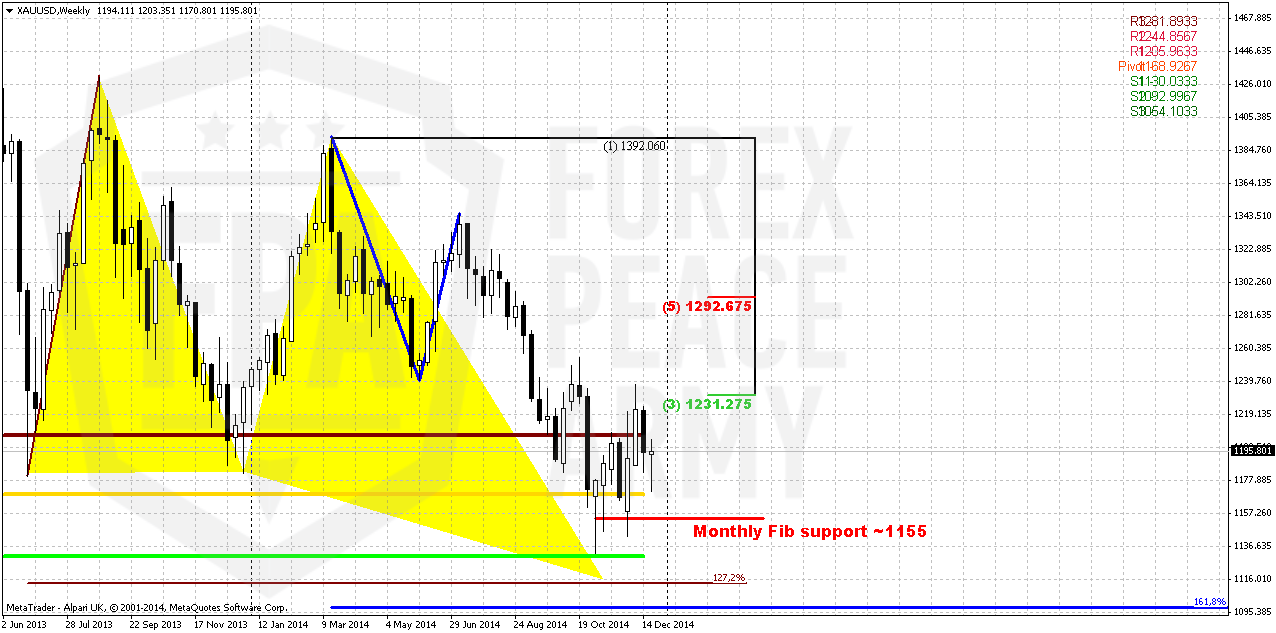
Weekly
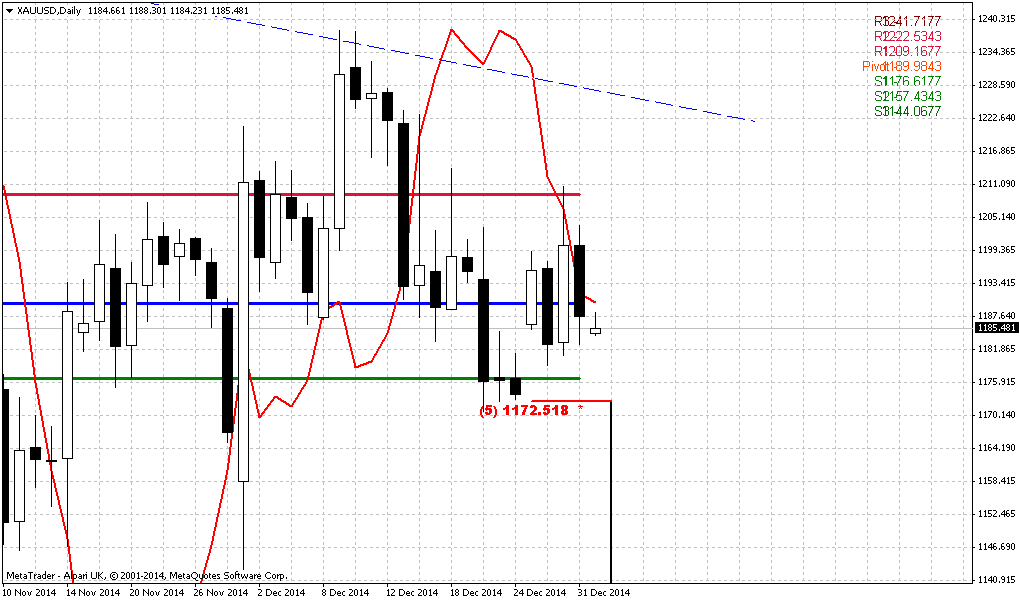
Due holidays market just has made an attempt to move higher, re-test MPP and returned right back up. Trend holds bullish here. Initial reaction of AB=CD completion point and monthly Agreement now looks not as impressive as previously. It is slowed and become more choppy with long shadows as to upside as to downside. Market has returned right back down below MPR1. Now it does not look really as upside impulse action and reversal, right? Taking into consideration recent fundamental data and existence of untouched butterfly and 1.618 AB-CD targets, downward continuation seems not impossible. Besides, recent action is starting to remind flag shape that suggests downside continuation. That’s being said, when market reaches significant support area but reaction on this event is mild – logically to suggest possible further downward continuation. Market really looks heavy and can’t just jump off from support area.
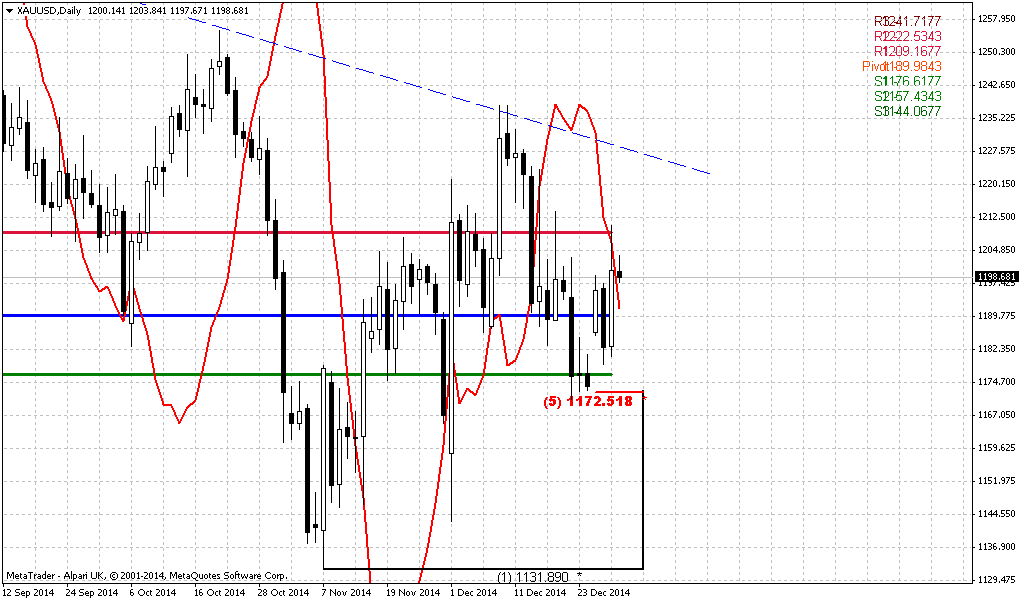
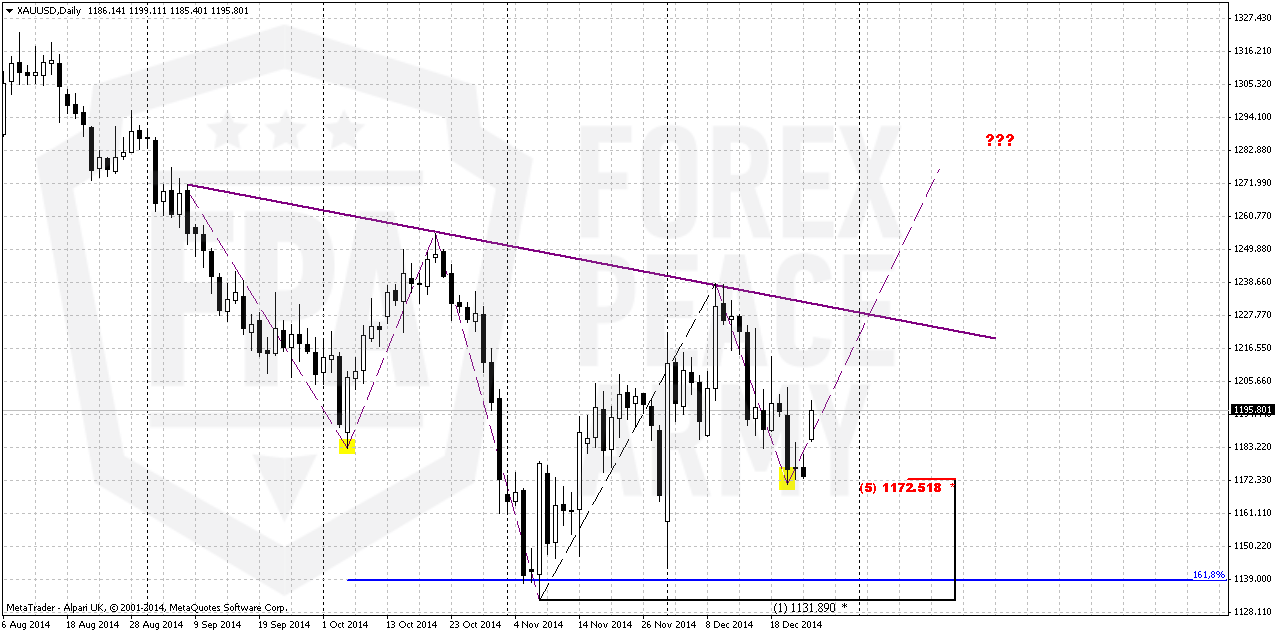
Daily
Trend still stands bearish. WE see the same pattern that could become starting moment for any upside action. On previous week we’ve mentioned that recent slowing of gold to start upside action could be bearish sign, since this is not typical for normal development of H&S pattern. At the bottom of right shoulder bulls should take total control on market and upside action should take the signs of impulse move up. Here we do not see it yet. Besides, on the down slope of right shoulder we see solid sell-off, acceleration. This is also not very good moment…
Still, upside action has started despite thin market. Now we need just to see how stable this action will be. Currently we do not see any flaws in shape and behavior of H&S pattern. We need to get some serious failure of this pattern to start speak about bearish continuation. For example, if market will return right back down and break through 1170 area or reach neckline but will fail at breakout of it and return right back down.
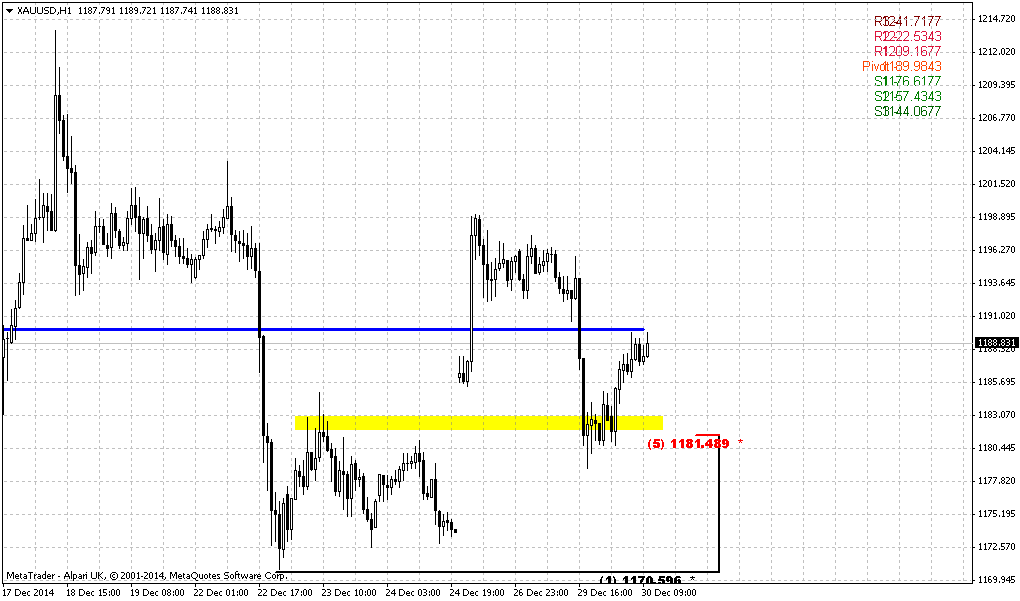
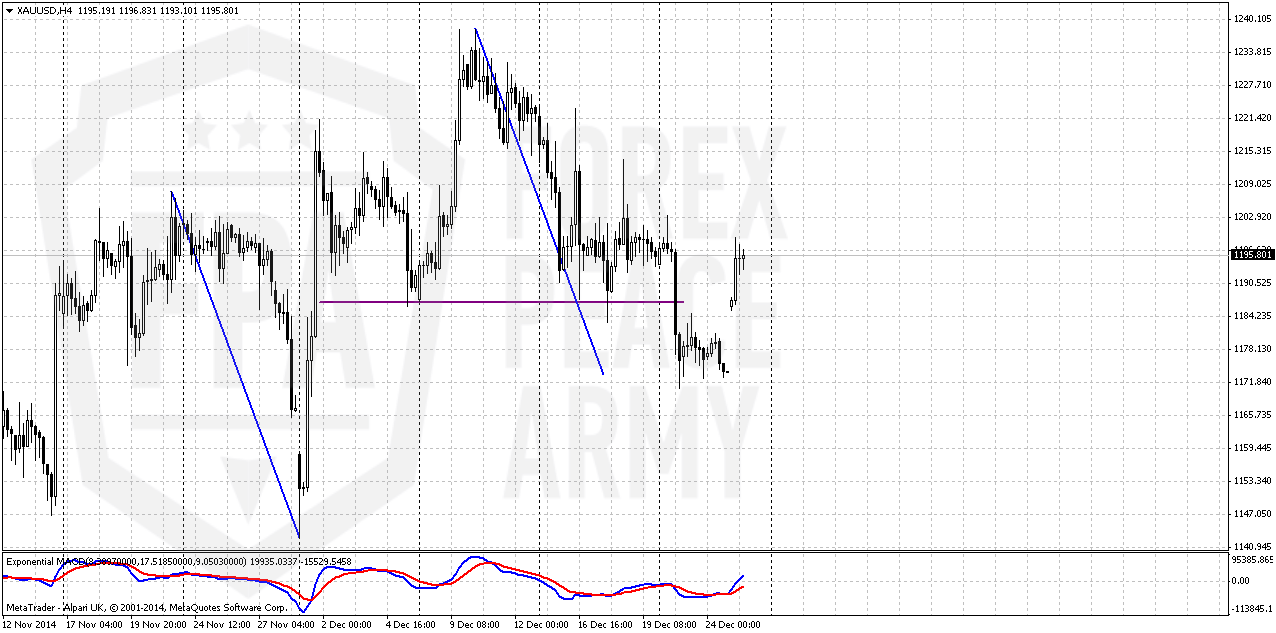
4-hour
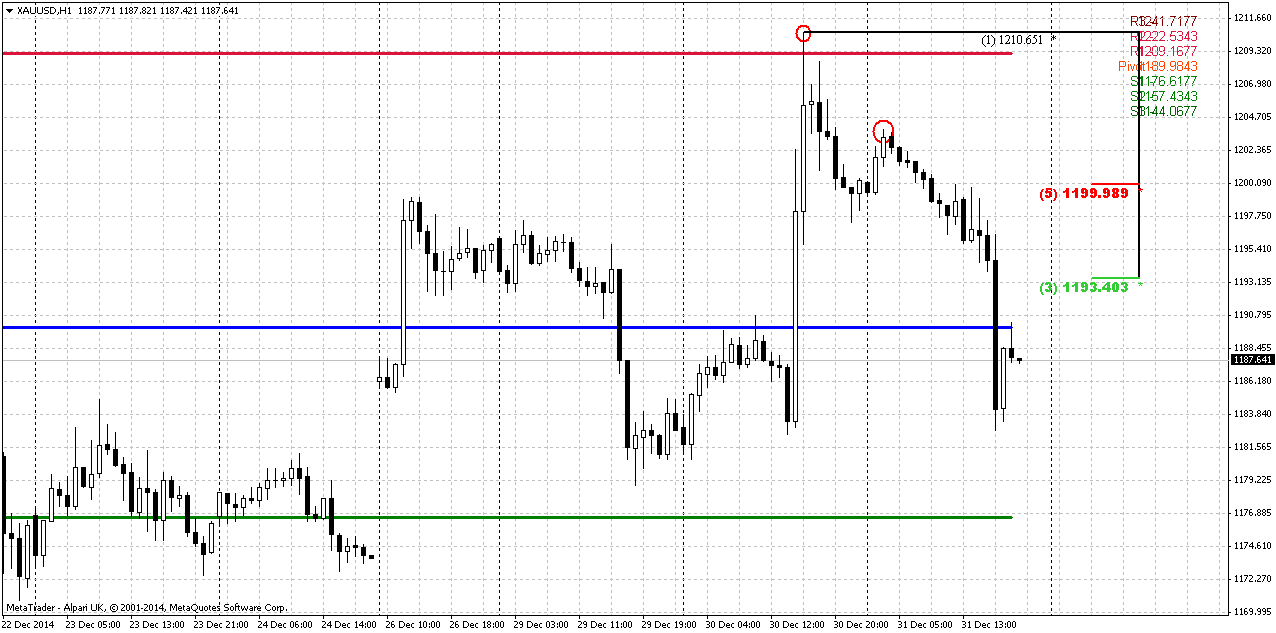
Despite that we’ve called this H&S pattern “ugly” it has worked nice and market has reached major 5/8 daily Fib support. Simultaneously gold has completed downward harmonic swing that initially has appeared on NFP release. And right now market has returned right back above neckline of H&S pattern. If market would be totally bearish – this H&S probably should trigger real reversal and downward continuation. While right now gold mostly shows opposite action. That’s why guys, we just have no reasons yet for taking any short positions here. If you doubt possible upside action - then it is better to stay flat. We also can’t say that this bullish setup looks tremendously attractive. But this is only setup that we have by far here.
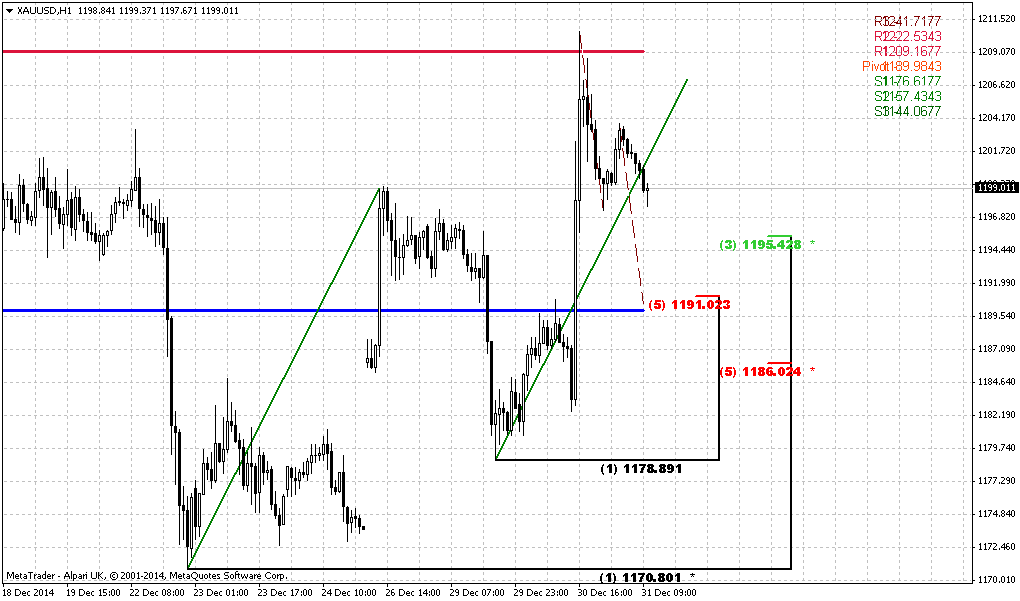
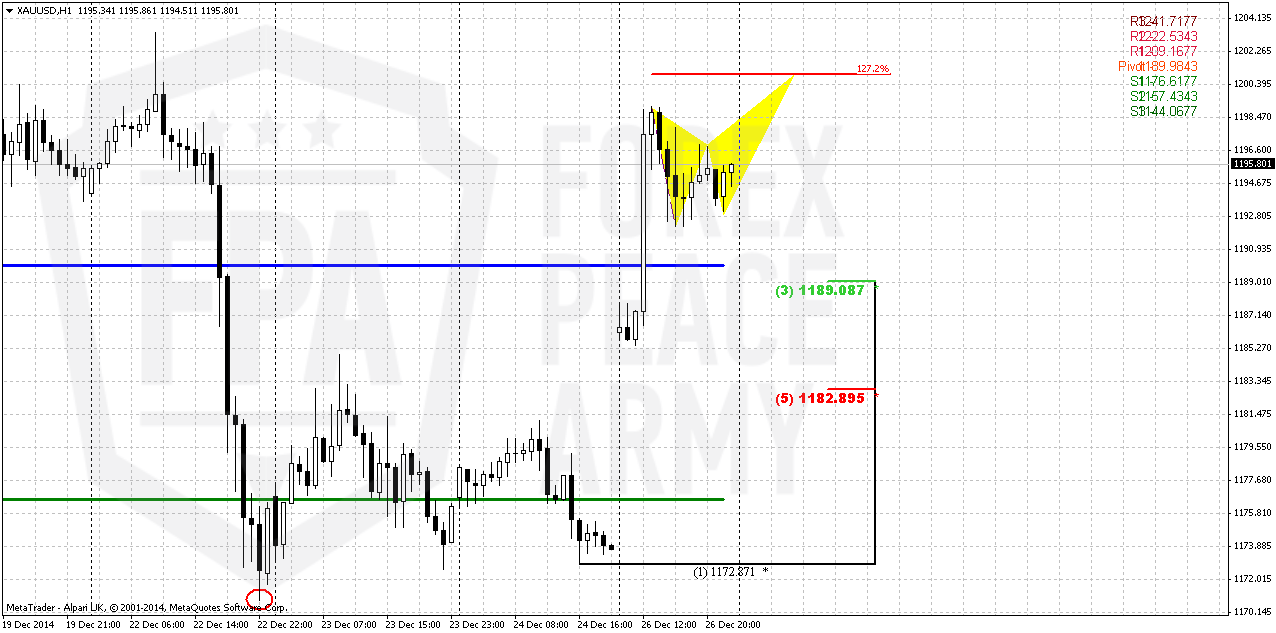
Hourly
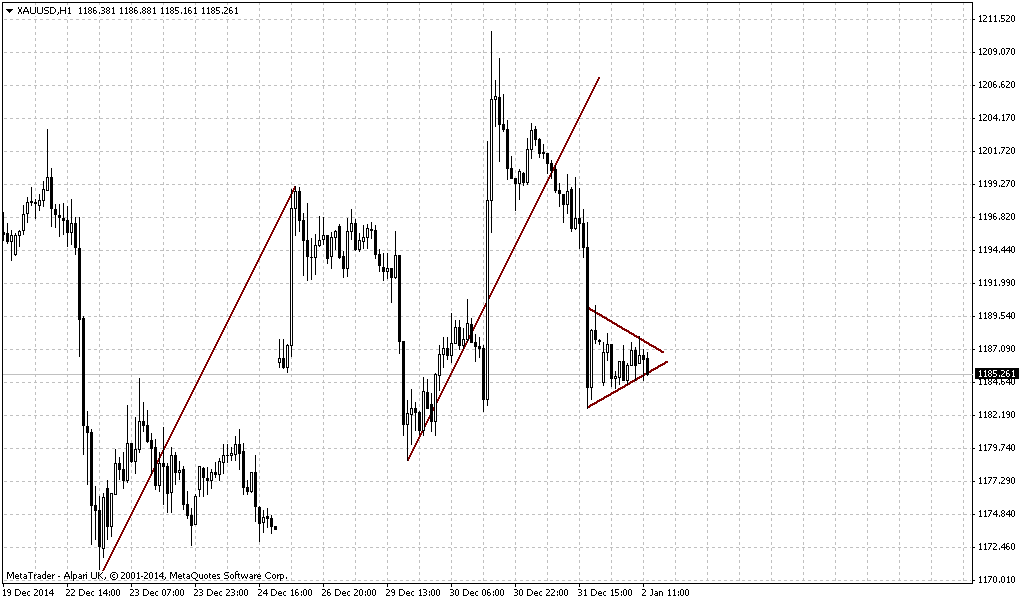
In fact, guys, as you probably understand we have only one choice – either to ignore this setup or to take it, since we do not have bearish setups yet. And to be honest, ignoring may be not bad choice at all. Still, as we have only this setup, let’s discuss how we could trade it. First is our invalidation point stands at current lows 1170’s. Market will open near WPP and could start retracement immediately or to form some reversal pattern first, say, butterfly “Sell” as it is shown on picture. 1190 seems important support level, because it includes as WPP as Fib support. But market also could show deeper retracement to 1182 and re-test previous top. As market stands choppy recently and still will remain thin before New Year’s Day, we need to minimize potential loss. Thus, chances on reaching 1182 level seem not bad.
Conclusion:
Since market still keeps normal bearish tendency we should not refuse our 1050 target yet. Recent data shows some chill out in further upside sentiment. Currently it is not quite clear whether the reason is just end of the year and Xmas or really something is changing in big sentiment. Recent data suggests that first variant is more probable by far. Technical picture also does not look rock hard bullish. January will probably clarify some moments.
In short-term perspective market gives us no choice. Despite how strong our bearish suspicious area – we do not have clear bearish setup. Bullish setup in turn, also looks not very fascinating, but this is the only setup that we have here. Thus, if we will get entry point with minimal risk, we could think about taking long position…or just ignore this setup and wait for more valuable patterns.
The technical portion of Sive's analysis owes a great deal to Joe DiNapoli's methods, and uses a number of Joe's proprietary indicators. Please note that Sive's analysis is his own view of the market and is not endorsed by Joe DiNapoli or any related companies.
Weekly Gold Tading Report prepared by Sive Morten exclusively for ForexPeaceArmy.com
Reuters reports, Gold Gold rose the most in 2-1/2 weeks on Friday in thin post-Christmas trading, boosted by short-covering after China's central bank was reported to be considering a loosening of liquidity requirements at the country's banks.
Spot gold gained 2.1 percent to a session high of $1,199.00 an ounce, supported by an increase in crude oil prices. The gain eased slightly as oil prices turned negative and the U.S. dollar rose against a basket of currencies.
Gold prices were buoyed throughout the day by news reports that China, the world's top consumer of gold, was considering a policy change to reinvigorate the economy by allowing banks to have more money available for lending and investment.
The possibility of easier lending in China, the top consumer of many raw materials, prompted investors to cover short positions in gold.
"The surprise let-up in Chinese tightening may actually help gold because that is where the investors will turn," said George Gero, precious metals strategist for RBC Capital Markets in New York.
Gold triggered buy-stops after crossing $1,180 a lb, but encountered resistance at the 20-day moving average just below $1,200 a lb, Gero said.
A slowdown in Chinese growth has weakened physical demand for many commodities, including metals.
Liquidity remained thin the day after the Christmas holiday as key markets such places as Australia, Hong Kong, Singapore and the UK were closed on Friday. New York trading was open.
Despite Friday's gains, investor sentiment toward the metal is unlikely to improve in the first few months of 2015, as markets expect the U.S. economy to show continued signs of strength that will lead the Federal Reserve to start increasing interest rates.
Higher rates weigh on non-interest-bearing bullion.
CFTC data gives no update on 23rd of December, thus the last numbers are those that stand on 16th of December. As longs as shorts were contracted a bit. Thus, major sentiment shifting has happened 2 weeks ago. We’ve seen mass short covering, and then CFTC showed increasing in speculative long positions and shy growth of open interest.
Here is detailed breakdown of speculative positions:
Open interest:
So, guys, recent chill out in upside rally looks worrying. It has started rather well, but faded out rather fast. Currently it is not quite clear whether the reason is Xmas and end of financial year or indeed it was just retracement. It is difficult to argue with the facts – SDPR is stagnating, CFTC also does not support yet big shift that have happened 3 weeks ago and finally - spot market in Asia gives discounts to London quotes. This is not typical situation at all. Big players still expect that gold will remain under pressure. That’s being said it looks like our major target is to not overestimate recent events. It could happen so that bearish positions will be re-established in January, but if they not – this indeed will be sign of shifting sentiment on gold market. Also we do not expect any solid activity till the end of the year. Probably market will remain thin, quiet and lazy a bit.
Technicals
Monthly
It is difficult to add something really new here, on monthly chart, since market has closed just 30 cents higher compares to previous week. Currently we have last big pattern in progress that is Volatility breakout (VOB). It suggests at least 0.618 AB-CD down. And this target is 1050$.
On previous week we’ve said monthly chart has lost its piquancy. Bullish grabber has not been formed. In December we could get either just trend shifting back to bullish, or bearish grabber that will suggest further downward action. Massive closing of short positions could mean that December might become quiet month. Investors have contracted their positions significantly, pointing that they do not believe in soon downward breakout but also do not fascinating with upside perspectives. Most probable explanation is reducing positions before year end, bonuses calculation and long holidays.
The major driving factor for Gold is inflation and particularly here US economy has problem. Although recent report has shown shy increase in wages, but inflation still stands flat. Accompanied by positive NFP numbers increasing chances on sooner rate hiking will be negative combination for gold. That’s why currently we do not see reasons yet to cancel our 1050$ target. Commerzbank analyst also think that gold will remain under pressure in the first half of 2015 with 1100$ target.
At the same time guys we see some structural shifts in market sentiment and just can’t ignore it. Hardly could we call mass short covering, increasing longs and SDPR storage just occasional. That’s why although we probably keep our long-term target at 1050$ for awhile, but in short-term perspective we do not exclude deeper retracement to 1265$ area. Recently this tendency has paused a bit, but January will give the answer – either it will continue or short positions will be re-established and market indeed will continue move down. Right now situation is too contradictive to say definitely what direction will be chosen. Following to pure technical picture we could say that gold keeps chances as for possible 1265$ action as for 1050$ just because gold stands at the edge and goes nowhere.
Weekly
Due holidays market just has made an attempt to move higher, re-test MPP and returned right back up. Trend holds bullish here. Initial reaction of AB=CD completion point and monthly Agreement now looks not as impressive as previously. It is slowed and become more choppy with long shadows as to upside as to downside. Market has returned right back down below MPR1. Now it does not look really as upside impulse action and reversal, right? Taking into consideration recent fundamental data and existence of untouched butterfly and 1.618 AB-CD targets, downward continuation seems not impossible. Besides, recent action is starting to remind flag shape that suggests downside continuation. That’s being said, when market reaches significant support area but reaction on this event is mild – logically to suggest possible further downward continuation. Market really looks heavy and can’t just jump off from support area.
Daily
Trend still stands bearish. WE see the same pattern that could become starting moment for any upside action. On previous week we’ve mentioned that recent slowing of gold to start upside action could be bearish sign, since this is not typical for normal development of H&S pattern. At the bottom of right shoulder bulls should take total control on market and upside action should take the signs of impulse move up. Here we do not see it yet. Besides, on the down slope of right shoulder we see solid sell-off, acceleration. This is also not very good moment…
Still, upside action has started despite thin market. Now we need just to see how stable this action will be. Currently we do not see any flaws in shape and behavior of H&S pattern. We need to get some serious failure of this pattern to start speak about bearish continuation. For example, if market will return right back down and break through 1170 area or reach neckline but will fail at breakout of it and return right back down.
4-hour
Despite that we’ve called this H&S pattern “ugly” it has worked nice and market has reached major 5/8 daily Fib support. Simultaneously gold has completed downward harmonic swing that initially has appeared on NFP release. And right now market has returned right back above neckline of H&S pattern. If market would be totally bearish – this H&S probably should trigger real reversal and downward continuation. While right now gold mostly shows opposite action. That’s why guys, we just have no reasons yet for taking any short positions here. If you doubt possible upside action - then it is better to stay flat. We also can’t say that this bullish setup looks tremendously attractive. But this is only setup that we have by far here.
Hourly
In fact, guys, as you probably understand we have only one choice – either to ignore this setup or to take it, since we do not have bearish setups yet. And to be honest, ignoring may be not bad choice at all. Still, as we have only this setup, let’s discuss how we could trade it. First is our invalidation point stands at current lows 1170’s. Market will open near WPP and could start retracement immediately or to form some reversal pattern first, say, butterfly “Sell” as it is shown on picture. 1190 seems important support level, because it includes as WPP as Fib support. But market also could show deeper retracement to 1182 and re-test previous top. As market stands choppy recently and still will remain thin before New Year’s Day, we need to minimize potential loss. Thus, chances on reaching 1182 level seem not bad.
Conclusion:
Since market still keeps normal bearish tendency we should not refuse our 1050 target yet. Recent data shows some chill out in further upside sentiment. Currently it is not quite clear whether the reason is just end of the year and Xmas or really something is changing in big sentiment. Recent data suggests that first variant is more probable by far. Technical picture also does not look rock hard bullish. January will probably clarify some moments.
In short-term perspective market gives us no choice. Despite how strong our bearish suspicious area – we do not have clear bearish setup. Bullish setup in turn, also looks not very fascinating, but this is the only setup that we have here. Thus, if we will get entry point with minimal risk, we could think about taking long position…or just ignore this setup and wait for more valuable patterns.
The technical portion of Sive's analysis owes a great deal to Joe DiNapoli's methods, and uses a number of Joe's proprietary indicators. Please note that Sive's analysis is his own view of the market and is not endorsed by Joe DiNapoli or any related companies.