Sive Morten
Special Consultant to the FPA
- Messages
- 18,776
Fundamentals
Gold edged up on Friday, supported by some physical buying, but remained on track for its biggest annual loss in three decades as rallies in equities and prospects of global economic recovery dented its appeal. Expectations that the U.S. economy can stand on its own as monetary stimulus is withdrawn were buoyed by data on Thursday showing a decrease in weekly jobless claims. U.S. equities ended little changed on Friday, but the Dow and S&P 500 wrapped up a second straight week of solid gains. U.S. Treasury yields hit their highest since July 2011 above 3 percent.
"The market is probably going to stay in wide ranges for the next few sessions and there will still be some support from Asian buyers ahead of the Chinese New Year at the end of January," VTB Capital analyst Andrey Kryuchenkov said. Thin volumes may increase volatility until investors return from holidays. "I think they will liquidate again into this price rebound as there is no fundamental reason to buy the metal," he said.
Bullion fell to a six-month low of $1,185.10 last week, after the U.S. Federal Reserve said it would begin tapering its $85 billion in monthly bond purchases next month, before recovering slightly.
BIGGEST ANNUAL DECLINE IN 32 YEARS
Gold is headed for a near 30 percent slump in 2013, ending a 12-year rally prompted by rock-bottom interest rates and measures taken by global central banks to prop up the economy, which encouraged investors to put their money in non-interest-bearing assets such as gold. This year's decline is set to be gold's biggest since 1981, while current prices are 37 percent below an all-time high of $1,920.30 hit in 2011. As a gauge of investor interest, holdings in the SPDR Gold Trust, the world's largest gold-backed exchange-traded fund, fell 0.19 percent on Thursday to 804.22 tonnes, the weakest since 2009. Physical buying among Chinese consumers edged up on Friday, but demand from Indonesia and Thailand has eased in recent weeks due to their weak currencies. Premiums for gold bars inched up to a high of $2 an ounce above spot London prices in Hong Kong, from $1.50 last week, as dealers awaited the arrival of fresh supply from Europe next month.
An improving global economic outlook helped platinum and palladium stage a year-end rally. After rising the most since mid-October in the previous session, spot platinum hit a two-week high of $1,377 an ounce. It pared gains due to technical selling and closed up 1.2 percent at $1,371.50 an ounce. Spot palladium rose to $714 an ounce, its highest since Dec. 17, and closed up 1.5 percent to $707.75 an ounce, its biggest daily gain since Dec. 4. In other precious metals, silver was up 1.6 percent to $20.03 an ounce, having posted its biggest daily gain for two weeks, on Thursday. Silver is down 35 percent this year in its worst annual performance since at least 1982.
For me, guys, it is interesting every time make an attempt to match what economists say and what other markets show. Thus, in recent time quite popular idea is: “If gold market has not shown any rally during QE, since inflation hazard was significant, hardly it will show appreciation or even accelerate down as QE contraction was announced”. Here and there we see different targets – 1100$, 800$, 1000$ etc. Actually I’m not trying to object to this really reasonable thought. But I suspect that this idea has been priced in already for 90%. Because it was too long period of fluctuations between QE continuation/tapering and too long expectation of tapering per se. Investors had a lot of time to assess possible effect of tapering.
Now, what do markets tell us? First of all Treasury yields – they are growing and this is the sign of future inflation. Actually Fed starts to hike rates when 10/2 year spread reaches an area around 2.6-2.75%. It means that spread widening process has started. Second is – other precious metals… they have more relation to industrial production, especially palladium and silver. This is not secret that there is some spread between, say gold and platinum, and gold and palladium. As they show different dynamic compares to gold – this suggests some inter-market divergence. Third moment is Australian dollar that we’ve discussed on previous week. Aussie has shown wash& rinse of previous lows but has not broken them. AUD correlation with the gold is very significant and this moment adds some worry about perspectives of 1180 breakout. Germany has repatriated first ~37 tonnes right back to Germany from France and will stand with this trend while it will not repatriate German’s gold totally from US and France. Finally, technically gold was extremely oversold from technical point of view. Previously it has led to solid bounce up. I do not know what we will see in current situation, but usually extreme oversold on monthly chart can’t just disappear completely – we will get its backfire someday, I suppose. At the same time we see on TV, in news a lot of programs where analysts start to talk about loosing of “absolute value feature” by gold, loss of its attractiveness, about “autres temps” – all flow, all changes etc… This comparison makes me think that we should be ready to buy, I suspect that we stand somewhere around the bottom. Of cause I mean not the trade on daily time frame chart – now I’m speaking about monthly chart, perspective of 3-8 months. I do not state definitely on reversal, may be it will be just bounce up, but anyway this move will significant.
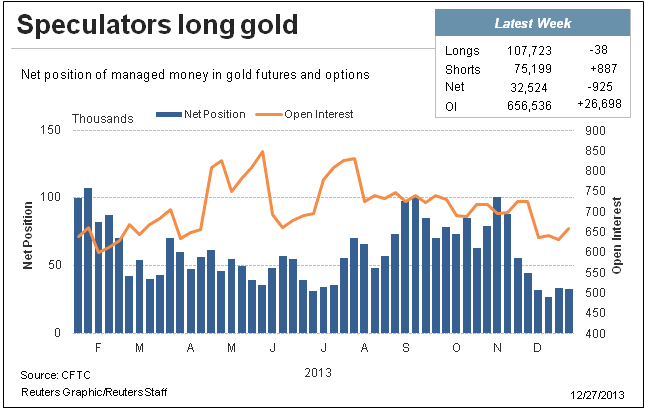
Probably we should not rely too much on recent CFTC data, since investors just close positions at the end of financial year and ahead of holidays, but it shows interesting dynamic – solid contraction of open interest when long position shows significant decreasing and some rebound in recent weeks, when long position has increased as well.
Monthly
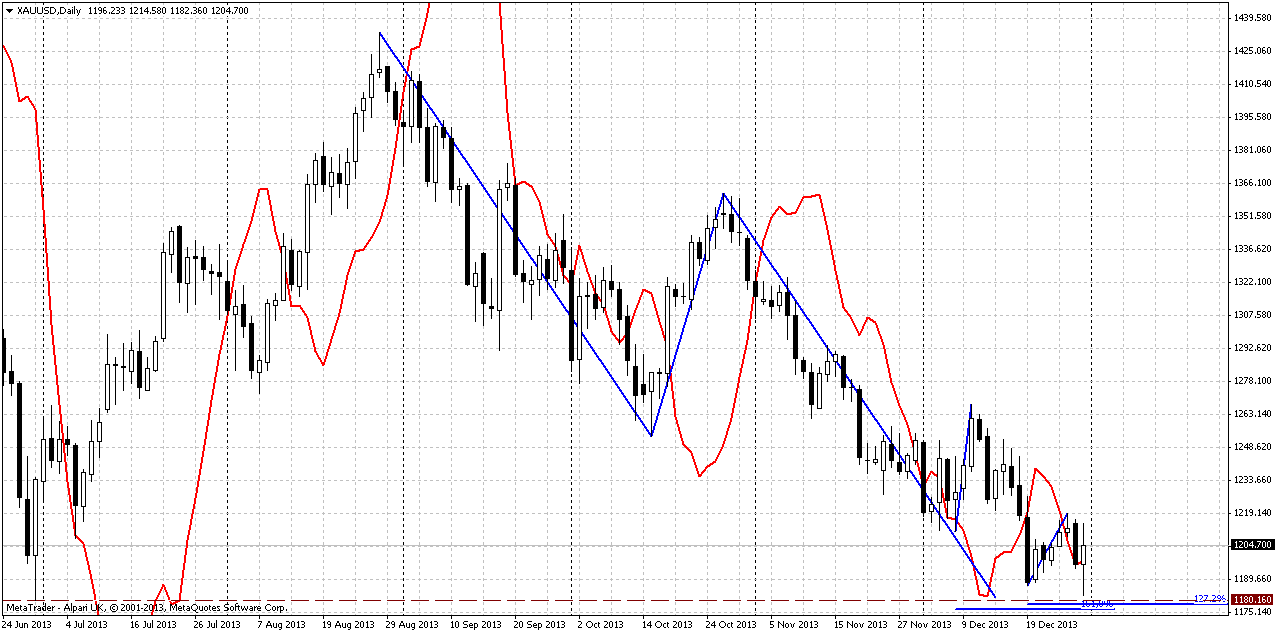
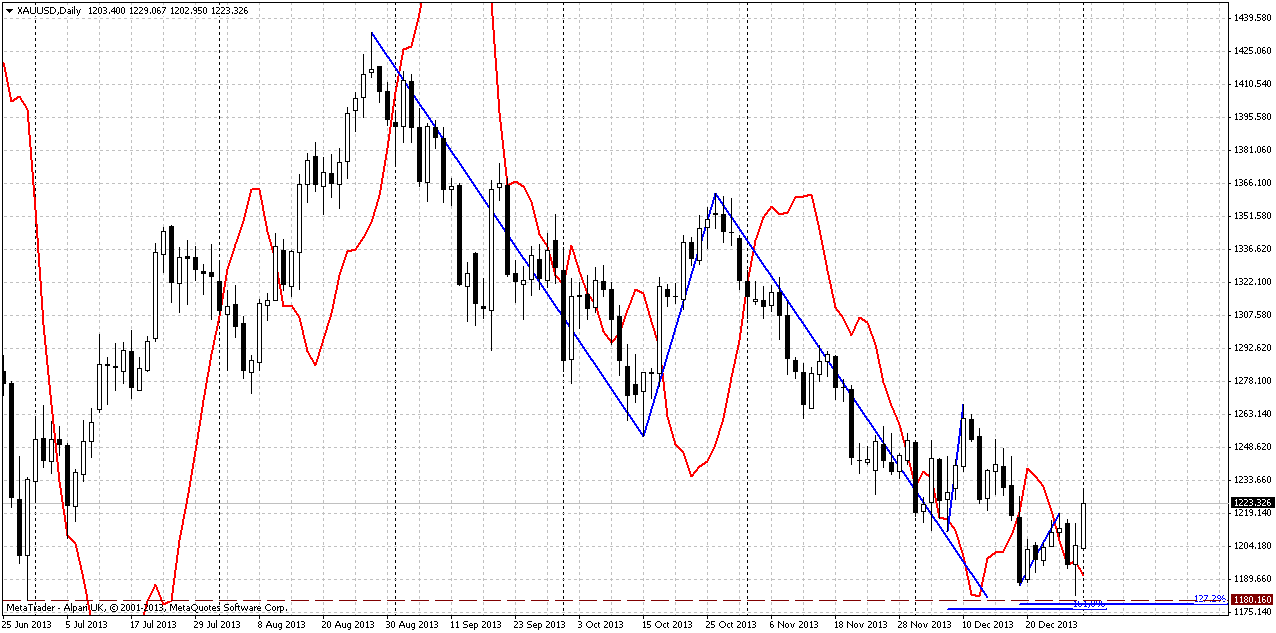
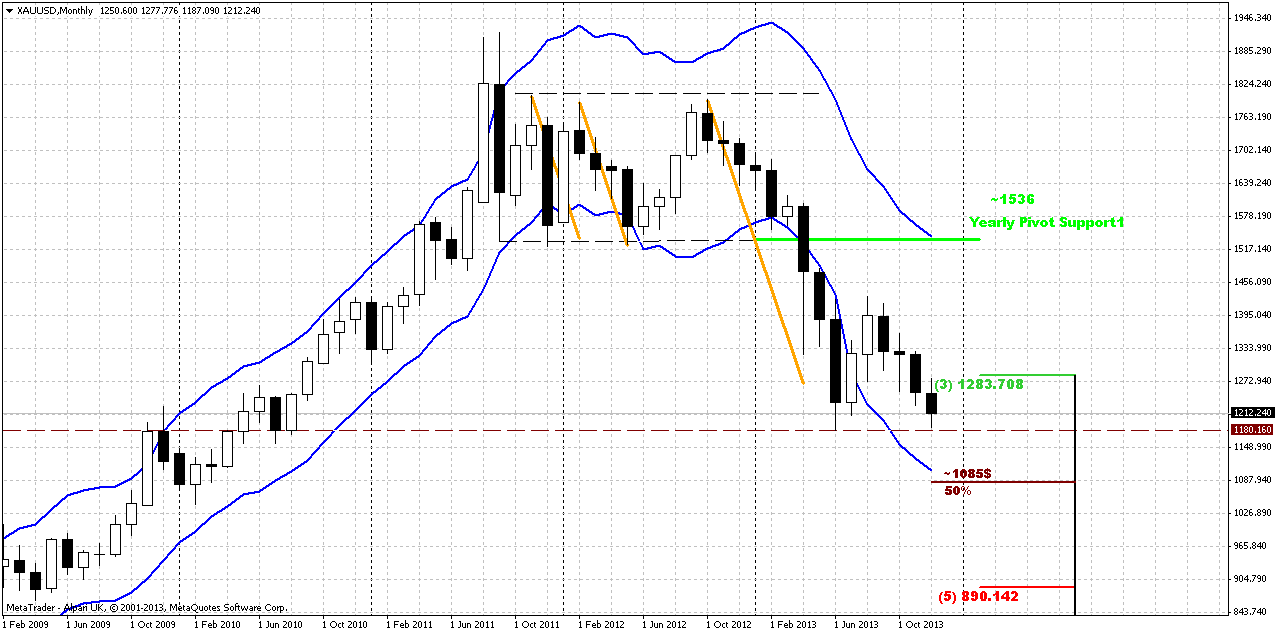
Here we do not have much changes. Market slowly but stably moves lower here. There was no outstanding action on previous week, thus, we hardly could see any changes on monthly chart. As market was significantly oversold we’ve suggested retracement up. Thus, we’ve made an assumption of possible deeper upward retracement that could take a shape of AB=CD, and invalidation for this setup is previous lows around 1170s. If market will pass through it, then, obviously we will not see any AB=CD up. And now, as market has broken through 1250, next target is precisely previous lows around 1180 – price almost has achieved it. In fact this will be the last chance for possible upward bounce, if, say, market will show something like double bottom. Price is not at oversold right now and not at major support, so really bearish market should reach previous lows level. Gold will be jiggered if it wouldn’t test previous lows, since this is very typical for gold market. That’s being said – primary object for monitoring right now is price action around previous lows. Whether we will see true breakout or it will be failure break and wash&rinse of lows. Latter action in general is very typical for double bottoms and fake breakout could be the first sign of possible retracement up. If market will really pass through 1180s, next target probably will be 50% support at monthly oversold around 1085$.
Weekly
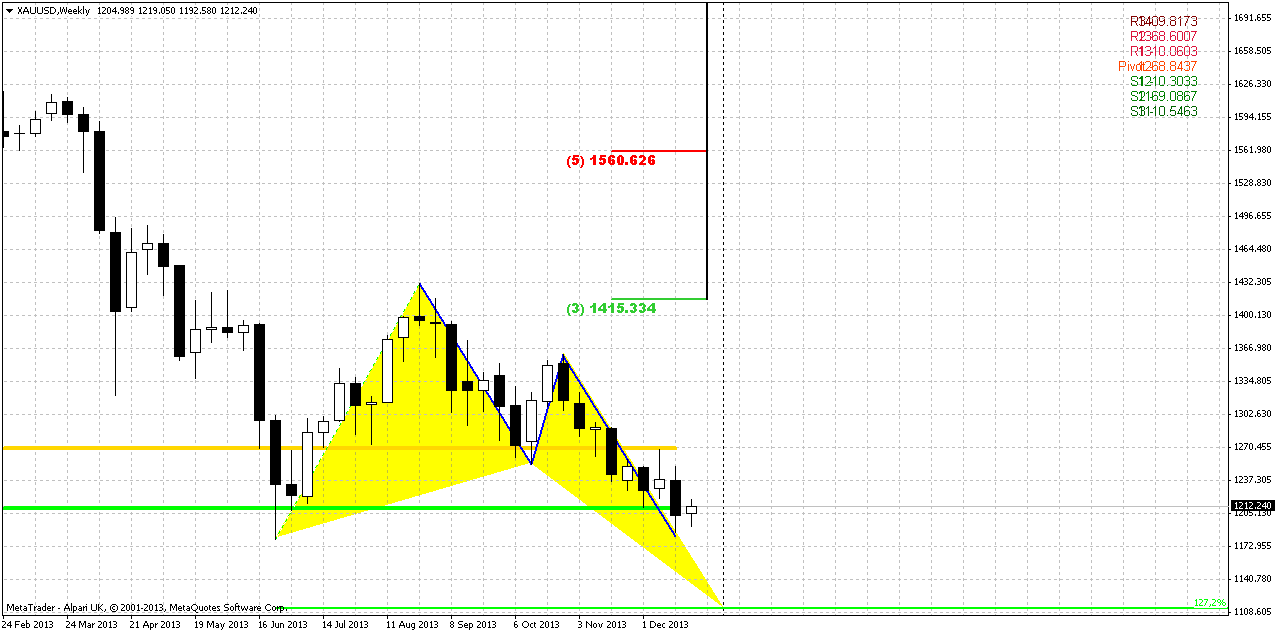
As you can see market has formed inside week, and it means that overall situation has not changed - context here is bearish as well. As we’ve said previously, price has broken through major 5/8 Fib support here. FOMC decision has led to further downward continuation, but market significantly has reduced the pace – either due end of the year or due changing situation on the market. At the same time SPDR fund data and overall fundamental picture still shows bearish sentiment on the market.
Concerning targets – they are the same. First is previous lows and target of AB-CD down. More extended target, if price will not only clear out lows but hold below it – possible butterfly “buy” around 1100 area. I suspect that we should be ready at minimum to clear out of previous lows.
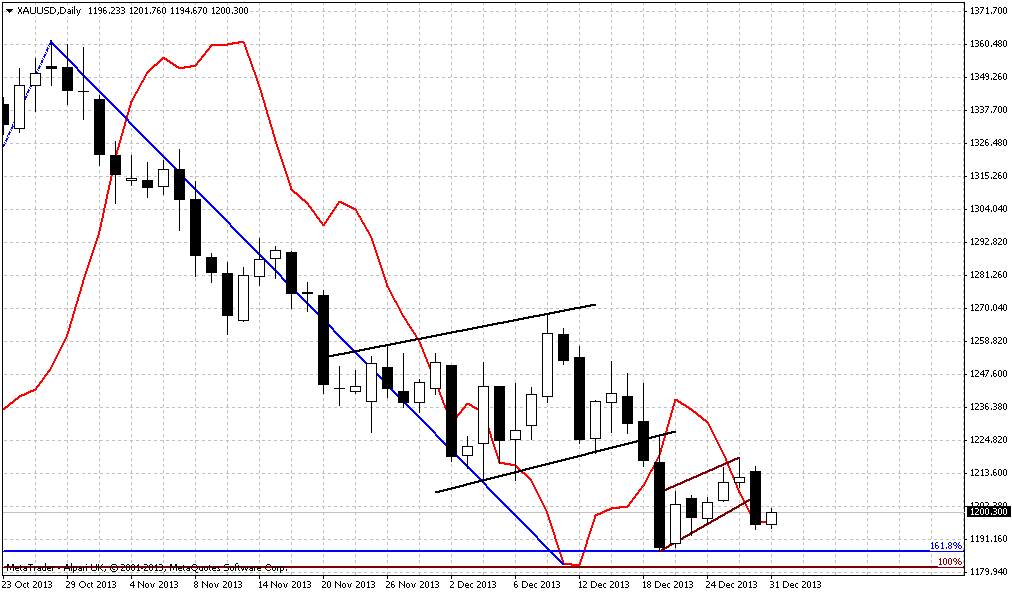
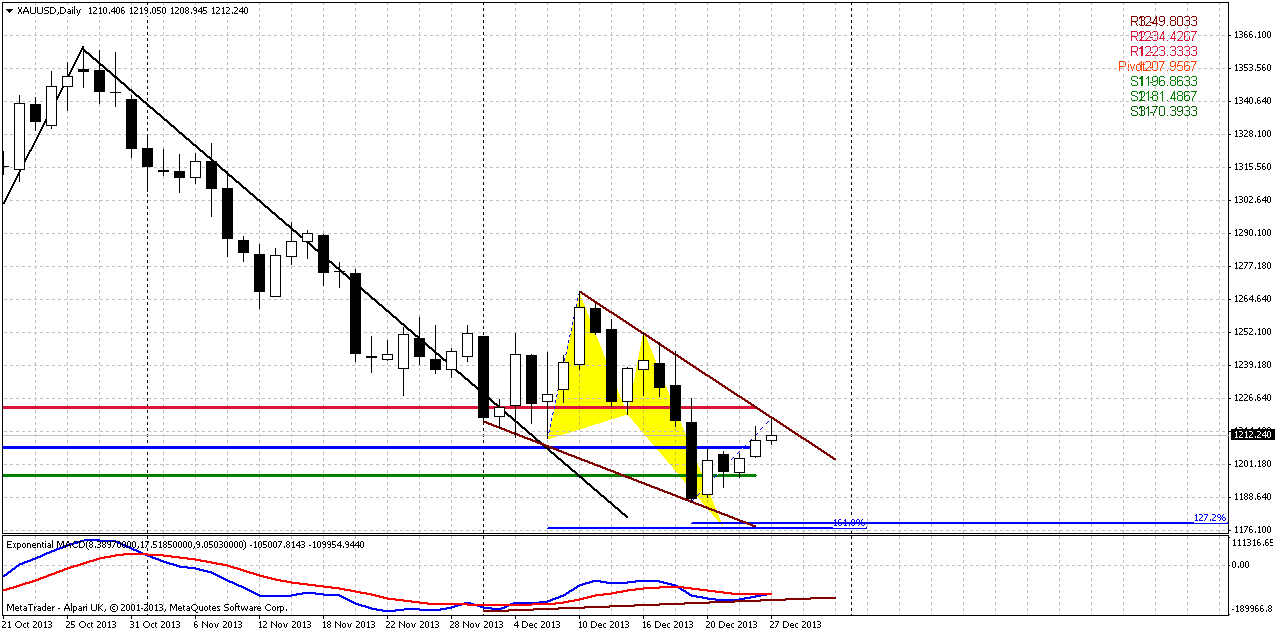
Daily
On recent week price has shown gradual upward move as retracement and respect of butterfly 1.27 target and former WPS1. As we do not see any upward impulse then we could suggest that this is really just retracement. Following the gold’s habit to re-test broken lows now see how market has reached 1200-1215 area. This area looks suitable for possible downward reversal and finally moving to 1160-1175 area. Because if price will move above WPR1 – this probably will be too extended retracement for situation when market stands right on target.
This level is interesting by other reason as well. We could get 3-Drive Buy pattern here. Take a look that if market will re-establish move down right here, then 1.27 extension of this recent retracement will coincide with 1.618 Butterfly target that simultaneously is an extension of 1st Drive. This pattern is one that I like to deal with – it is accompanied by divergence, has wedge shape. So we have signs of exhausting here. Also do not forget about our former AUD analysis. AUD hints on possible W&R of 1180 lows.
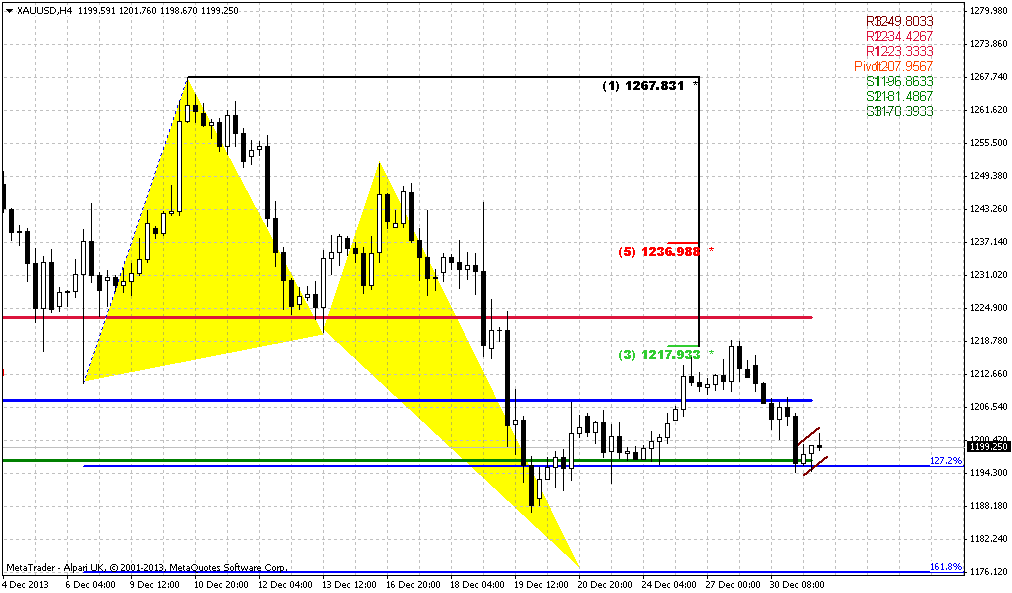
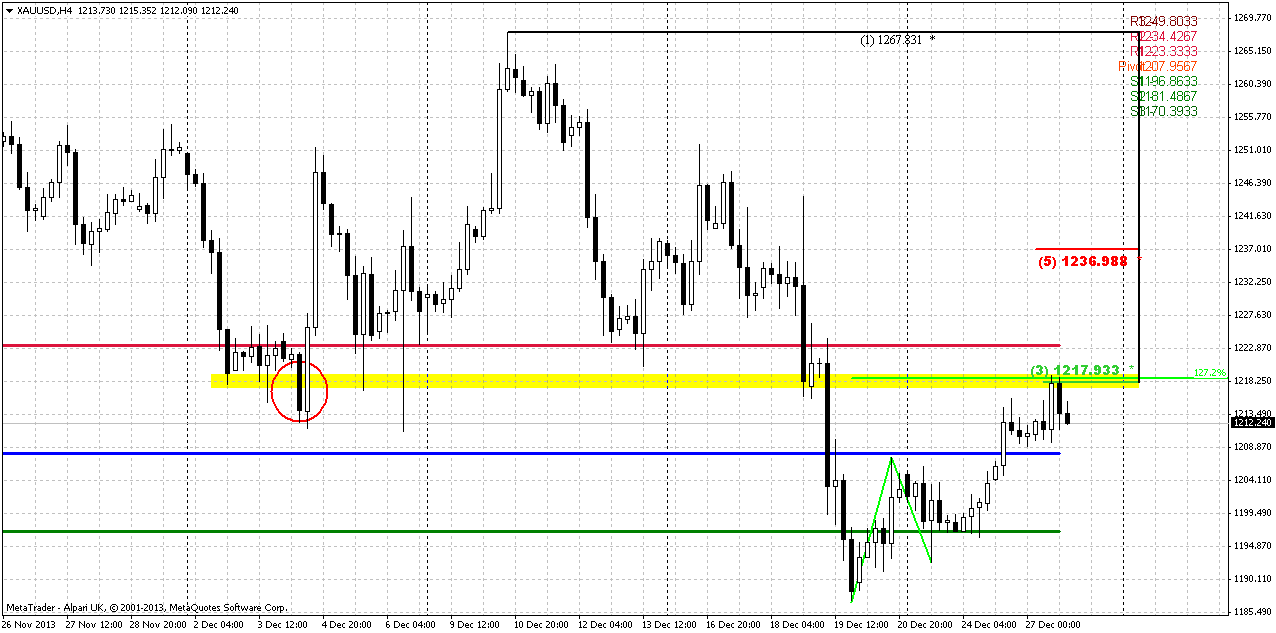
4-hour
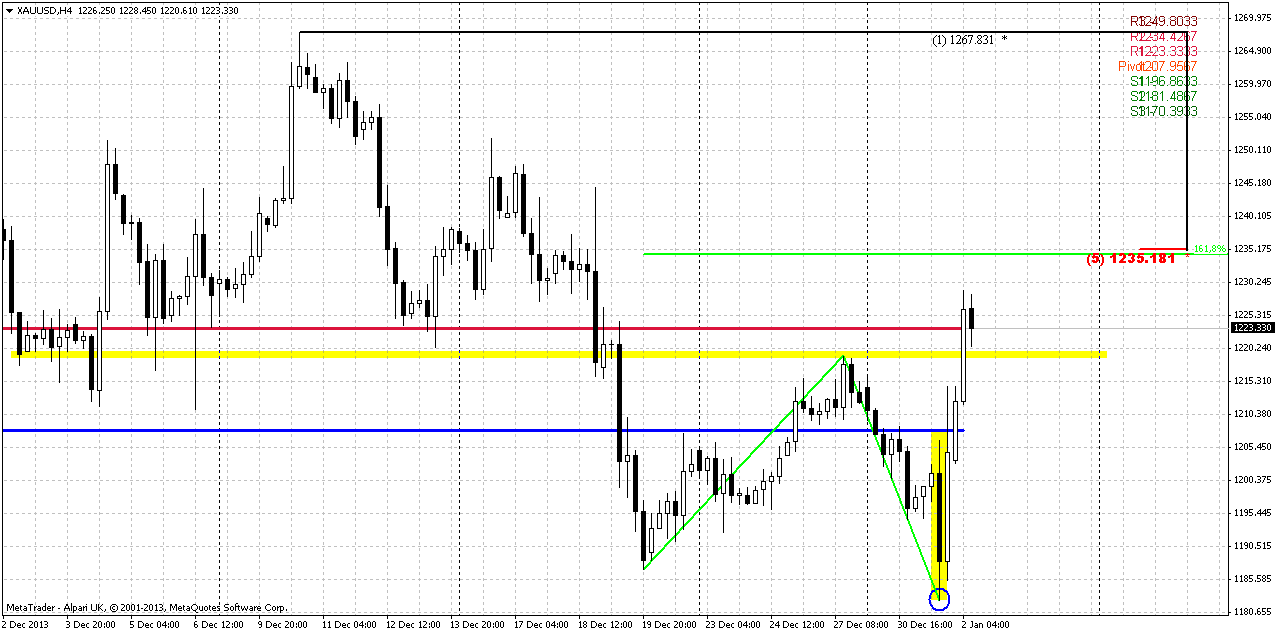
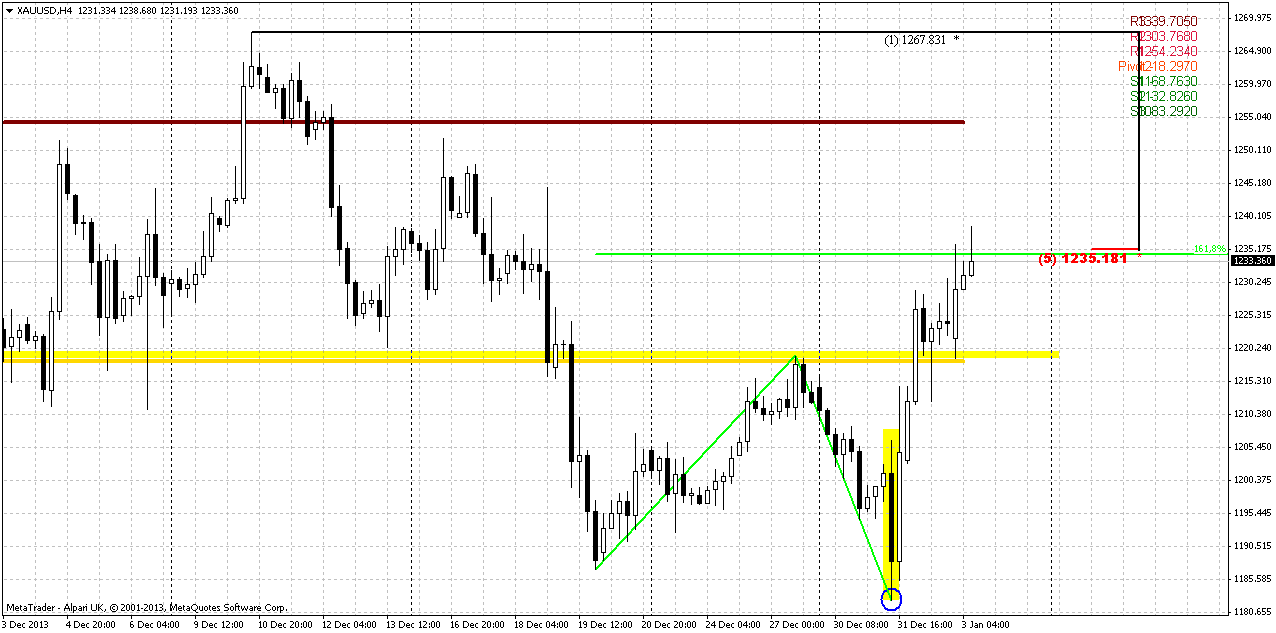
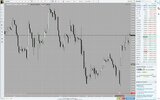
Here trend is bullish and we see AB-CD retracement that we’ve discussed on Friday. Market has hit the level that we’ve talked about – 1218 Agreement and re-tested previous consolidation. CD leg is flatter than AB and this points on some exhausting of the upward momentum. Action itslef has no signs of thrust, thus market has all chances here to turn south. Any move above WPR1 will be quite unwelcome for bearish development. As market has not hit significant target yet – it should not show too extended retracements up.
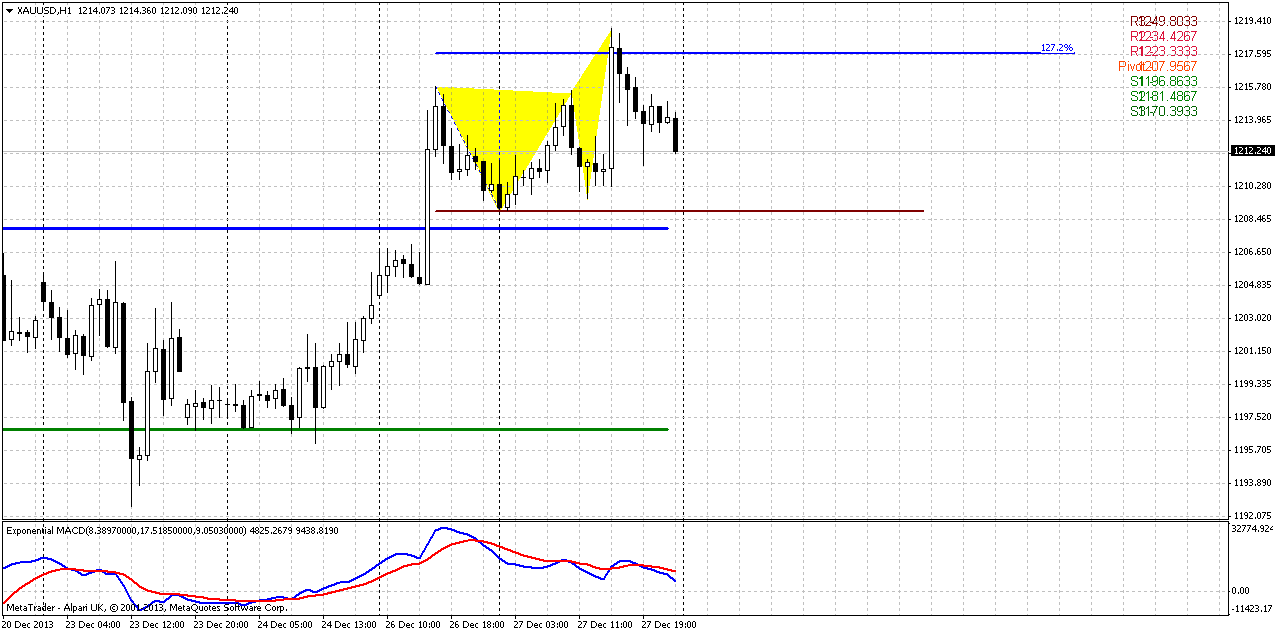
1-hour
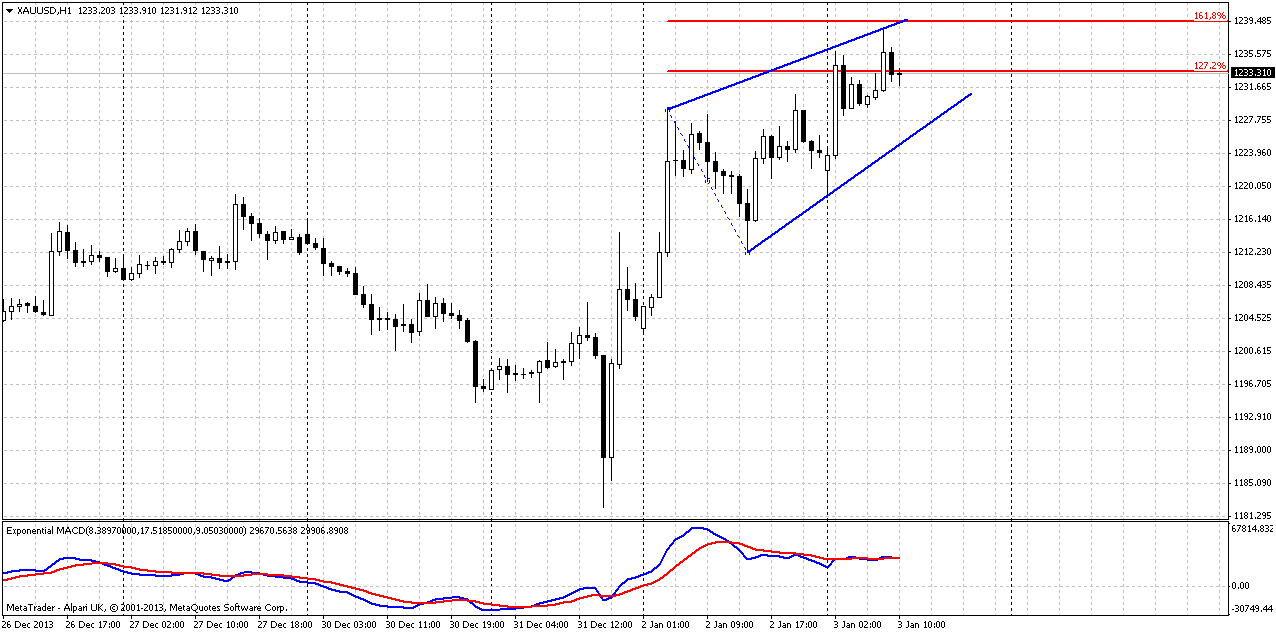
Here we also see butterfly “Sell” has been formed right at resistance. Potentially this shape could shift to small H&S pattern. Also it is accompanied by divergence.
Conclusion:
Market still holds bearish in a long-term and slowly but stably drifts lower. In short term perspective closing of financial year could hold investors from strong action and taking large directional position. This already could be seen from most recent CFTC report and CME trading volumes data. As some disagreement has appeared between mass-media information and market signals, we suspect that gold is approaching to its lows. Unfortunately we can’t say what possible bounce will be – retracement or reversal. But whatever it will be – it definitely will give us very significant move on monthly time frame. It would be logical to suggest that this will be deep retracement, because gold market has shown monthly volatility breakout and usually it has 2-leg shape.
In short-term perspective we expect challenge of 1180 lows again. Market has reached suitable resistance and is forming some signs of weakness. Let’s see whether they will lead us to desirable result.
The technical portion of Sive's analysis owes a great deal to Joe DiNapoli's methods, and uses a number of Joe's proprietary indicators. Please note that Sive's analysis is his own view of the market and is not endorsed by Joe DiNapoli or any related companies.
Gold edged up on Friday, supported by some physical buying, but remained on track for its biggest annual loss in three decades as rallies in equities and prospects of global economic recovery dented its appeal. Expectations that the U.S. economy can stand on its own as monetary stimulus is withdrawn were buoyed by data on Thursday showing a decrease in weekly jobless claims. U.S. equities ended little changed on Friday, but the Dow and S&P 500 wrapped up a second straight week of solid gains. U.S. Treasury yields hit their highest since July 2011 above 3 percent.
"The market is probably going to stay in wide ranges for the next few sessions and there will still be some support from Asian buyers ahead of the Chinese New Year at the end of January," VTB Capital analyst Andrey Kryuchenkov said. Thin volumes may increase volatility until investors return from holidays. "I think they will liquidate again into this price rebound as there is no fundamental reason to buy the metal," he said.
Bullion fell to a six-month low of $1,185.10 last week, after the U.S. Federal Reserve said it would begin tapering its $85 billion in monthly bond purchases next month, before recovering slightly.
BIGGEST ANNUAL DECLINE IN 32 YEARS
Gold is headed for a near 30 percent slump in 2013, ending a 12-year rally prompted by rock-bottom interest rates and measures taken by global central banks to prop up the economy, which encouraged investors to put their money in non-interest-bearing assets such as gold. This year's decline is set to be gold's biggest since 1981, while current prices are 37 percent below an all-time high of $1,920.30 hit in 2011. As a gauge of investor interest, holdings in the SPDR Gold Trust, the world's largest gold-backed exchange-traded fund, fell 0.19 percent on Thursday to 804.22 tonnes, the weakest since 2009. Physical buying among Chinese consumers edged up on Friday, but demand from Indonesia and Thailand has eased in recent weeks due to their weak currencies. Premiums for gold bars inched up to a high of $2 an ounce above spot London prices in Hong Kong, from $1.50 last week, as dealers awaited the arrival of fresh supply from Europe next month.
An improving global economic outlook helped platinum and palladium stage a year-end rally. After rising the most since mid-October in the previous session, spot platinum hit a two-week high of $1,377 an ounce. It pared gains due to technical selling and closed up 1.2 percent at $1,371.50 an ounce. Spot palladium rose to $714 an ounce, its highest since Dec. 17, and closed up 1.5 percent to $707.75 an ounce, its biggest daily gain since Dec. 4. In other precious metals, silver was up 1.6 percent to $20.03 an ounce, having posted its biggest daily gain for two weeks, on Thursday. Silver is down 35 percent this year in its worst annual performance since at least 1982.
For me, guys, it is interesting every time make an attempt to match what economists say and what other markets show. Thus, in recent time quite popular idea is: “If gold market has not shown any rally during QE, since inflation hazard was significant, hardly it will show appreciation or even accelerate down as QE contraction was announced”. Here and there we see different targets – 1100$, 800$, 1000$ etc. Actually I’m not trying to object to this really reasonable thought. But I suspect that this idea has been priced in already for 90%. Because it was too long period of fluctuations between QE continuation/tapering and too long expectation of tapering per se. Investors had a lot of time to assess possible effect of tapering.
Now, what do markets tell us? First of all Treasury yields – they are growing and this is the sign of future inflation. Actually Fed starts to hike rates when 10/2 year spread reaches an area around 2.6-2.75%. It means that spread widening process has started. Second is – other precious metals… they have more relation to industrial production, especially palladium and silver. This is not secret that there is some spread between, say gold and platinum, and gold and palladium. As they show different dynamic compares to gold – this suggests some inter-market divergence. Third moment is Australian dollar that we’ve discussed on previous week. Aussie has shown wash& rinse of previous lows but has not broken them. AUD correlation with the gold is very significant and this moment adds some worry about perspectives of 1180 breakout. Germany has repatriated first ~37 tonnes right back to Germany from France and will stand with this trend while it will not repatriate German’s gold totally from US and France. Finally, technically gold was extremely oversold from technical point of view. Previously it has led to solid bounce up. I do not know what we will see in current situation, but usually extreme oversold on monthly chart can’t just disappear completely – we will get its backfire someday, I suppose. At the same time we see on TV, in news a lot of programs where analysts start to talk about loosing of “absolute value feature” by gold, loss of its attractiveness, about “autres temps” – all flow, all changes etc… This comparison makes me think that we should be ready to buy, I suspect that we stand somewhere around the bottom. Of cause I mean not the trade on daily time frame chart – now I’m speaking about monthly chart, perspective of 3-8 months. I do not state definitely on reversal, may be it will be just bounce up, but anyway this move will significant.
Probably we should not rely too much on recent CFTC data, since investors just close positions at the end of financial year and ahead of holidays, but it shows interesting dynamic – solid contraction of open interest when long position shows significant decreasing and some rebound in recent weeks, when long position has increased as well.
Monthly
Here we do not have much changes. Market slowly but stably moves lower here. There was no outstanding action on previous week, thus, we hardly could see any changes on monthly chart. As market was significantly oversold we’ve suggested retracement up. Thus, we’ve made an assumption of possible deeper upward retracement that could take a shape of AB=CD, and invalidation for this setup is previous lows around 1170s. If market will pass through it, then, obviously we will not see any AB=CD up. And now, as market has broken through 1250, next target is precisely previous lows around 1180 – price almost has achieved it. In fact this will be the last chance for possible upward bounce, if, say, market will show something like double bottom. Price is not at oversold right now and not at major support, so really bearish market should reach previous lows level. Gold will be jiggered if it wouldn’t test previous lows, since this is very typical for gold market. That’s being said – primary object for monitoring right now is price action around previous lows. Whether we will see true breakout or it will be failure break and wash&rinse of lows. Latter action in general is very typical for double bottoms and fake breakout could be the first sign of possible retracement up. If market will really pass through 1180s, next target probably will be 50% support at monthly oversold around 1085$.
Weekly
As you can see market has formed inside week, and it means that overall situation has not changed - context here is bearish as well. As we’ve said previously, price has broken through major 5/8 Fib support here. FOMC decision has led to further downward continuation, but market significantly has reduced the pace – either due end of the year or due changing situation on the market. At the same time SPDR fund data and overall fundamental picture still shows bearish sentiment on the market.
Concerning targets – they are the same. First is previous lows and target of AB-CD down. More extended target, if price will not only clear out lows but hold below it – possible butterfly “buy” around 1100 area. I suspect that we should be ready at minimum to clear out of previous lows.
Daily
On recent week price has shown gradual upward move as retracement and respect of butterfly 1.27 target and former WPS1. As we do not see any upward impulse then we could suggest that this is really just retracement. Following the gold’s habit to re-test broken lows now see how market has reached 1200-1215 area. This area looks suitable for possible downward reversal and finally moving to 1160-1175 area. Because if price will move above WPR1 – this probably will be too extended retracement for situation when market stands right on target.
This level is interesting by other reason as well. We could get 3-Drive Buy pattern here. Take a look that if market will re-establish move down right here, then 1.27 extension of this recent retracement will coincide with 1.618 Butterfly target that simultaneously is an extension of 1st Drive. This pattern is one that I like to deal with – it is accompanied by divergence, has wedge shape. So we have signs of exhausting here. Also do not forget about our former AUD analysis. AUD hints on possible W&R of 1180 lows.
4-hour
Here trend is bullish and we see AB-CD retracement that we’ve discussed on Friday. Market has hit the level that we’ve talked about – 1218 Agreement and re-tested previous consolidation. CD leg is flatter than AB and this points on some exhausting of the upward momentum. Action itslef has no signs of thrust, thus market has all chances here to turn south. Any move above WPR1 will be quite unwelcome for bearish development. As market has not hit significant target yet – it should not show too extended retracements up.
1-hour
Here we also see butterfly “Sell” has been formed right at resistance. Potentially this shape could shift to small H&S pattern. Also it is accompanied by divergence.
Conclusion:
Market still holds bearish in a long-term and slowly but stably drifts lower. In short term perspective closing of financial year could hold investors from strong action and taking large directional position. This already could be seen from most recent CFTC report and CME trading volumes data. As some disagreement has appeared between mass-media information and market signals, we suspect that gold is approaching to its lows. Unfortunately we can’t say what possible bounce will be – retracement or reversal. But whatever it will be – it definitely will give us very significant move on monthly time frame. It would be logical to suggest that this will be deep retracement, because gold market has shown monthly volatility breakout and usually it has 2-leg shape.
In short-term perspective we expect challenge of 1180 lows again. Market has reached suitable resistance and is forming some signs of weakness. Let’s see whether they will lead us to desirable result.
The technical portion of Sive's analysis owes a great deal to Joe DiNapoli's methods, and uses a number of Joe's proprietary indicators. Please note that Sive's analysis is his own view of the market and is not endorsed by Joe DiNapoli or any related companies.