Sive Morten
Special Consultant to the FPA
- Messages
- 18,732
Fundamentals
As we’ve said in previous research, we will gradually add more fundamental issues, since analyzing gold without them looks not quite proper approach. As we know already, Gold is entering seasonal bear trend and it will last till the end of summer approximately. This is not neccesarily will lead to decreasing, but gold will feel the preasure of bearish sesonality and upward moves could be depressed. Also let’s take a look at new COT report. We see that speculators net long positions have slightly increased. However currently we’re mostly interesting not with the absolute number of net long positions, but with their relative value. I have to say, that 80K net longs is a minimum longs within last 5-6 years, since gold stands in long term bull trend. The upper value, as you can see even from this chart stands around 200 K contracts on gold. So, when speculators long positions stands at minimum and they have a lot of room to grow – this could indicate the eve of bullish trend continuation. Currently we can’t assume yet downward drastical reversal on gold market yet. Thus, current situaion still looks bullish in long-term.
 Now let’s turn to a bit deeper analysis. I would like to add couple of new issues here. First of all, I would like to show you the same chart of COT, but with the Gold price and for longer period. Here you can see that from 2004 minimum level on non-commercial (speculators) net positions stands around 50-60 K contracts and currently, as we said they are almost at minimum.
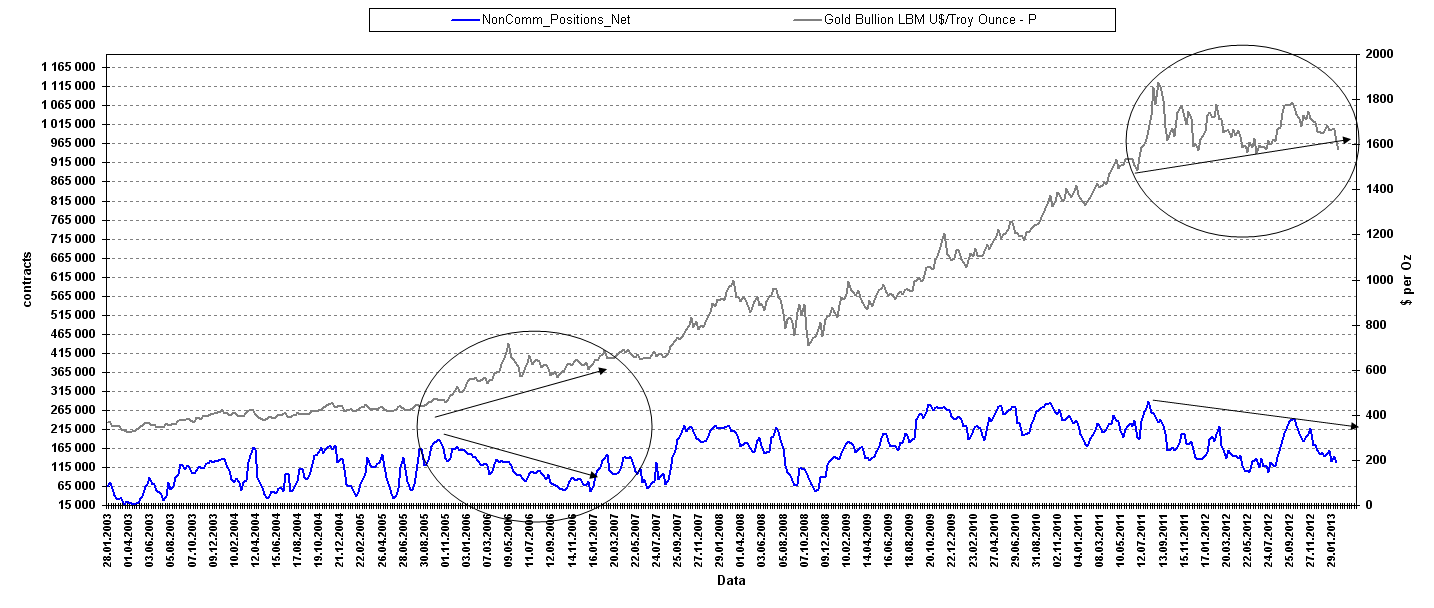
However the most important issue is similarity of price action in 2006 and in 2011. As a rule speculative positions support the trend, because, in fact, they are the trend, or do not move in opposite direction. In 2006 we see clear divergence, when net long positions were decreasing, while gold prices climbed higher. And now take a look at current moment – the same situation, interesting, right? But I’m not done yet.

In 2011 - 2012 gold stands in the range and even has decreased in value, while real physical holdings of the gold in World biggest ETF has risen for 100-150 Tones.
The picture we can see with Open Interest – holdings stands flat. It means that investors do not leave gold market, while Open interest decreasing. What does it mean?

If speculative net longs are growing, but Open Interest decreasing – it means that short positions are decreasing, right?
So, today’s analysis shows that bullish potential on Gold market still holds and pressure is growing.
Monthly
Monthly analysis has not changed much. Actually currently we see inside month is developing compares to January. So conclusion here is the same:
This time frame extremely useful for gold market, since as you can see it stands in the range within 1.5 years. Why? Well, generally it could be explained by changing environment on financial markets. Globe economy has felt extremely bad, demand for gold was solid from China and India, banks have invested in gold actively as well - so invest in gold was simple. But now situation looks more complicated and blur. We see some improvements here and there, US stock market is growing, but bond yields still hold on all time lows. From time to time we see good statistics data, for example on US house market, but later we again see disappointing numbers. The same is in EU. It is possible that gold has turned to consolidation because it looks like to abandon gold is too early and risky and what the alternative, but conversely – something is changing, and may be it’s too late to invest in gold? So, market in fact, stands on guard and “hold” longs. Because if sell-off has started, we probably now should have gold around 1200$. Such situation and overall sentiment on the market puts impact on trading style, because traders can’t join long-term trends, they have to search for short-term trading against some significant levels and not marry any positions, trades have to be based on definite patterns that could give definite entry level, stop and profit objectives. That is the short characteristic of current gold market.
Still, current technical picture confirms conclusions of COT analysis. Market has non-obvious bullish gravitation. It could be seen from tight consolidation; market has shown very tight retracement after tremendous trend up and still stands tight. This usually happens before upward continuation.
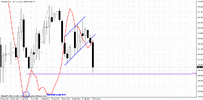
On first chart we see two significant moments. First – take a look at trend by MACD. It is strongly bearish, but what is a price action? Right, it’s flat and does not support bear trend. This could suggest hidden bullish power and calls as “Dynamic pressure”. Second is, market is flirting with yearly pivot point at 1665 area. Yearly pivots are important by two reasons. Gold market has a tendency to create high or low for the year during first quarter. If market will move below it and take out current year lows around 1620 – I do not want to be bullish on Gold. That is the first scenario – keep an eye on yearly pivot and current year low. If market will move below it – our road is to yearly pivot support 1 that is lower border of consolidation as well. Will it mean that bullish sentiment is broken? Not necessarily. We know that when market stands in a long-term bull trend – Pivot Support 1 should hold retracement, if trend is still in play. Besides, move to lower border of consolidation doesn’t mean yet that bearish breakout will follow.

Now let’s speak about bullish perpsectives. I think that here could be Butterfly with 1.27 around 2000 level. Now it looks not as accurate as previously, but initial swing still intact. If we will stick with horizontal consolidation – in the case of upward breakout it will give us the same destinaton. Also you can see here triangle. Anyway, all patterns suggest upward move.

As conclusion from analysis of monthly chart we can say – two crucial levels for us here. They are 1625 current year low. Until it holds – we have a hope to upward continuation. If it will fail – we will turn on way to yearly pivot support 1 and lower border of monthly coil – 1536, that is a second level to watch.
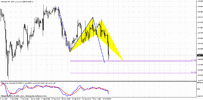
We have an inside week, so nothing to add here as well. From the weekly perspective we have situation of stalemate. From the one point of view, trend is bearish. We have completed downward AB=CD pattern + Agreement right at 5/8 Fib support and shallow bounce up, that looks heavy and not impressive. Price now stands right around MPP=1662 that is also very close to yearly pivot. Until market stands above yearly lows (red circle) it is better to search possibility to enter long, but as closer to 1625 as possible. This level is also MPS1 and previous consolidation support, currently we see weak respect of AB=CD, but this is Gartley “222” Buy as well, so, it might be re-test of this low and upward move. You should know that 0.618 retracements is a favorable level for Gold. It usually shows deep retracements and as a rule they are 0.618. Besides, this level is very common for butterflies.
If market will pass lower, then we should be ready for downward move right to the low of current consolidation. That’s why until this level holds it is better to tune on long positions with reasonable risks.

Daily
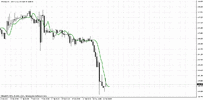
Luckily on gold we finally have got some action that is worthy to be discussed. Actually there are two significant moments. First is downward flag breakout. Although Friday’s session was inside one, price has closed lower than the border of the flag. But what is more significant – is bearish dynamic pressure. On gold market we see that trend almost whole week holds bullish, but price action does not support it and continues to creep lower with MACD line. It means that perspectives of previous low taking become greater. Thus, from perspectives of these moments, we do not want to see return right back inside the flag. If this will happen, then we could get the move till upper border of the flag at minimum, or even upward continuation.

4-hour
Trend is bearish here. We still have this AB=CD pattern that could lead market to agreement with daily 0.768 Fib support. I do not know – is proper way to show this as butterfly, since it has rather choppy price action and hardly identificated, but, anyway, the 1.27 extension of BC leg stands around 1640 area as well.

1-hour
Here we see the breakout of the wedge pattern and re-testing of the lower border. In general on intraday charts situation looks more bearish rather than bullish. As usual, in the beginning of the week we should keep an eye on WPP around 1671, that is also nearest Fib resistance. So, if you already have short position, as we’ve entered on Thursday around 1680 – probably it makes sense to keep them, since now probability of moving to 1640 is greater than on previous week. If you search possibility to enter short – take a look at 1671 area. Finally, if you’re bullish – then better sit on the hands and wait, when market will reach 1640 or show failure breakout and return right back inside of consolidation. Mostly short-term analysis was made for scalp traders...

As we’ve mentioned, gold stands among most cunning markets. Long-term picture suggests that market still stands in long-term bullish trend and has not broken yet, despite on 1.5 year consolidation. If upward move will continue, then market could reach 2000 level within 12-18 months.
If market will move and hold below current year’s low at 1625 – that could trigger retracement to 1536 level – low border of consolidation and yearly PS1. But even this move will not erase bullish trend.
Sentiment analysis shows that bullish pressure is growing on long-term charts. Demand for physical gold has not reduced much, speculators hold long positions and their amount near the low.
On lower time frame market shows more signs of possible move to 1640 than on previous week. It will be perfect if we will get an opportunity to enter Long around it.
The technical portion of Sive's analysis owes a great deal to Joe DiNapoli's methods, and uses a number of Joe's proprietary indicators. Please note that Sive's analysis is his own view of the market and is not endorsed by Joe DiNapoli or any related companies.
As we’ve said in previous research, we will gradually add more fundamental issues, since analyzing gold without them looks not quite proper approach. As we know already, Gold is entering seasonal bear trend and it will last till the end of summer approximately. This is not neccesarily will lead to decreasing, but gold will feel the preasure of bearish sesonality and upward moves could be depressed. Also let’s take a look at new COT report. We see that speculators net long positions have slightly increased. However currently we’re mostly interesting not with the absolute number of net long positions, but with their relative value. I have to say, that 80K net longs is a minimum longs within last 5-6 years, since gold stands in long term bull trend. The upper value, as you can see even from this chart stands around 200 K contracts on gold. So, when speculators long positions stands at minimum and they have a lot of room to grow – this could indicate the eve of bullish trend continuation. Currently we can’t assume yet downward drastical reversal on gold market yet. Thus, current situaion still looks bullish in long-term.
However the most important issue is similarity of price action in 2006 and in 2011. As a rule speculative positions support the trend, because, in fact, they are the trend, or do not move in opposite direction. In 2006 we see clear divergence, when net long positions were decreasing, while gold prices climbed higher. And now take a look at current moment – the same situation, interesting, right? But I’m not done yet.
Second fundamental moment that I would like to add here is Gold ETF holdings. I’m not very interested in total assets value, since they stand under impact of currency fluctuations. What I’m really interesting is physical holding of gold in tones or ounces. There are not many of them. Total assets of such ETFs stands around 85-88 Bln dollars, but I mostly use assets of just one fund - SPDR ETF, since it owns 85% of total Gold ETFs – around 77 Bln dollars and it holds approximately 1300+ Tones of physical gold. So, tracking the dynamic of real holdings we can assess the interest of investors to gold. And here is what we can see:
In 2011 - 2012 gold stands in the range and even has decreased in value, while real physical holdings of the gold in World biggest ETF has risen for 100-150 Tones.
The picture we can see with Open Interest – holdings stands flat. It means that investors do not leave gold market, while Open interest decreasing. What does it mean?
If speculative net longs are growing, but Open Interest decreasing – it means that short positions are decreasing, right?
So, today’s analysis shows that bullish potential on Gold market still holds and pressure is growing.
Monthly
Monthly analysis has not changed much. Actually currently we see inside month is developing compares to January. So conclusion here is the same:
This time frame extremely useful for gold market, since as you can see it stands in the range within 1.5 years. Why? Well, generally it could be explained by changing environment on financial markets. Globe economy has felt extremely bad, demand for gold was solid from China and India, banks have invested in gold actively as well - so invest in gold was simple. But now situation looks more complicated and blur. We see some improvements here and there, US stock market is growing, but bond yields still hold on all time lows. From time to time we see good statistics data, for example on US house market, but later we again see disappointing numbers. The same is in EU. It is possible that gold has turned to consolidation because it looks like to abandon gold is too early and risky and what the alternative, but conversely – something is changing, and may be it’s too late to invest in gold? So, market in fact, stands on guard and “hold” longs. Because if sell-off has started, we probably now should have gold around 1200$. Such situation and overall sentiment on the market puts impact on trading style, because traders can’t join long-term trends, they have to search for short-term trading against some significant levels and not marry any positions, trades have to be based on definite patterns that could give definite entry level, stop and profit objectives. That is the short characteristic of current gold market.
Still, current technical picture confirms conclusions of COT analysis. Market has non-obvious bullish gravitation. It could be seen from tight consolidation; market has shown very tight retracement after tremendous trend up and still stands tight. This usually happens before upward continuation.
On first chart we see two significant moments. First – take a look at trend by MACD. It is strongly bearish, but what is a price action? Right, it’s flat and does not support bear trend. This could suggest hidden bullish power and calls as “Dynamic pressure”. Second is, market is flirting with yearly pivot point at 1665 area. Yearly pivots are important by two reasons. Gold market has a tendency to create high or low for the year during first quarter. If market will move below it and take out current year lows around 1620 – I do not want to be bullish on Gold. That is the first scenario – keep an eye on yearly pivot and current year low. If market will move below it – our road is to yearly pivot support 1 that is lower border of consolidation as well. Will it mean that bullish sentiment is broken? Not necessarily. We know that when market stands in a long-term bull trend – Pivot Support 1 should hold retracement, if trend is still in play. Besides, move to lower border of consolidation doesn’t mean yet that bearish breakout will follow.
Now let’s speak about bullish perpsectives. I think that here could be Butterfly with 1.27 around 2000 level. Now it looks not as accurate as previously, but initial swing still intact. If we will stick with horizontal consolidation – in the case of upward breakout it will give us the same destinaton. Also you can see here triangle. Anyway, all patterns suggest upward move.
As conclusion from analysis of monthly chart we can say – two crucial levels for us here. They are 1625 current year low. Until it holds – we have a hope to upward continuation. If it will fail – we will turn on way to yearly pivot support 1 and lower border of monthly coil – 1536, that is a second level to watch.
WeeklyWe have an inside week, so nothing to add here as well. From the weekly perspective we have situation of stalemate. From the one point of view, trend is bearish. We have completed downward AB=CD pattern + Agreement right at 5/8 Fib support and shallow bounce up, that looks heavy and not impressive. Price now stands right around MPP=1662 that is also very close to yearly pivot. Until market stands above yearly lows (red circle) it is better to search possibility to enter long, but as closer to 1625 as possible. This level is also MPS1 and previous consolidation support, currently we see weak respect of AB=CD, but this is Gartley “222” Buy as well, so, it might be re-test of this low and upward move. You should know that 0.618 retracements is a favorable level for Gold. It usually shows deep retracements and as a rule they are 0.618. Besides, this level is very common for butterflies.
If market will pass lower, then we should be ready for downward move right to the low of current consolidation. That’s why until this level holds it is better to tune on long positions with reasonable risks.
Daily
Luckily on gold we finally have got some action that is worthy to be discussed. Actually there are two significant moments. First is downward flag breakout. Although Friday’s session was inside one, price has closed lower than the border of the flag. But what is more significant – is bearish dynamic pressure. On gold market we see that trend almost whole week holds bullish, but price action does not support it and continues to creep lower with MACD line. It means that perspectives of previous low taking become greater. Thus, from perspectives of these moments, we do not want to see return right back inside the flag. If this will happen, then we could get the move till upper border of the flag at minimum, or even upward continuation.
4-hour
Trend is bearish here. We still have this AB=CD pattern that could lead market to agreement with daily 0.768 Fib support. I do not know – is proper way to show this as butterfly, since it has rather choppy price action and hardly identificated, but, anyway, the 1.27 extension of BC leg stands around 1640 area as well.
1-hour
Here we see the breakout of the wedge pattern and re-testing of the lower border. In general on intraday charts situation looks more bearish rather than bullish. As usual, in the beginning of the week we should keep an eye on WPP around 1671, that is also nearest Fib resistance. So, if you already have short position, as we’ve entered on Thursday around 1680 – probably it makes sense to keep them, since now probability of moving to 1640 is greater than on previous week. If you search possibility to enter short – take a look at 1671 area. Finally, if you’re bullish – then better sit on the hands and wait, when market will reach 1640 or show failure breakout and return right back inside of consolidation. Mostly short-term analysis was made for scalp traders...
Conclusion:As we’ve mentioned, gold stands among most cunning markets. Long-term picture suggests that market still stands in long-term bullish trend and has not broken yet, despite on 1.5 year consolidation. If upward move will continue, then market could reach 2000 level within 12-18 months.
If market will move and hold below current year’s low at 1625 – that could trigger retracement to 1536 level – low border of consolidation and yearly PS1. But even this move will not erase bullish trend.
Sentiment analysis shows that bullish pressure is growing on long-term charts. Demand for physical gold has not reduced much, speculators hold long positions and their amount near the low.
On lower time frame market shows more signs of possible move to 1640 than on previous week. It will be perfect if we will get an opportunity to enter Long around it.
The technical portion of Sive's analysis owes a great deal to Joe DiNapoli's methods, and uses a number of Joe's proprietary indicators. Please note that Sive's analysis is his own view of the market and is not endorsed by Joe DiNapoli or any related companies.
Last edited:


") , I wont share my chart as my H4 candle closes at different time to Sives
, I wont share my chart as my H4 candle closes at different time to Sives