Sive Morten
Special Consultant to the FPA
- Messages
- 18,690
Fundamentals
Weekly Gold Tading Report prepared by Sive Morten exclusively for ForexPeaceArmy.com
Gold pared gains after rising one percent on Friday, on track for a small weekly loss, as the dollar steadied following weaker than expected U.S. economic data.
U.S. gold for April delivery edged up $6.40 to settle at $1,227.10 an ounce. The U.S. precious metals floor will shut on Monday for the Presidents Day holiday, when the Globex metals will close early at 1 p.m.
"We are in a holding pattern between $1,150 and $1,300 because there isn't enough clarity around when the Fed is going to be hiking interest rates and what is going to be happening with Greece," ING Bank senior strategist Hamza Khan said.
A weaker dollar supports gold by making the dollar-denominated asset cheaper for holders of other currencies.
But outlook for the dollar remained upbeat despite the current pause in its long-term rally, as many investors continued to price in an interest rate hike by the Federal Reserve some time this year.
Any hike by the Fed, which has kept rates near zero since 2008 to stimulate the U.S. economy, could hurt demand for bullion, a non-interest-bearing asset.
"Gold short-covering continues as the cease fire seems to hold in the Ukraine," said George Gero, precious metals strategist for RBC Capital markets in New York, in a note.
"Short week next week and open interest (is) showing again too many bears so traders are re-purchasing previously sold positions."
Stock markets worldwide rose on stronger-than-expected German economic growth data and optimism that Greece could reach a deal with its creditors, while oil prices gained on signs that excess supply may ebb.
Holding in the SPDR Gold Trust , the world's largest gold-backed exchange-traded fund, fell 0.23 percent to 771.51 tonnes on Thursday.
In the physical markets, Chinese buying remained stable ahead of the Lunar New Year holiday next week. Premiums on the Shanghai Gold Exchange traded unchanged on the day at $3-$4 an ounce on Friday.
Recent CFTC data shows contraction of positions as in terms of open interest as in terms of net long position. At the same time we have to say that long-to-total position ratio has dropped a bit but still stand around 82%. As we’ve expected this could become the reason for retracement and now we see it.
SPDR fund also reports on ~ 5 tonnes drop to 768 tonnes. But this is acceptable decrease compares to previous inflows and gold price change in last 2 weeks. That’s being said although recent data shows decrease but the value of decreasing suggests mostly retracement than real trend reversal.
Here is detailed breakdown of speculative positions:
Open interest:
 Shorts:
 Longs:

Technicals
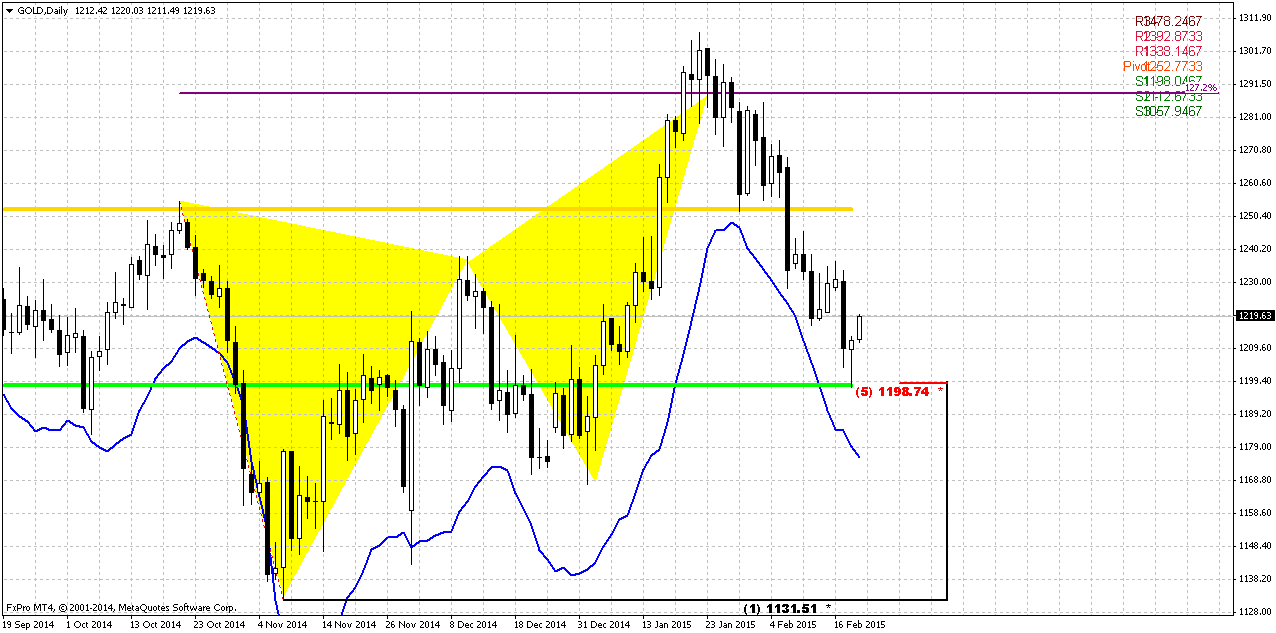
Monthly
Here we still have last big pattern in progress that is Volatility breakout (VOB). It suggests at least 0.618 AB-CD down. And this target is 1050$. Still, this is really big setup and current move up could be treated as BC leg. If this leg will exceed ~1433 area then we will need to adjust current AB-CD and we will get closer final destination point – may be no 1050, but 1080 or even 1100…
Since the beginning of the year market shows solid upside action. Market was able to exceed yearly pivot, passed half way to Yearly Pivot resistance 1 but right now has turned to retracement and returned right back to Yearly Pivot Point... and take a look move below it. Still price stands very close to it and it is too early to speak on breakout. But if true breakout will come – this could be very significant moment and next logical destination will be yearly pivot support 1.
At the same time the major driving factor for Gold is inflation. Previous data has shown anemic pace of it or even decreasing. But last NFP data has value not just because of increasing of employment but increasing of cost of labor. Data has shown 12 cent growth and this is approximately 2,2% of annual inflation Currently this numbers have negative effect on gold, since they simultaneously increase chance of rate hike, but when rate will be increased and inflation will show gradual upside pace – this will be supportive factor for gold. Especially if this will be accompanied by reversal on crude oil. But this is future talks and currently we do not see reasons yet to cancel our 1050$ target or at least possible big AB-CD down.
Shortly speaking gold now will fluctuate in difficult period. If coming data will be gradual and supportive for rate hike – NFP will continue show upside trend, inflation will grow, GDP will keep high pace – gold will remain under pressure till first rate hike. After that inflation will be supportive factor for gold.
If data will be mixed as it was recently – then it could lead to local strength on gold market.
Still, if we will take into consideration geopolitical situation and risks that have appeared recently, it could happen that current upside action could become not just retracement but real reversal and changing in global sentiment and risk assessment. Because even technically we have reversal pattern at place on monthly chart – 1.27 Butterfly...Trend has turned bullish here. Recent CFTC and SPDR data support this opinion and geopolicy could overcome any economical issues.
That’s being said, economical data supports further gold decreasing but geopolicy could bring significant adjustment. Our short-term task is to watch for Yearly Pivot and its possible breakout.

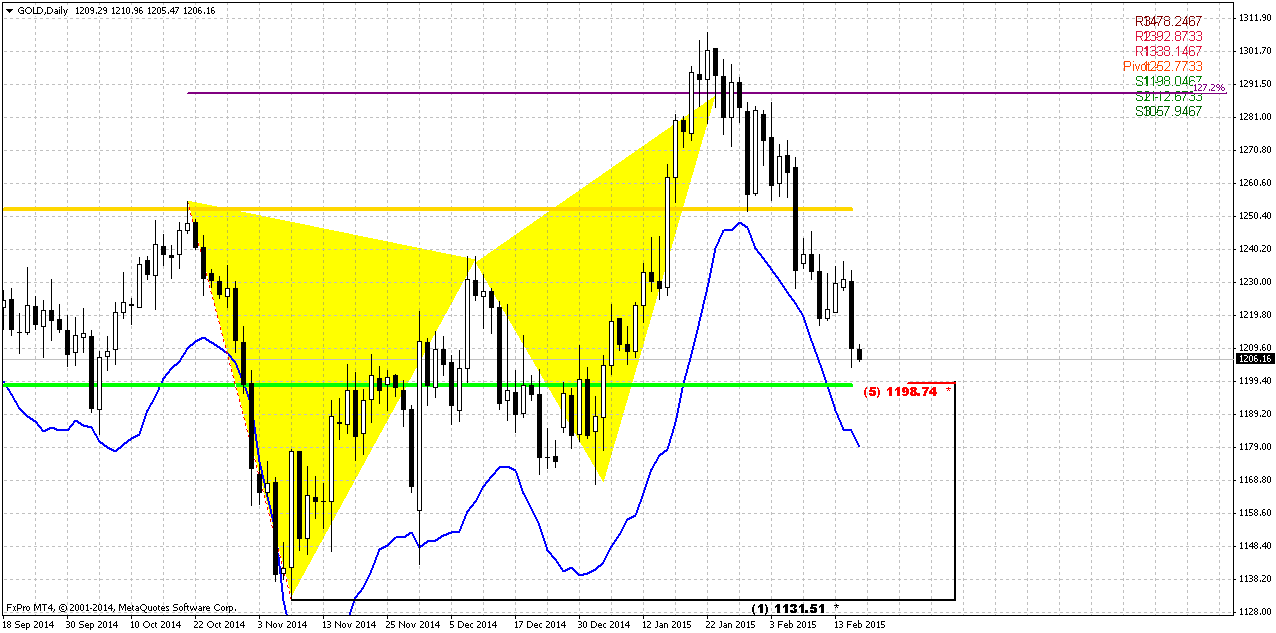
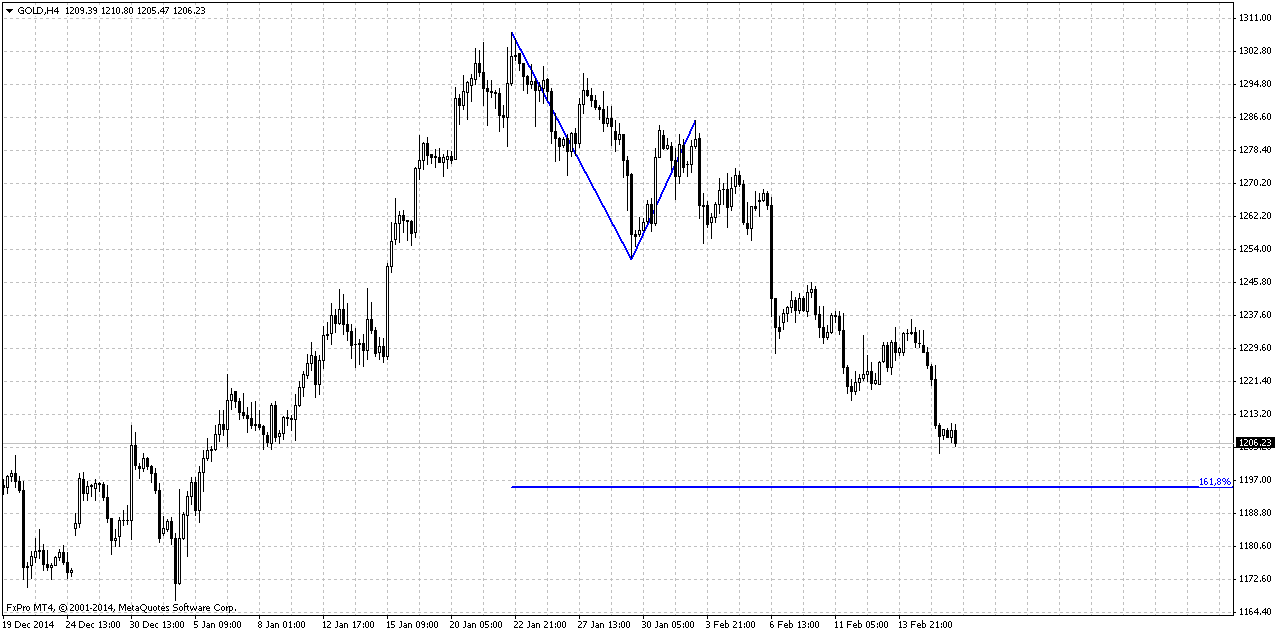
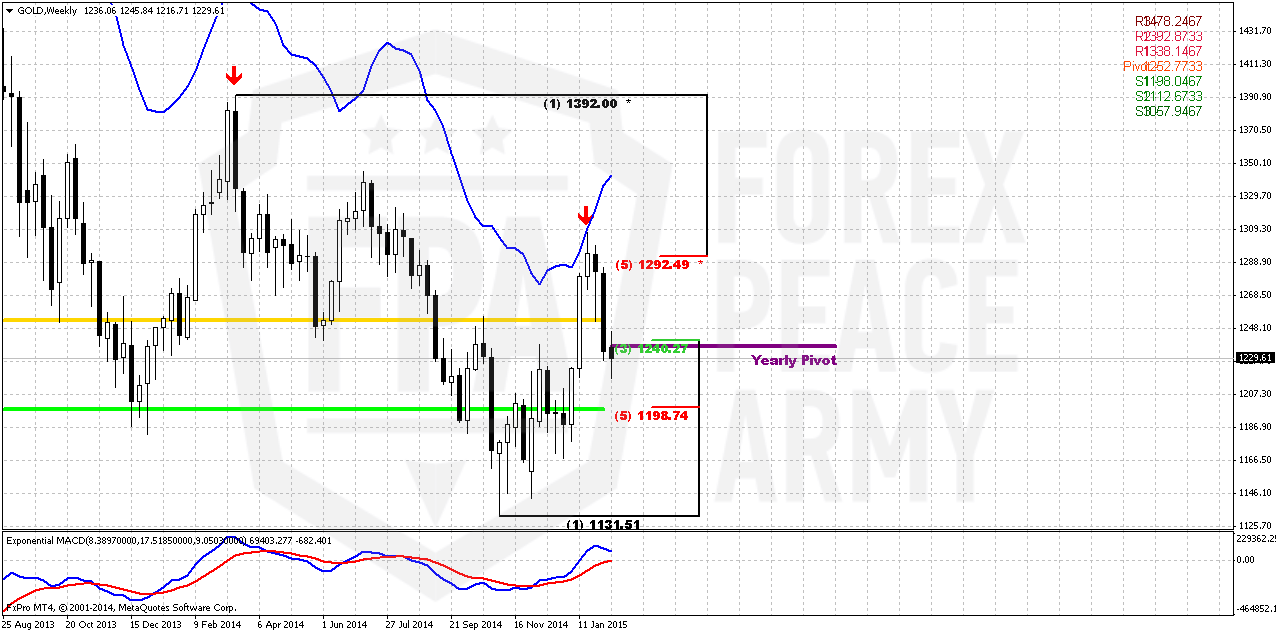
Weekly
As a result of NFP data gold shows deep and fast retracement. Still it brings nothing drastical yet. Partially we’ve expected something of that sort, since even on previous week we’ve pointed on existence of DiNapoli “Stretch” pattern – combination of weekly overbought and Fib resistance.
Right now price shows mild break through YPP but 3/8 Fib support is done already. Action was rather fast. Breaking of this level will not be very good sign for bulls, of cause. Moving back below yearly pivot is not good sign. Still, we think that 1200 area has more importance. Gold likes to show deep retracements and now it comes down from overbought. 1200 is MPS1 and 5/8 Fib support. Until pivot support holds retracement – previous trend is valid and MACD confirms this by far. Also do not forget about big ratio of CFTC data that is supportive for retracement down. Conclusion here is as follows – we will be glad if gold will turn up again right from here. But we have to say that odds suggest deeper retracement right to 1200 area and this will be crucial area. I’ve marked two patterns by red arrows. They area different by have similar impact on short-term perspective. First one was bearish engulfing while recent one looks as evening star. Yes, we have to candles on top, but overall action has the same market mechanics. I’m telling this because you can take a look what has happened when engulfing pattern was formed and this was not at overbought. This situation significantly increases further downward action. Breaking through 1200 will suggest changing in weekly trend.
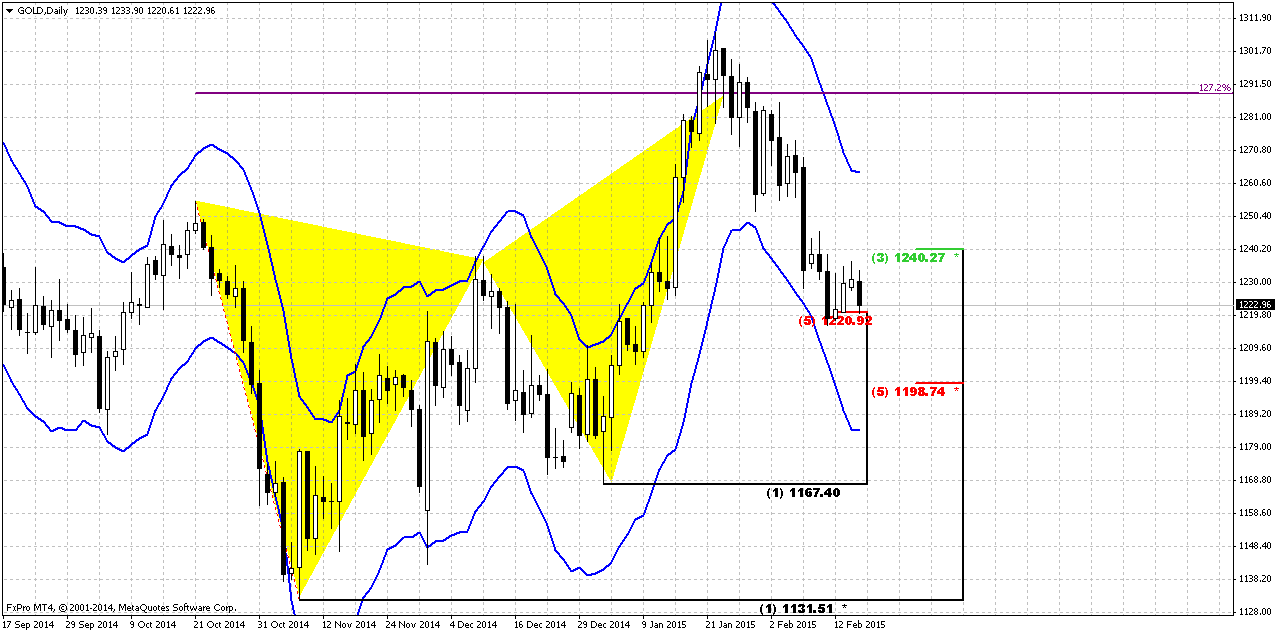
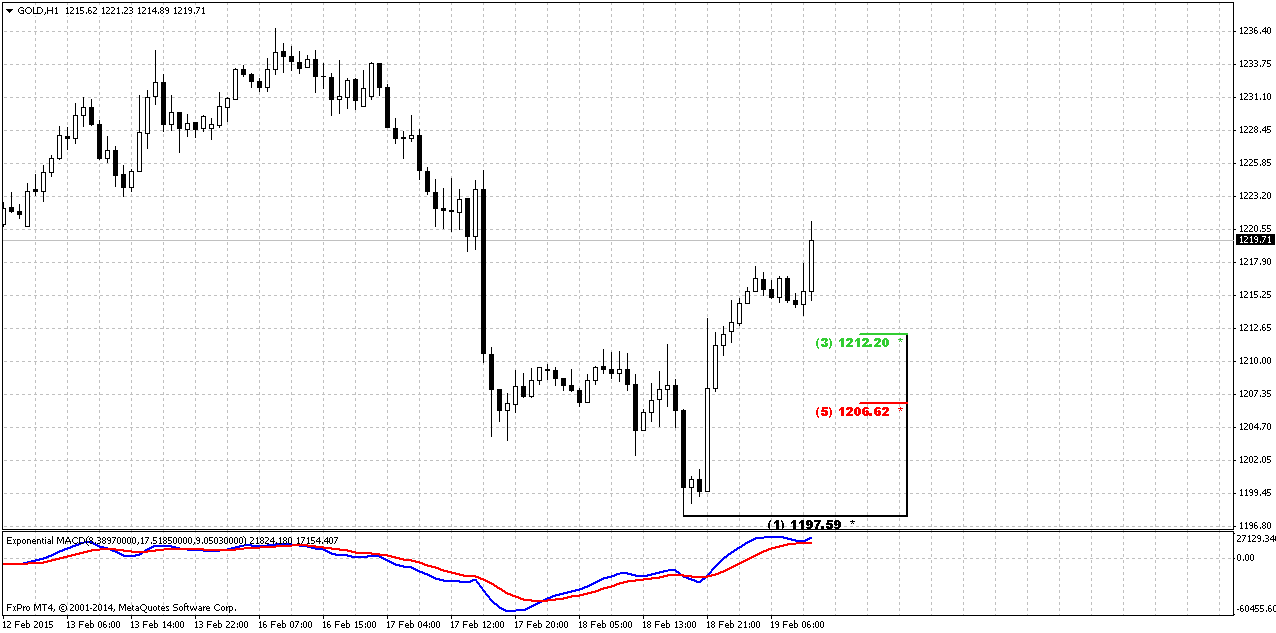
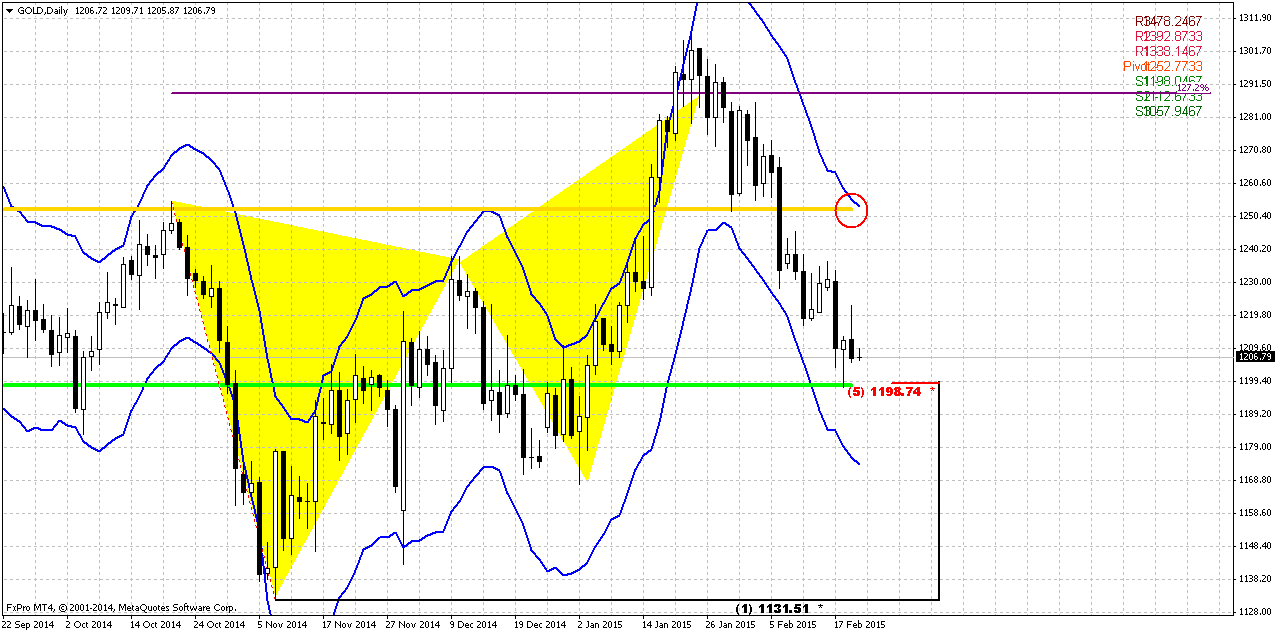
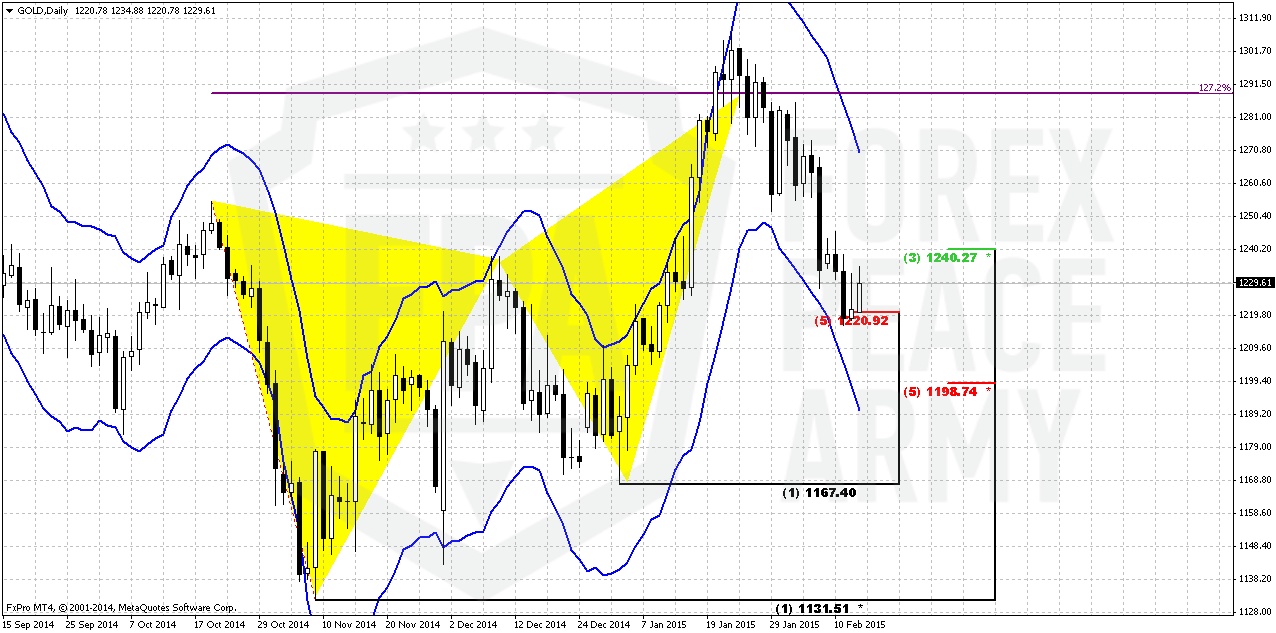
Daily
Price action on previous week was mostly anemic. Initially market has expected Minsk results, and when they have come just lightly positive gold just has stuck in our K-support that we’ve discussed on previous week. So, some chances on small upside retracement out from here still exist as on previous week, but downward action after that probably will continue.
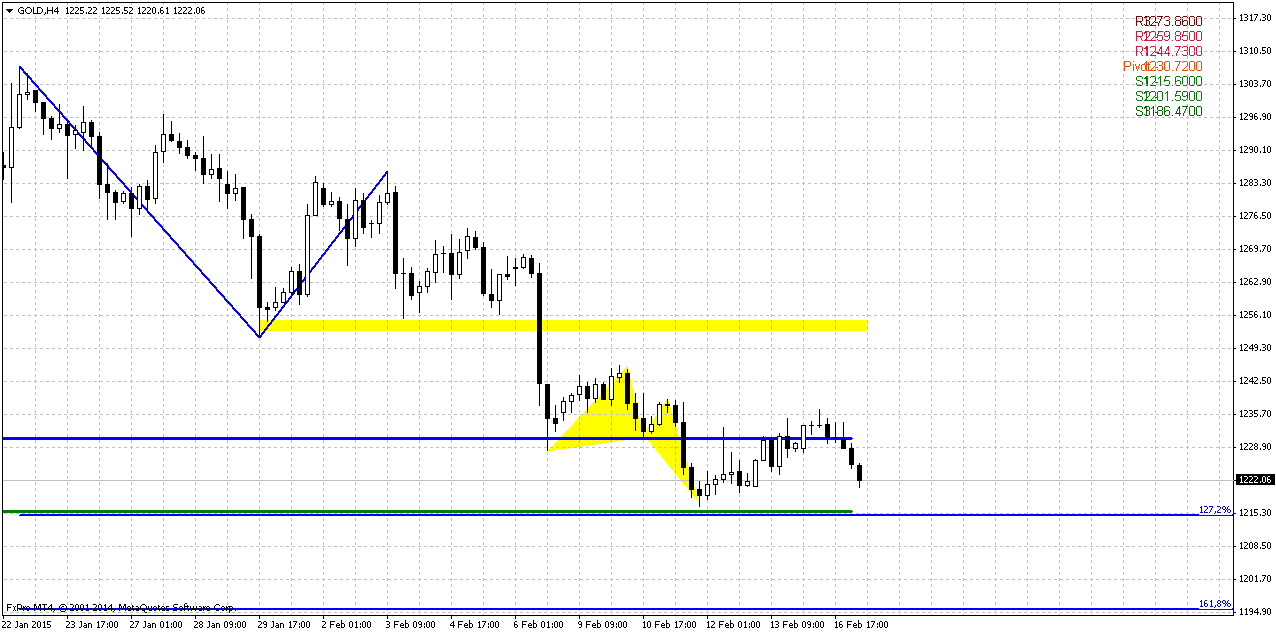
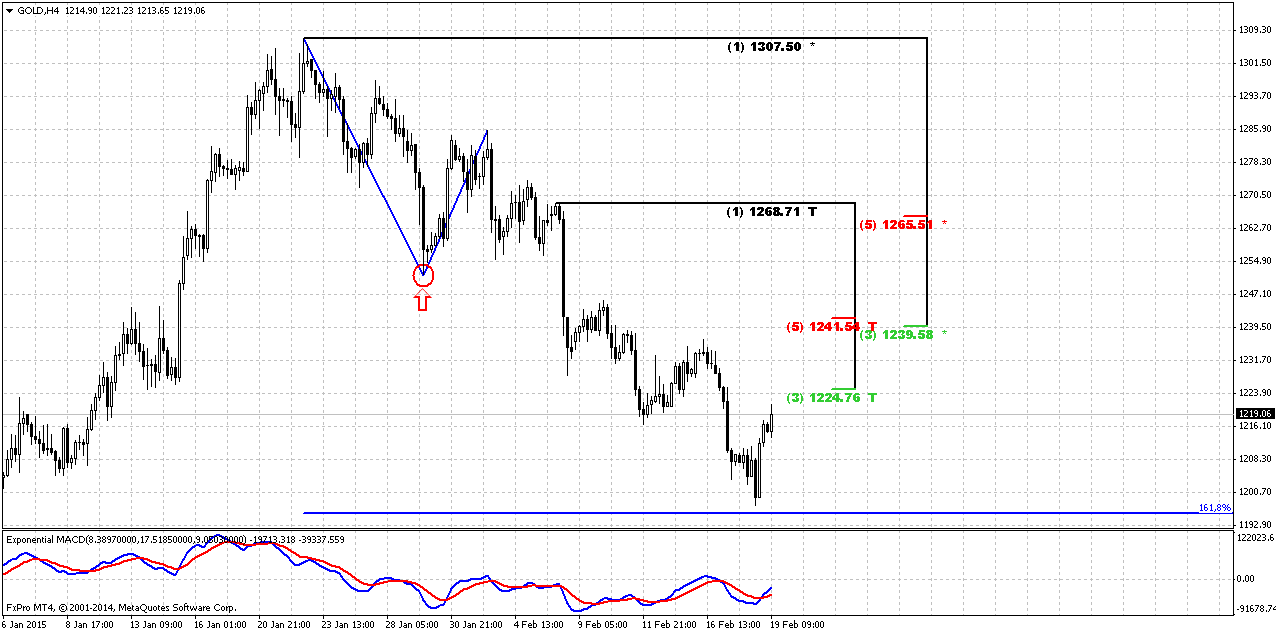
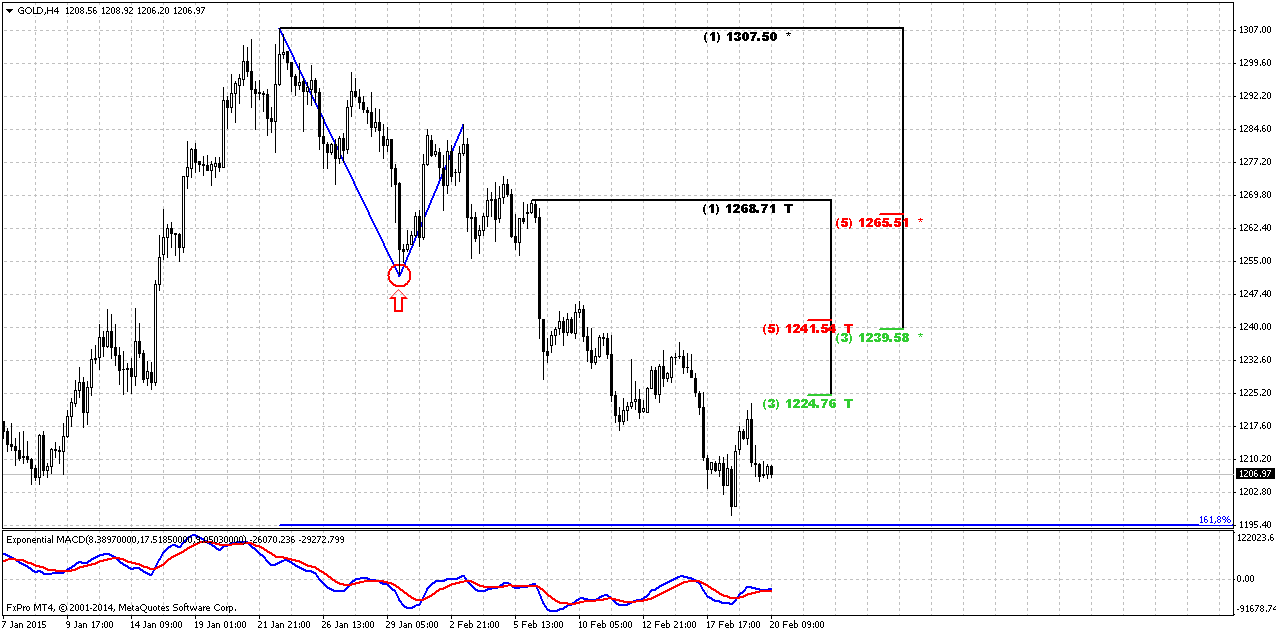
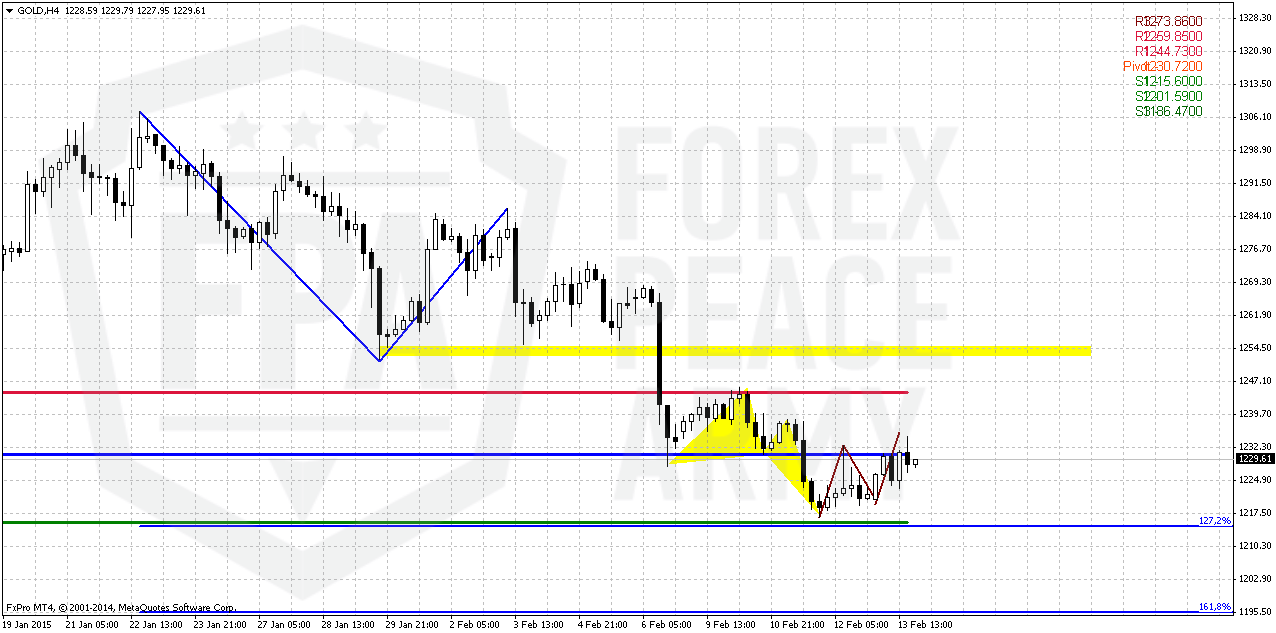
4-hour
4-hour chart probably will be most interesting for us. We still will continue action around AB-CD pattern. As CD leg was rather fast – it hints on further downward action and 1.618 target stands right at 1200 area creating an Agreement with major Fib support level. On Friday we’ve expected another small butterfly and reaching of 1.27 AB-CD target around WPS1. But gold has found some power and completed small AB-CD retracement. If upside retracement will happen – then gold probably will reach an area between WPR1 and 1255 – previous lows. If market will fail to pass through WPP – then it will probably continue move down right to 1200.
Conclusion:
From technical point of view we have no reasons yet to abandon possible long-term downward AB-CD as VoB (Volatility breakout) development. Current upside action does not contradict to it and in fact could become “BC” leg of this pattern.
Taking into consideration the way how gold moves, CFTC data that shows different trend in positions we think that major factors are geopolitical and fundamental. Shortly speaking we suspect that current action could be not just retracement and indicates global shifts in sentiment of investors who start to feel some tension and growing risk. Gold right now enters in turbulence period. Speaking from economical point of view – further improvement in US economy – growth of GDP, employment, consumption and inflation will keep gold under pressure, since it increases chances on rate hike. But when first rate hike will happen and inflation will show solid trend – gold will get support. Any drawdown in positive US data could bring local rally on gold. Also geopolicy comes on lead position and could overcome any financial data.
In short-term perspective although chances on shy upside action still exists, but recent action mostly points on further drop to 1200 that will become moment of truth for weekly bullish trend.
The technical portion of Sive's analysis owes a great deal to Joe DiNapoli's methods, and uses a number of Joe's proprietary indicators. Please note that Sive's analysis is his own view of the market and is not endorsed by Joe DiNapoli or any related companies.
Weekly Gold Tading Report prepared by Sive Morten exclusively for ForexPeaceArmy.com
Gold pared gains after rising one percent on Friday, on track for a small weekly loss, as the dollar steadied following weaker than expected U.S. economic data.
U.S. gold for April delivery edged up $6.40 to settle at $1,227.10 an ounce. The U.S. precious metals floor will shut on Monday for the Presidents Day holiday, when the Globex metals will close early at 1 p.m.
"We are in a holding pattern between $1,150 and $1,300 because there isn't enough clarity around when the Fed is going to be hiking interest rates and what is going to be happening with Greece," ING Bank senior strategist Hamza Khan said.
A weaker dollar supports gold by making the dollar-denominated asset cheaper for holders of other currencies.
But outlook for the dollar remained upbeat despite the current pause in its long-term rally, as many investors continued to price in an interest rate hike by the Federal Reserve some time this year.
Any hike by the Fed, which has kept rates near zero since 2008 to stimulate the U.S. economy, could hurt demand for bullion, a non-interest-bearing asset.
"Gold short-covering continues as the cease fire seems to hold in the Ukraine," said George Gero, precious metals strategist for RBC Capital markets in New York, in a note.
"Short week next week and open interest (is) showing again too many bears so traders are re-purchasing previously sold positions."
Stock markets worldwide rose on stronger-than-expected German economic growth data and optimism that Greece could reach a deal with its creditors, while oil prices gained on signs that excess supply may ebb.
Holding in the SPDR Gold Trust , the world's largest gold-backed exchange-traded fund, fell 0.23 percent to 771.51 tonnes on Thursday.
In the physical markets, Chinese buying remained stable ahead of the Lunar New Year holiday next week. Premiums on the Shanghai Gold Exchange traded unchanged on the day at $3-$4 an ounce on Friday.
Recent CFTC data shows contraction of positions as in terms of open interest as in terms of net long position. At the same time we have to say that long-to-total position ratio has dropped a bit but still stand around 82%. As we’ve expected this could become the reason for retracement and now we see it.
SPDR fund also reports on ~ 5 tonnes drop to 768 tonnes. But this is acceptable decrease compares to previous inflows and gold price change in last 2 weeks. That’s being said although recent data shows decrease but the value of decreasing suggests mostly retracement than real trend reversal.
Here is detailed breakdown of speculative positions:
Open interest:
Technicals
Monthly
Here we still have last big pattern in progress that is Volatility breakout (VOB). It suggests at least 0.618 AB-CD down. And this target is 1050$. Still, this is really big setup and current move up could be treated as BC leg. If this leg will exceed ~1433 area then we will need to adjust current AB-CD and we will get closer final destination point – may be no 1050, but 1080 or even 1100…
Since the beginning of the year market shows solid upside action. Market was able to exceed yearly pivot, passed half way to Yearly Pivot resistance 1 but right now has turned to retracement and returned right back to Yearly Pivot Point... and take a look move below it. Still price stands very close to it and it is too early to speak on breakout. But if true breakout will come – this could be very significant moment and next logical destination will be yearly pivot support 1.
At the same time the major driving factor for Gold is inflation. Previous data has shown anemic pace of it or even decreasing. But last NFP data has value not just because of increasing of employment but increasing of cost of labor. Data has shown 12 cent growth and this is approximately 2,2% of annual inflation Currently this numbers have negative effect on gold, since they simultaneously increase chance of rate hike, but when rate will be increased and inflation will show gradual upside pace – this will be supportive factor for gold. Especially if this will be accompanied by reversal on crude oil. But this is future talks and currently we do not see reasons yet to cancel our 1050$ target or at least possible big AB-CD down.
Shortly speaking gold now will fluctuate in difficult period. If coming data will be gradual and supportive for rate hike – NFP will continue show upside trend, inflation will grow, GDP will keep high pace – gold will remain under pressure till first rate hike. After that inflation will be supportive factor for gold.
If data will be mixed as it was recently – then it could lead to local strength on gold market.
Still, if we will take into consideration geopolitical situation and risks that have appeared recently, it could happen that current upside action could become not just retracement but real reversal and changing in global sentiment and risk assessment. Because even technically we have reversal pattern at place on monthly chart – 1.27 Butterfly...Trend has turned bullish here. Recent CFTC and SPDR data support this opinion and geopolicy could overcome any economical issues.
That’s being said, economical data supports further gold decreasing but geopolicy could bring significant adjustment. Our short-term task is to watch for Yearly Pivot and its possible breakout.
Weekly
As a result of NFP data gold shows deep and fast retracement. Still it brings nothing drastical yet. Partially we’ve expected something of that sort, since even on previous week we’ve pointed on existence of DiNapoli “Stretch” pattern – combination of weekly overbought and Fib resistance.
Right now price shows mild break through YPP but 3/8 Fib support is done already. Action was rather fast. Breaking of this level will not be very good sign for bulls, of cause. Moving back below yearly pivot is not good sign. Still, we think that 1200 area has more importance. Gold likes to show deep retracements and now it comes down from overbought. 1200 is MPS1 and 5/8 Fib support. Until pivot support holds retracement – previous trend is valid and MACD confirms this by far. Also do not forget about big ratio of CFTC data that is supportive for retracement down. Conclusion here is as follows – we will be glad if gold will turn up again right from here. But we have to say that odds suggest deeper retracement right to 1200 area and this will be crucial area. I’ve marked two patterns by red arrows. They area different by have similar impact on short-term perspective. First one was bearish engulfing while recent one looks as evening star. Yes, we have to candles on top, but overall action has the same market mechanics. I’m telling this because you can take a look what has happened when engulfing pattern was formed and this was not at overbought. This situation significantly increases further downward action. Breaking through 1200 will suggest changing in weekly trend.
Daily
Price action on previous week was mostly anemic. Initially market has expected Minsk results, and when they have come just lightly positive gold just has stuck in our K-support that we’ve discussed on previous week. So, some chances on small upside retracement out from here still exist as on previous week, but downward action after that probably will continue.
4-hour
4-hour chart probably will be most interesting for us. We still will continue action around AB-CD pattern. As CD leg was rather fast – it hints on further downward action and 1.618 target stands right at 1200 area creating an Agreement with major Fib support level. On Friday we’ve expected another small butterfly and reaching of 1.27 AB-CD target around WPS1. But gold has found some power and completed small AB-CD retracement. If upside retracement will happen – then gold probably will reach an area between WPR1 and 1255 – previous lows. If market will fail to pass through WPP – then it will probably continue move down right to 1200.
Conclusion:
From technical point of view we have no reasons yet to abandon possible long-term downward AB-CD as VoB (Volatility breakout) development. Current upside action does not contradict to it and in fact could become “BC” leg of this pattern.
Taking into consideration the way how gold moves, CFTC data that shows different trend in positions we think that major factors are geopolitical and fundamental. Shortly speaking we suspect that current action could be not just retracement and indicates global shifts in sentiment of investors who start to feel some tension and growing risk. Gold right now enters in turbulence period. Speaking from economical point of view – further improvement in US economy – growth of GDP, employment, consumption and inflation will keep gold under pressure, since it increases chances on rate hike. But when first rate hike will happen and inflation will show solid trend – gold will get support. Any drawdown in positive US data could bring local rally on gold. Also geopolicy comes on lead position and could overcome any financial data.
In short-term perspective although chances on shy upside action still exists, but recent action mostly points on further drop to 1200 that will become moment of truth for weekly bullish trend.
The technical portion of Sive's analysis owes a great deal to Joe DiNapoli's methods, and uses a number of Joe's proprietary indicators. Please note that Sive's analysis is his own view of the market and is not endorsed by Joe DiNapoli or any related companies.