Sive Morten
Special Consultant to the FPA
- Messages
- 18,695
Fundamentals
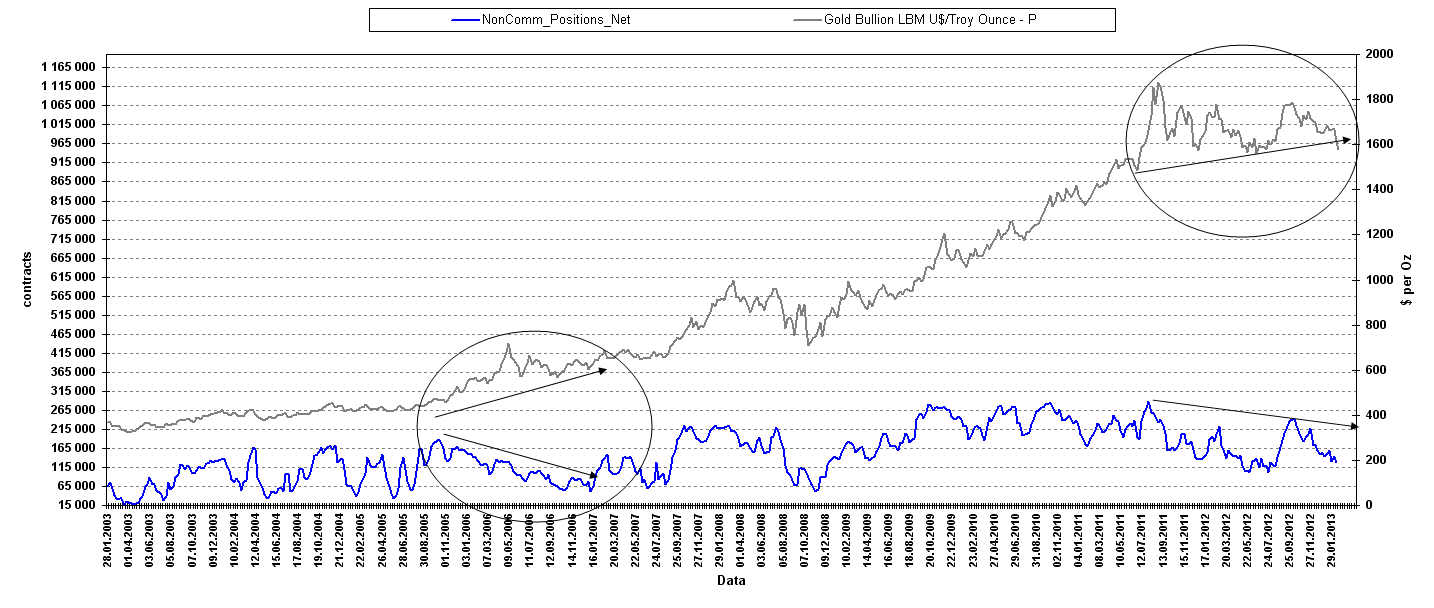
Let’s start our discussion from most recent COT report. As gold turns south – reaction in sentiment be not long in coming. Although long position of speculators remains at at the same level and has shown just small decreasing, short positions have increased significantly and, as a result, net long positions has decreased. Total open interest also has increased, and shows jump in short positions. Still, let’s avoid to dramatize the situation yet. COT report indeed shows increasing interest to short positions and shows increasing of shorts positions per se.
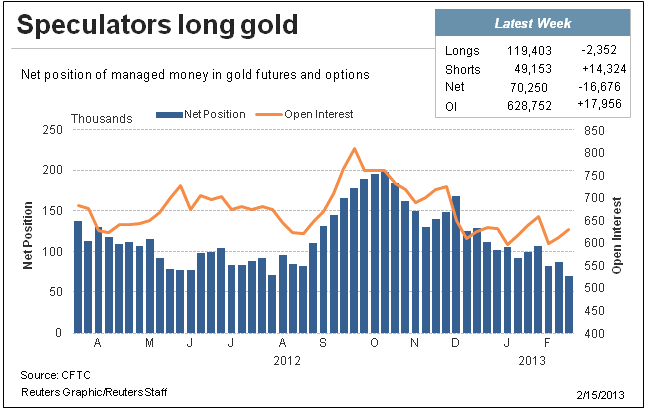 At the same time, we have unresolved situation with divergence between Gold prices and speculative positions. This is the second case of such divergence since 2003. On the chart, that we’ve started discussion on previous week we see that from 2004 minimum level on non-commercial (speculators) net positions stands around 50-60 K contracts and currently, as we said they are almost at minimum. Hence this contradiction has to be resolved soon. How it should happen? Take a look at the chart and the first ellipse first. See – when the price of gold tested the trend line for the last time (when arrow stands) and then market has broken previous high – speculative positions has shown fast appreciation.
Currently we probably should stand somewhere near this point. Most recent downward swing of Gold price has not broken the trend line yet (as you will see on monthly chart), that stands for February at ~1570, so this upward trend still holds. At the same time speculative positions are near the low, but the still have room to decrease for another 5-10K. The thing that I want to say is - it’s not done yet with upward trend in long-term perspective, even based on sentiment analysis. This divergence can’t last forever, it should be resolved – either gold market has to drop significantly, or upward continuation should follow.
Analysis of SPDR Fund holdings shows small decrease in physical gold and situation has not changed drastically yet, compares to previous week.

Finally, before we will pass to technical issues, I want to attract your attention to the event that has passed almost invisibly in mass-media. I’m speaking about Germany intention to repatriate all physical gold, that now holds in foreign countries, and US stands among of them:
The following table shows the current and the envisaged future allocation of Germany's gold reserves across the various storage locations:
31 December 2012 31 December 2020
Frankfurt am Main 31 % 50 %
New York 45 % 37 %
London 13 % 13 %
Paris 11 % 0 %
To this end, the Bundesbank is planning a phased relocation of 300 tonnes of gold from New York to Frankfurt as well as an additional 374 tonnes from Paris to Frankfurt by 2020.
Source: Bundesbank January 16, 2013
What else we know? There are some rumors, that Netherlands and Azerbaijan could follow the Germany. Besides, China gradually continue to increase its reserves of Gold and if it will continue they could announce within 1-2 years - “hey, we have 3000 tones (or even 4000 tones) of Gold”. But this is not the point. The point is – “what that repatriation is?” My thought that this even stands among most significant events on gold markets and it is extremely important for long-long term picture. This is, in fact, the clone of Charles De Gaulle act to exchange all US Dollars into Gold in 60’s. (You can read about it in our Forex Military School).
Why this is important? In normal situation no major central bank will call for withdrawal of 300 tones of gold from another major central bank. My thought is that first – Germany would like to audit US and check is it really all gold safe, second – Germany probably sees significant risks of currencies, especially US Dollar and EUR in long-term perspective and tells that “Gold is the currency”. Now, imagine, what will happen if after the Germany other countries will follow?
Another significant moment is – why this procedure should be accomplished to 2020? Is it really so difficult to transfer 300 tones? I suspect that US doesn’t have this gold, not in term that they have lost it, but this gold was put in some turnover. Before this huge upward trend has started, the lending against the gold was very common transaction. Hence, it is possible that gold was put as collateral or lend somehow and US need time to gather it or purchase on open market.
One of the most famous and respectable gold traders Jim Sinclair tells on this event that it could become most significant precedent on Gold market within 50 years. It could put the end to US Dollar as reserve currency and lead gold above previous high to 2111$.
What’s conclusion could be made here? From the fundamental point of view we see some decreasing interest to gold in short-term perspective and we know that gold now stands in seasonal bear trend. Lack of inflationary pressure is also put negative impact on gold prices and in short term perspective 3-6 months gold could show downward action still.
However, in longer term perspective we see warning signs that could stimulate gold purchases and Germany precedent could lead to significant consequences. Second, short-term decreasing has not broken yet positive potential that divergence between gold price and speculators position carries. All these moments allows us to point that it’s too early to speak about global trend changing to bearish. Long-term bullish trend still holds and technical picture will confirm this.
Monthly
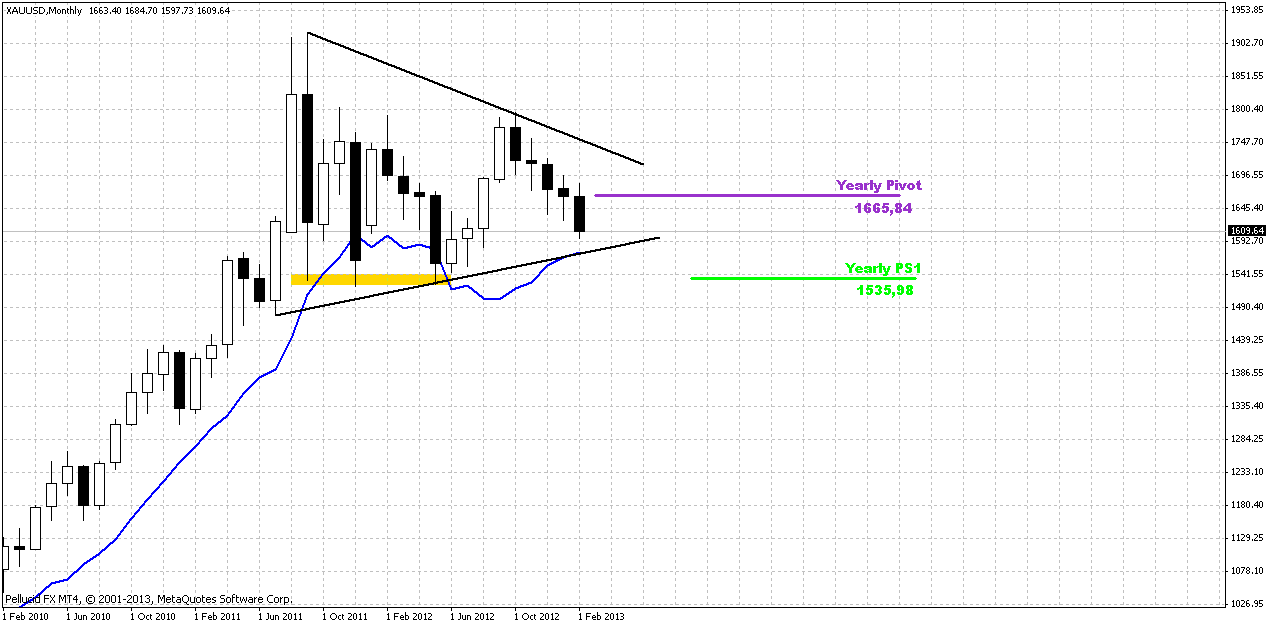
Here is on monthly chart we probably can say, that yes, this is plan “B” guys. After a month of flirting around 1665 yearly pivot, when price has tested it with 1625 move and returned right back, market has taken out this low and continue move down. In fundamental part of research we said, that technical picture tells that long-term bullish trend is still valid, and this is indeed so. How bullish trend usually develops from pivot points’ framework? Price either touches pivot and go (our former plan “A”) or it retracement to pivot support 1. Until price stands above Pivot support 1 – we can say that this is a retracement yet. It assumes that pivot support 1 holds retracement in a bull trend. This level stands around 1535 – right at previous lows on monthly chart in yellow rectangle.
But before this level we have another one solid support – monthly oversold and trend line – particularly this trend that is used on our COT report divergence analysis, and they are coincide in February. One thing that I want to say here is – gold oversold is quite different from EUR oversold. Gold is commodity market and could show deep penetration of oversold lines as well as hold at oversold for considerable period. Financial markets almost never behave like that.
So, long-term analysis tells that bull trend has not broken, it is still valid, but market probably will show deeper retracement. First target is 1575 of monthly oversold, second is 1536 – yearly pivot and natural support.
Weekly
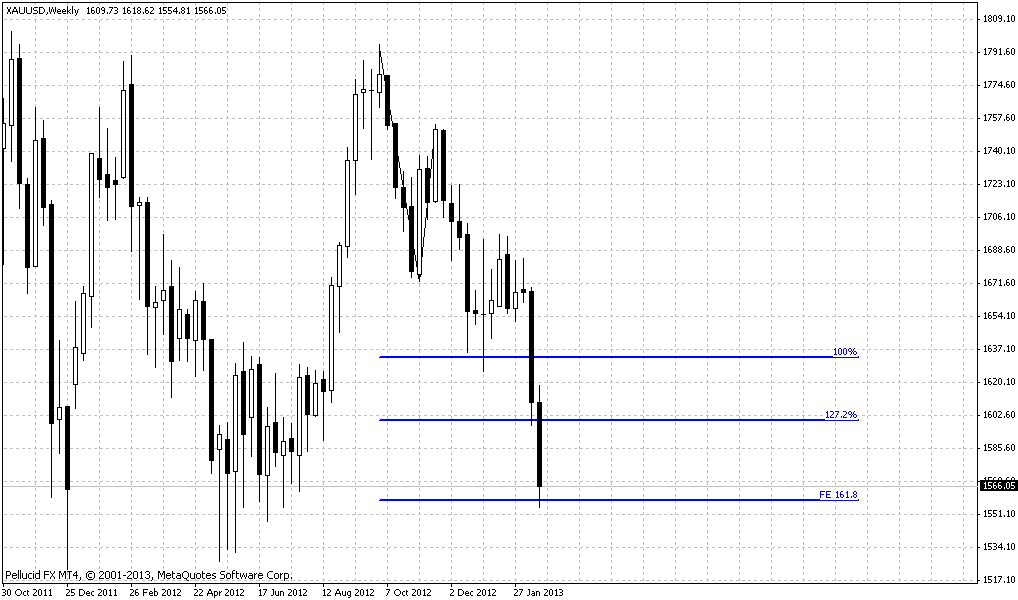
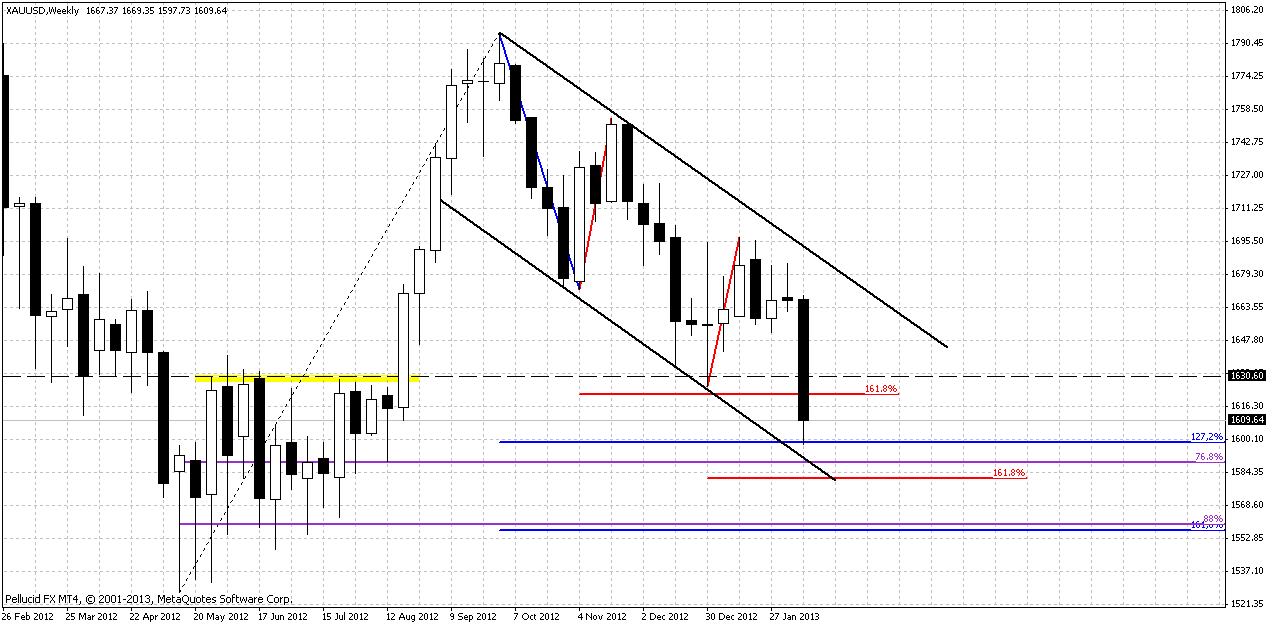
Here trend holds bearish, we’re not at oversold and have no divergence – so, that I keep MACD out of the chart. There are two major points here – market has passed through previous low of the year at 1625 and second – market has returned right back in previous consolidation that was rather significant previously and gold has started upward trend right after breakout of it.
Market has reached support area as well – hit 1.27 extension of our AB-CD pattern and stands now near 0.768 Fib support. So, we clearly see that market is bearish, but when it will show retracement – now, or will move a bit lower? I can’t prove it since we have no confirmation from the market, but I dare to suggest that market probably will move lower. 1625-1630 area was a significant support, including major 0.618 support level, but market has passed through it like hot knife through the butter. Current support likes as minor one. If we will measure all previous downswings, as well as retracements – they point on 1570-1575 area. That’s the area where current 1.618 extension of previous retracement stands. Next target will be 1550 – 1.618 extension of AB-CD pattern, and I suspect that somewhere between 1575 and 1550 price will turn to more or less feasible retracement up. Other words, I expect another week down, but not as tremendous as previous one.
Daily
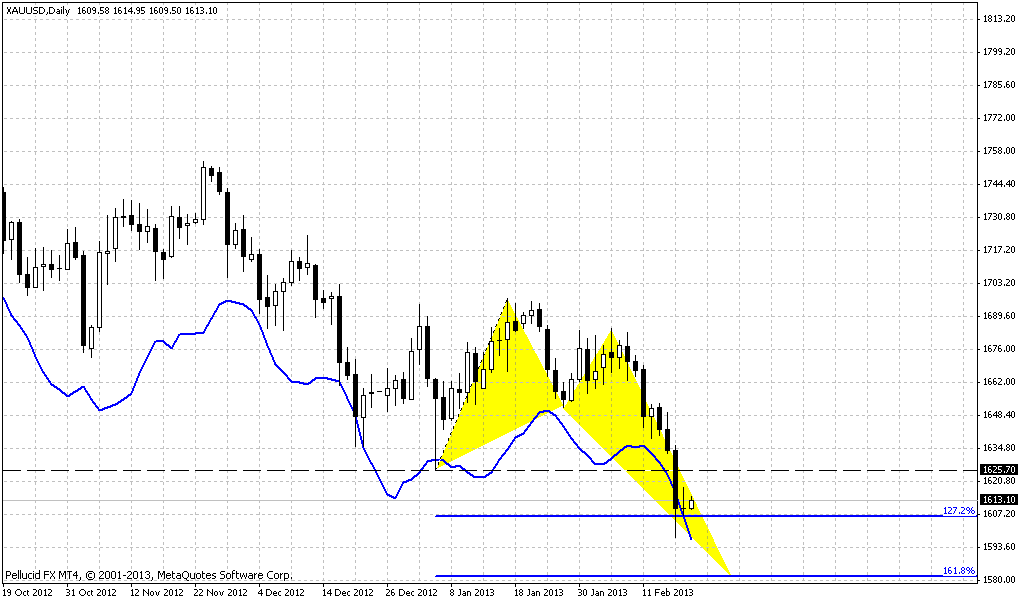
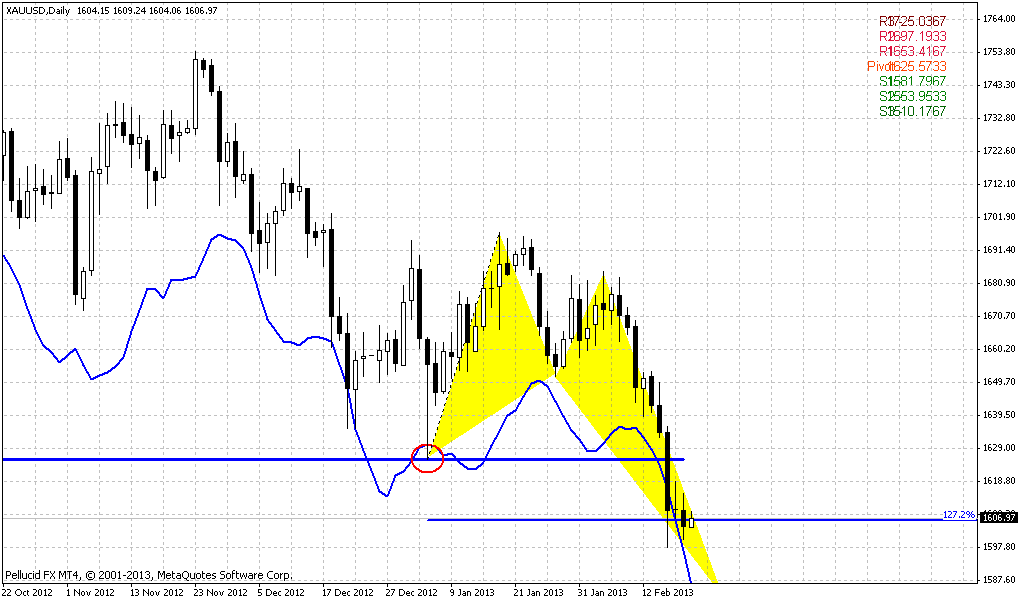
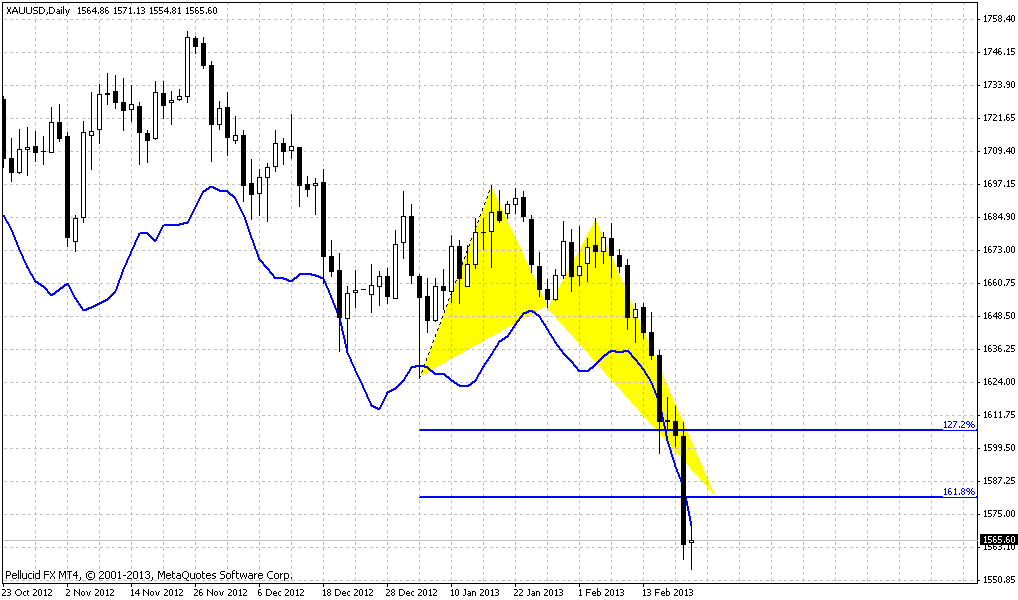
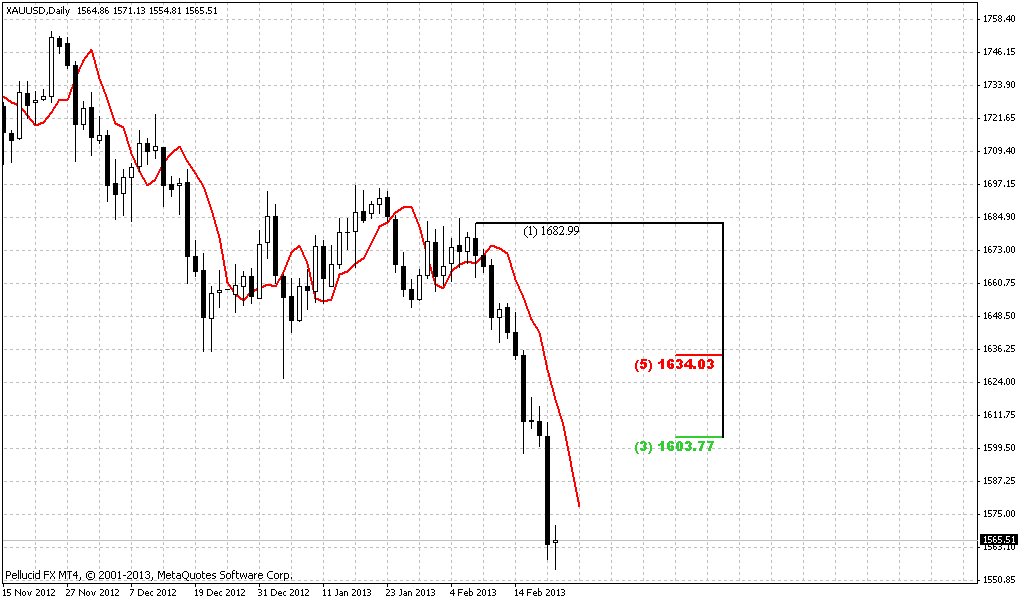
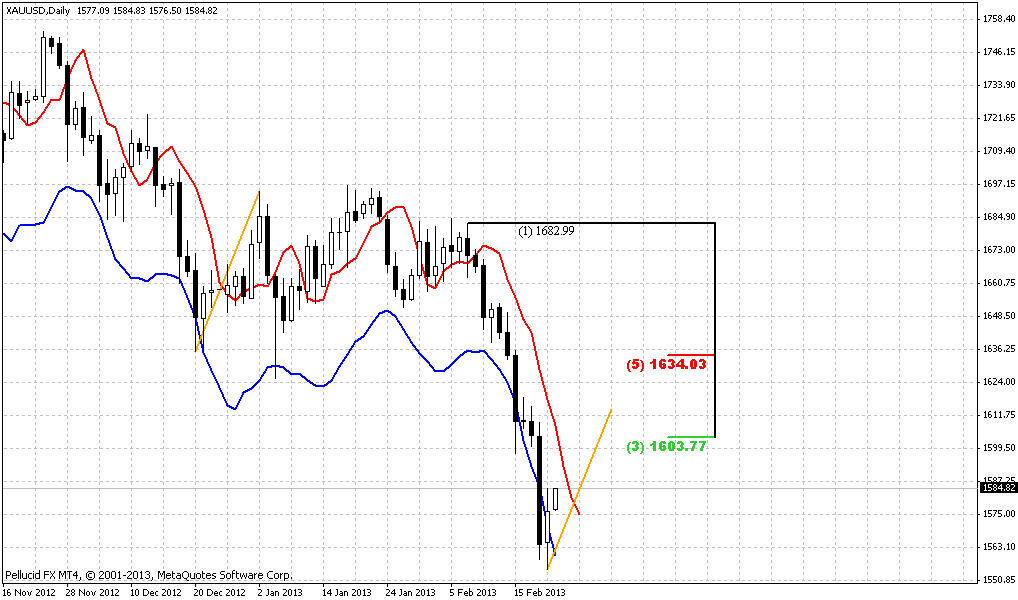
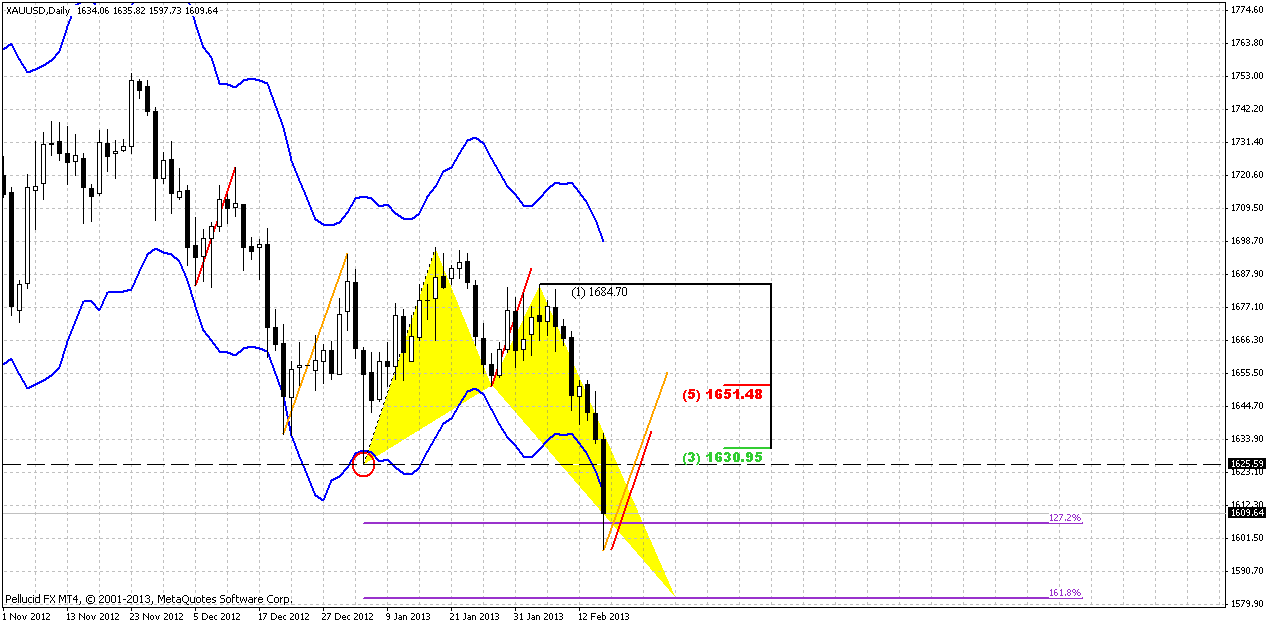
Trend is bearish here, but market at oversold at 1.27 extension point of butterfly. Some retracement up could follow, the question is again – what retracement? Based on harmonic swings it could be either to 50% or slightly higher than 0.618. We do not have patterns here to say definitely. Thus one of our tasks for Monday will be to monitor price action on intraday charts and try to catch any pattern that could clarify this moment. Because as deep retracement as shallow one has foundation. Deep retracement could happen, because gold likes to do 0.618 retracements, and market at oversold, while shallow retracement could happen, because gold rare makes deep retracement when trend accelerates – take a look at previous move down and second, if market fails around 1.27 target of butterfly and intends continue move down – it rare makes deep retracement.
I expect that market will proceed to 1.618 target of butterfly, mostly because of long black candle right at 1.27 target – this usually lead to further continuation. So, retracement will probably happen and we need to search possibility to short entry, but will be better if we will get some pattern on our back and will not enter just from Fib level.
4-hour
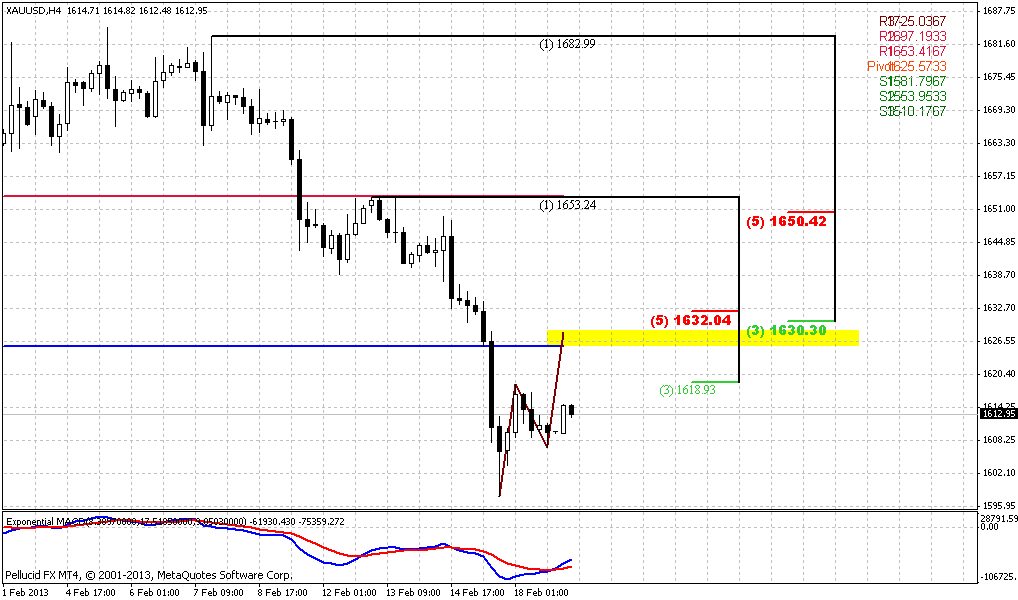
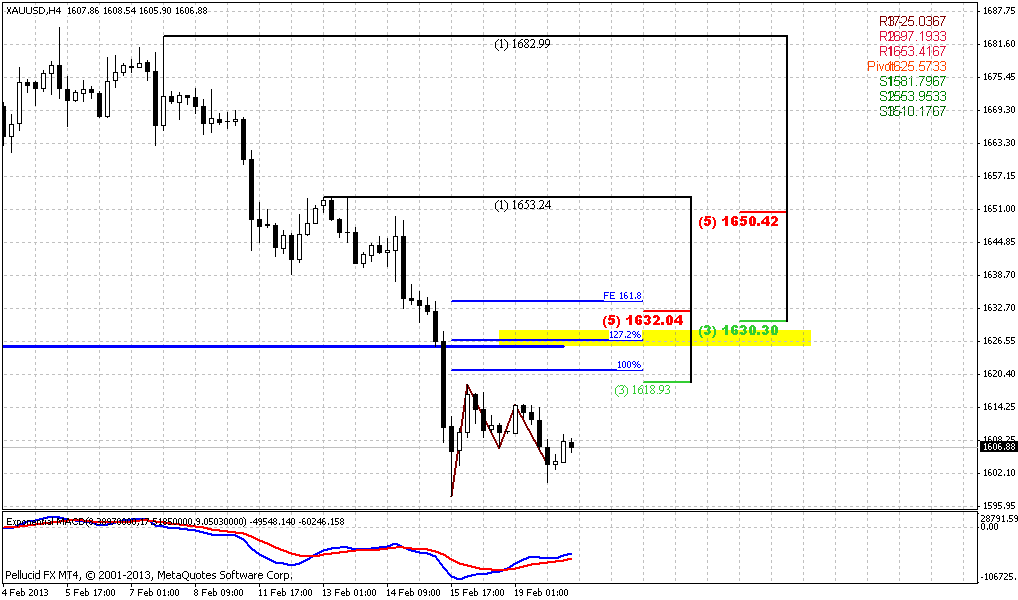
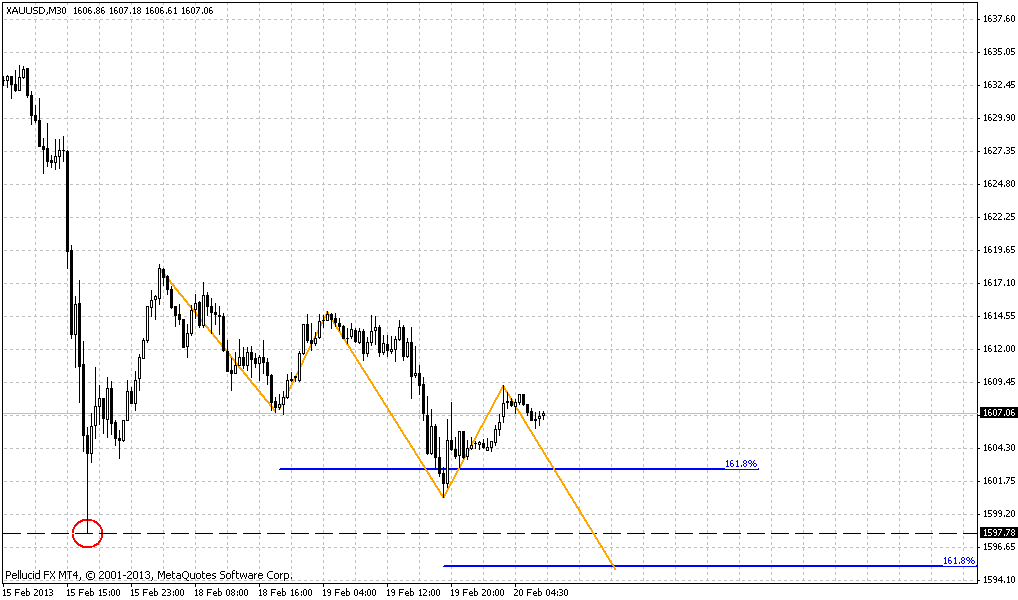
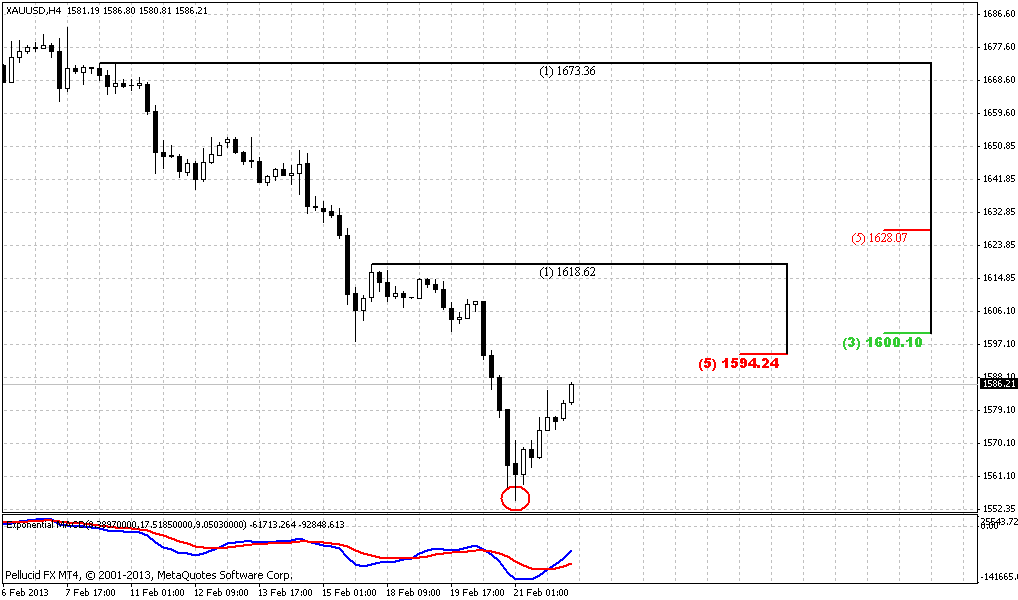
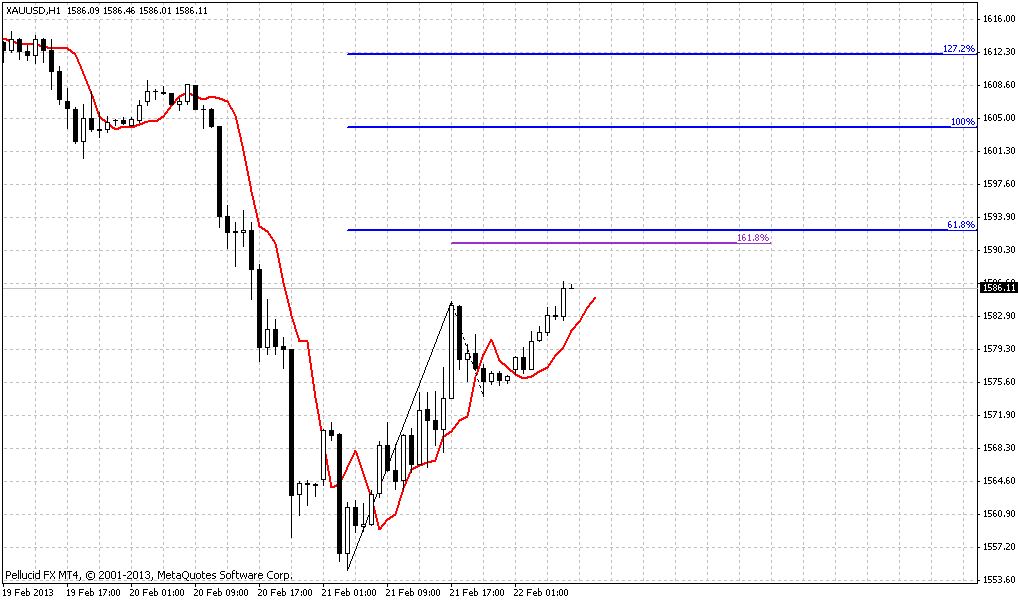
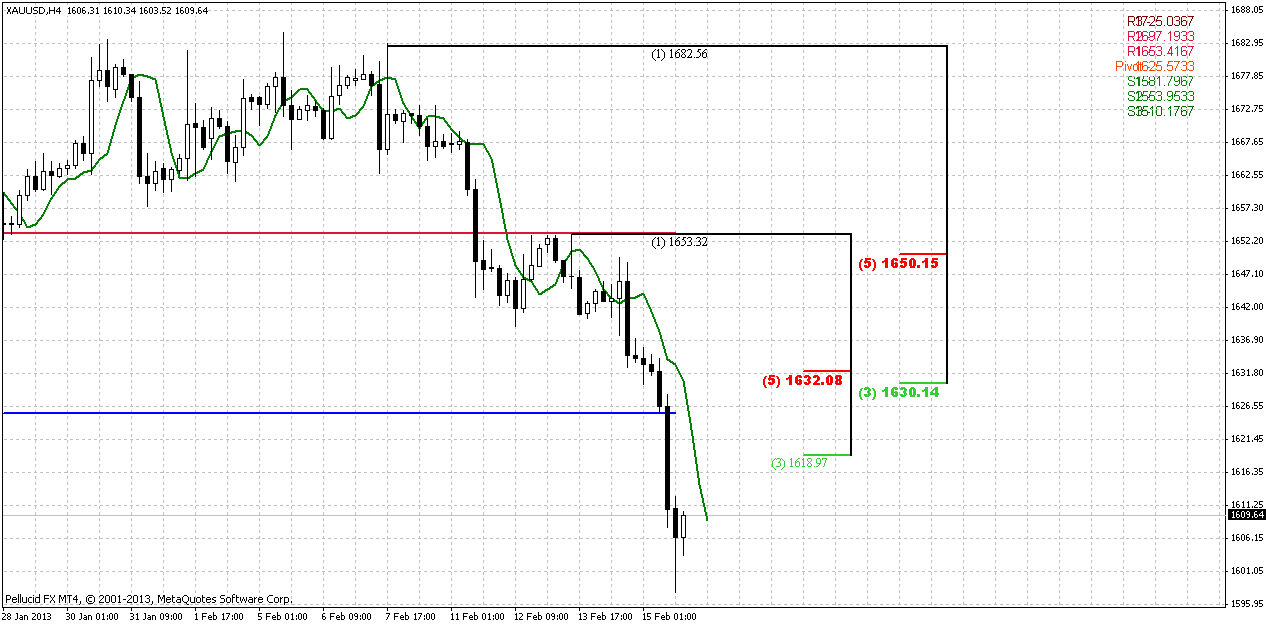
Here we probably could get a context for DiNapoli directional pattern that could trigger retracement up. I prefer to get B&B “Sell” from WPP area. Anyway, first level to watch for is 1630-1632 K-resistance, that is also WPP and previous low. If market will break through it – next is 1650 Fib resistance and WPR1.
Conclusion:
Market has failed to show strong bullish scenario with holding above yearly pivot and re-establish move up. This leads to some structural changes in bears’ favor in short-term perspective. In long-term still, bullish trend still holds – as technically as fundamentally and current move down just means that market shows plan “B” – retracement to yearly pivot support 1. Until market will not break this area we could treat this move down as retracement.
In short term perspective gold probably will continue move lower to 1575-1580 target. Thus we need to use rally to sell into. Possible levels to watch for on coming week are 1530 and 1550.
The technical portion of Sive's analysis owes a great deal to Joe DiNapoli's methods, and uses a number of Joe's proprietary indicators. Please note that Sive's analysis is his own view of the market and is not endorsed by Joe DiNapoli or any related companies.
Let’s start our discussion from most recent COT report. As gold turns south – reaction in sentiment be not long in coming. Although long position of speculators remains at at the same level and has shown just small decreasing, short positions have increased significantly and, as a result, net long positions has decreased. Total open interest also has increased, and shows jump in short positions. Still, let’s avoid to dramatize the situation yet. COT report indeed shows increasing interest to short positions and shows increasing of shorts positions per se.

Currently we probably should stand somewhere near this point. Most recent downward swing of Gold price has not broken the trend line yet (as you will see on monthly chart), that stands for February at ~1570, so this upward trend still holds. At the same time speculative positions are near the low, but the still have room to decrease for another 5-10K. The thing that I want to say is - it’s not done yet with upward trend in long-term perspective, even based on sentiment analysis. This divergence can’t last forever, it should be resolved – either gold market has to drop significantly, or upward continuation should follow.

Analysis of SPDR Fund holdings shows small decrease in physical gold and situation has not changed drastically yet, compares to previous week.

Finally, before we will pass to technical issues, I want to attract your attention to the event that has passed almost invisibly in mass-media. I’m speaking about Germany intention to repatriate all physical gold, that now holds in foreign countries, and US stands among of them:
The following table shows the current and the envisaged future allocation of Germany's gold reserves across the various storage locations:
31 December 2012 31 December 2020
Frankfurt am Main 31 % 50 %
New York 45 % 37 %
London 13 % 13 %
Paris 11 % 0 %
To this end, the Bundesbank is planning a phased relocation of 300 tonnes of gold from New York to Frankfurt as well as an additional 374 tonnes from Paris to Frankfurt by 2020.
Source: Bundesbank January 16, 2013
What else we know? There are some rumors, that Netherlands and Azerbaijan could follow the Germany. Besides, China gradually continue to increase its reserves of Gold and if it will continue they could announce within 1-2 years - “hey, we have 3000 tones (or even 4000 tones) of Gold”. But this is not the point. The point is – “what that repatriation is?” My thought that this even stands among most significant events on gold markets and it is extremely important for long-long term picture. This is, in fact, the clone of Charles De Gaulle act to exchange all US Dollars into Gold in 60’s. (You can read about it in our Forex Military School).
Why this is important? In normal situation no major central bank will call for withdrawal of 300 tones of gold from another major central bank. My thought is that first – Germany would like to audit US and check is it really all gold safe, second – Germany probably sees significant risks of currencies, especially US Dollar and EUR in long-term perspective and tells that “Gold is the currency”. Now, imagine, what will happen if after the Germany other countries will follow?
Another significant moment is – why this procedure should be accomplished to 2020? Is it really so difficult to transfer 300 tones? I suspect that US doesn’t have this gold, not in term that they have lost it, but this gold was put in some turnover. Before this huge upward trend has started, the lending against the gold was very common transaction. Hence, it is possible that gold was put as collateral or lend somehow and US need time to gather it or purchase on open market.
One of the most famous and respectable gold traders Jim Sinclair tells on this event that it could become most significant precedent on Gold market within 50 years. It could put the end to US Dollar as reserve currency and lead gold above previous high to 2111$.
What’s conclusion could be made here? From the fundamental point of view we see some decreasing interest to gold in short-term perspective and we know that gold now stands in seasonal bear trend. Lack of inflationary pressure is also put negative impact on gold prices and in short term perspective 3-6 months gold could show downward action still.
However, in longer term perspective we see warning signs that could stimulate gold purchases and Germany precedent could lead to significant consequences. Second, short-term decreasing has not broken yet positive potential that divergence between gold price and speculators position carries. All these moments allows us to point that it’s too early to speak about global trend changing to bearish. Long-term bullish trend still holds and technical picture will confirm this.
Monthly
Here is on monthly chart we probably can say, that yes, this is plan “B” guys. After a month of flirting around 1665 yearly pivot, when price has tested it with 1625 move and returned right back, market has taken out this low and continue move down. In fundamental part of research we said, that technical picture tells that long-term bullish trend is still valid, and this is indeed so. How bullish trend usually develops from pivot points’ framework? Price either touches pivot and go (our former plan “A”) or it retracement to pivot support 1. Until price stands above Pivot support 1 – we can say that this is a retracement yet. It assumes that pivot support 1 holds retracement in a bull trend. This level stands around 1535 – right at previous lows on monthly chart in yellow rectangle.
But before this level we have another one solid support – monthly oversold and trend line – particularly this trend that is used on our COT report divergence analysis, and they are coincide in February. One thing that I want to say here is – gold oversold is quite different from EUR oversold. Gold is commodity market and could show deep penetration of oversold lines as well as hold at oversold for considerable period. Financial markets almost never behave like that.
So, long-term analysis tells that bull trend has not broken, it is still valid, but market probably will show deeper retracement. First target is 1575 of monthly oversold, second is 1536 – yearly pivot and natural support.

Weekly
Here trend holds bearish, we’re not at oversold and have no divergence – so, that I keep MACD out of the chart. There are two major points here – market has passed through previous low of the year at 1625 and second – market has returned right back in previous consolidation that was rather significant previously and gold has started upward trend right after breakout of it.
Market has reached support area as well – hit 1.27 extension of our AB-CD pattern and stands now near 0.768 Fib support. So, we clearly see that market is bearish, but when it will show retracement – now, or will move a bit lower? I can’t prove it since we have no confirmation from the market, but I dare to suggest that market probably will move lower. 1625-1630 area was a significant support, including major 0.618 support level, but market has passed through it like hot knife through the butter. Current support likes as minor one. If we will measure all previous downswings, as well as retracements – they point on 1570-1575 area. That’s the area where current 1.618 extension of previous retracement stands. Next target will be 1550 – 1.618 extension of AB-CD pattern, and I suspect that somewhere between 1575 and 1550 price will turn to more or less feasible retracement up. Other words, I expect another week down, but not as tremendous as previous one.

Daily
Trend is bearish here, but market at oversold at 1.27 extension point of butterfly. Some retracement up could follow, the question is again – what retracement? Based on harmonic swings it could be either to 50% or slightly higher than 0.618. We do not have patterns here to say definitely. Thus one of our tasks for Monday will be to monitor price action on intraday charts and try to catch any pattern that could clarify this moment. Because as deep retracement as shallow one has foundation. Deep retracement could happen, because gold likes to do 0.618 retracements, and market at oversold, while shallow retracement could happen, because gold rare makes deep retracement when trend accelerates – take a look at previous move down and second, if market fails around 1.27 target of butterfly and intends continue move down – it rare makes deep retracement.
I expect that market will proceed to 1.618 target of butterfly, mostly because of long black candle right at 1.27 target – this usually lead to further continuation. So, retracement will probably happen and we need to search possibility to short entry, but will be better if we will get some pattern on our back and will not enter just from Fib level.

4-hour
Here we probably could get a context for DiNapoli directional pattern that could trigger retracement up. I prefer to get B&B “Sell” from WPP area. Anyway, first level to watch for is 1630-1632 K-resistance, that is also WPP and previous low. If market will break through it – next is 1650 Fib resistance and WPR1.

Conclusion:
Market has failed to show strong bullish scenario with holding above yearly pivot and re-establish move up. This leads to some structural changes in bears’ favor in short-term perspective. In long-term still, bullish trend still holds – as technically as fundamentally and current move down just means that market shows plan “B” – retracement to yearly pivot support 1. Until market will not break this area we could treat this move down as retracement.
In short term perspective gold probably will continue move lower to 1575-1580 target. Thus we need to use rally to sell into. Possible levels to watch for on coming week are 1530 and 1550.
The technical portion of Sive's analysis owes a great deal to Joe DiNapoli's methods, and uses a number of Joe's proprietary indicators. Please note that Sive's analysis is his own view of the market and is not endorsed by Joe DiNapoli or any related companies.
Last edited by a moderator:
