Sive Morten
Special Consultant to the FPA
- Messages
- 18,669
Fundamentals
Weekly Gold Trading Report prepared by Sive Morten exclusively for ForexPeaceArmy.com
Gold turned lower in choppy dealings on Friday, flirting with a seven-week low after the euro zone discussed extending the Greek bailout by just four months, while prices headed for their fourth straight weekly drop.
A draft text on extending Greece's bailout from its international creditors proposes prolonging the program by four months rather than a previously suggested six, officials from Greece and other euro zone states said on Friday.
"Overall, gold is lower as the market grows increasingly optimistic about a positive resolution, hence less need for a safe haven investment," said Tai Wong, director of base and precious metals trading for BMO Capital Markets in New York.
The euro traded near session highs against the U.S. dollar after the Greek bailout was drafted.
Traders were set to focus on the U.S. Federal Reserve and its monetary policy for clues on a possible interest rates hike by June, despite caution evident in the minutes from the latest Fed policy meeting.
Any hike by the Fed, which has kept rates near zero since 2008 to stimulate the U.S. economy, could hurt demand for non-interest-bearing bullion.
Liquidity was thin in Asia as No.2 consumer China and several other Asian countries were shut for the Lunar New Year holiday.
Gold prices had received some support from Chinese buying ahead of the holiday, when gold is bought for gift giving.
"A lot hinges on the return of China next Wednesday as many participants are expecting them to be on the bid following their New Year festivities," MKS Group said in a note.
"If this fails to be the case, the complex would likely continue its slide lower."
Recent CFTC data shows contraction of positions as in terms of open interest as in terms of net long position. Speculative shorts, oppositely, has grown a bit. Our long-to-total position ratio has dropped to 77-78% and this should be sufficient correction for upside continuation. Other worlds, ratio right now stands at levels that do not prevent market from further upside action.
SPDR fund, despite solid drop on spot market, reports on 3 tonnes inflow to 771 tonnes. Here is important not the value of growth per se, but the fact of growth on dropping market. Mostly this analysis of CFTC and SPDR data does not care something special and leads us again to crucial 1200 level. Although SPDR dynamic hints on retracement nature of recent drop, but at the same time we see significant decrease of net long positions and this could be also a sign of reversal. Thus, this data does not clarify much what should happen.

Here is detailed breakdown of speculative positions:
Open interest:
 Shorts:
 Longs:

Technicals
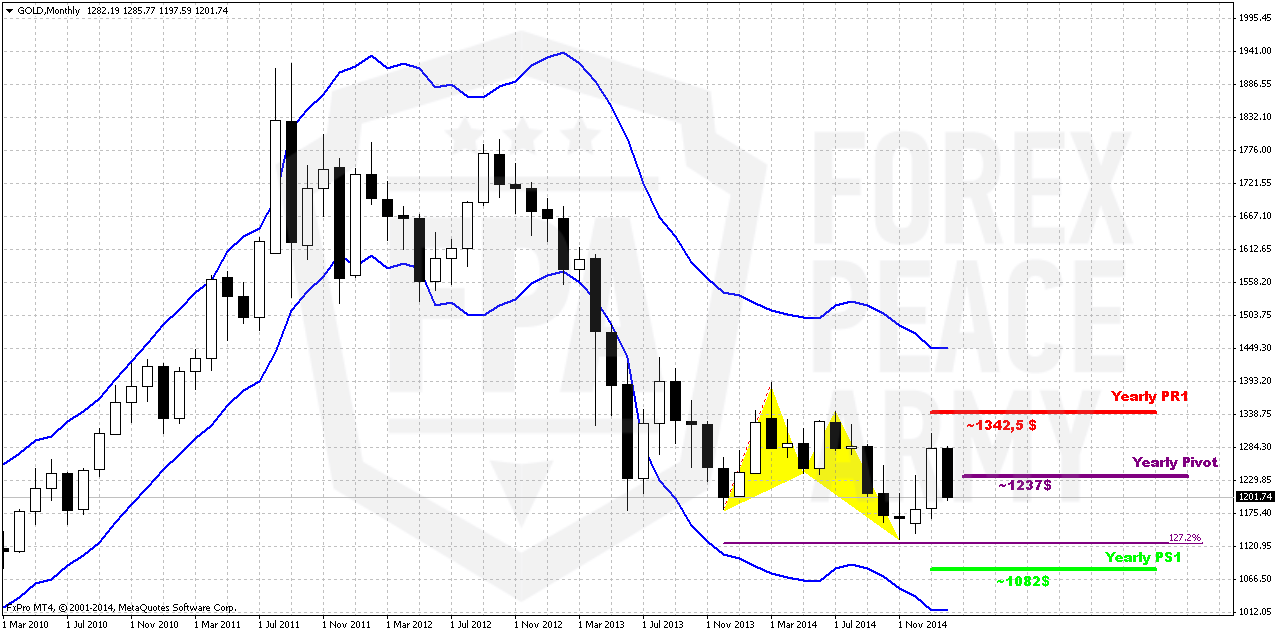
Monthly
So, drop on recent couple of weeks looks significant. Here we still have last big pattern in progress that is Volatility breakout (VOB). It suggests at least 0.618 AB-CD down. And this target is 1050$.
Since the beginning of the year market shows solid upside action. Market was able to exceed yearly pivot, passed half way to Yearly Pivot resistance 1 but right now has turned to retracement and right now has closed below YPP. From technical point of view this is bearish sign. This could be very significant moment and next logical destination will be yearly pivot support 1 around 1083$.
At the same time the major driving factor for Gold is inflation. Previous data has shown anemic pace of it or even decreasing. But last NFP data has value not just because of increasing of employment but increasing of cost of labor. Data has shown 12 cent growth and this is approximately 2,2% of annual inflation Currently this numbers have negative effect on gold, since they simultaneously increase chance of rate hike, but when rate will be increased and inflation will show gradual upside pace – this will be supportive factor for gold. Especially if this will be accompanied by reversal on crude oil. But this is future talks and currently we do not see reasons yet to cancel our 1050$ target or at least possible big AB-CD down.
Shortly speaking gold now will fluctuate in difficult period. If coming data will be gradual and supportive for rate hike – NFP will continue show upside trend, inflation will grow, GDP will keep high pace – gold will remain under pressure till first rate hike. After that inflation will be supportive factor for gold.
If data will be mixed as it was recently – then it could lead to local strength on gold market.
Still, if we will take into consideration geopolitical situation and risks that have appeared recently, it could happen that situation will change, especially if situation in Ukraine will escalate and peaceful regulation will fail.
That’s being said, economical data supports further gold decreasing but geopolicy could bring significant adjustment. But unfortunately the geopolicy is sphere where we can’t do much. Right now our major attention will stand on 1200 level that could become a clue to medium-term perspective of gold market.
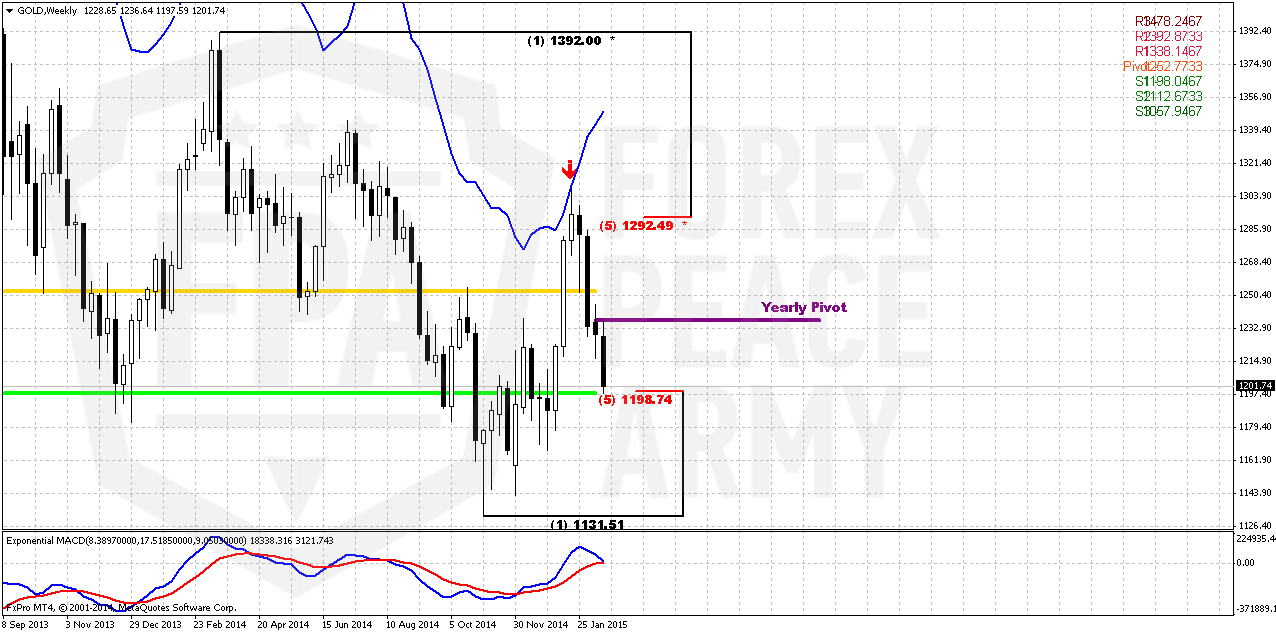
Weekly
Trend here still holds bullish and market has come rather close to MACDP line. Thus, on coming week we will be watching also for bullish grabbers on weekly chart. DiNapoli bearish “Stretch” pattern has worked nice and market has reached it’s target – middle point between overbought and oversold bands.
Recent drop looks a bit scaring, but drastical breakout has not happened yet. We even could say that most important event that has happened recently is downward breakout of YPP.
As previously we think that 1200 area has major importance. Gold likes to show deep retracements and now it comes down from overbought. 1200 is MPS1 and 5/8 Fib support. Until pivot support holds retracement – previous trend is valid and MACD confirms this by far. Also do not forget about former big ratio of CFTC data that was supportive for retracement down. Conclusion here is as follows – bulls has lost nothing yet, at least until market stands above 1200. Breaking through 1200 will suggest changing in weekly trend. Now we are coming to culmination that will clarify trend direction for gold.
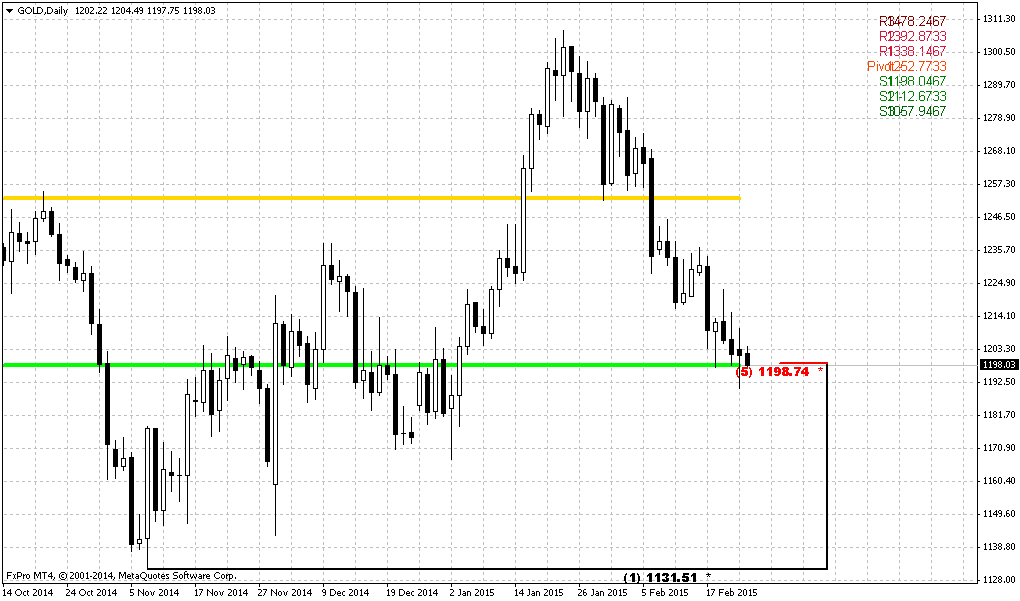
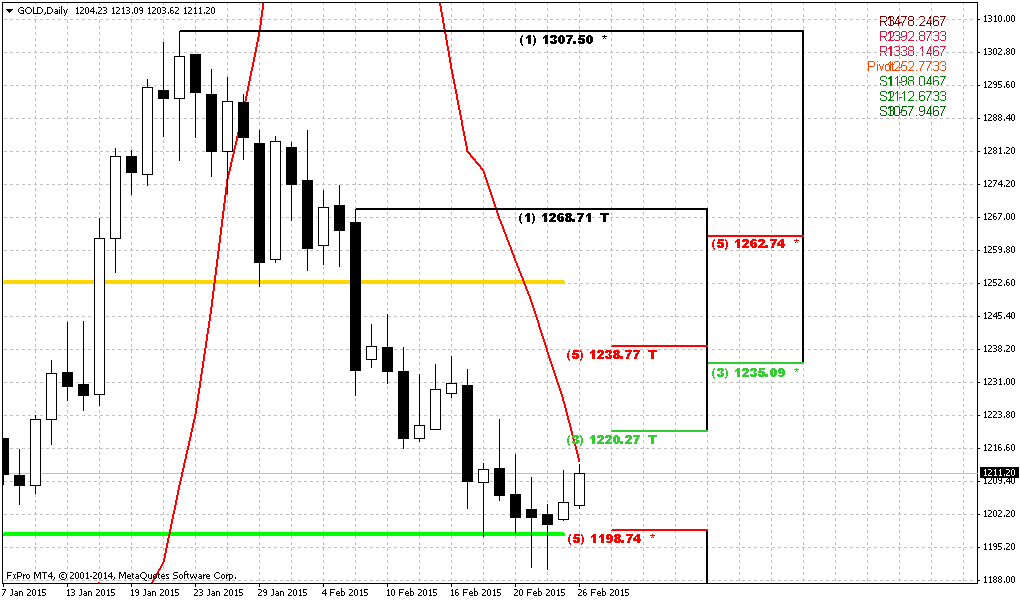
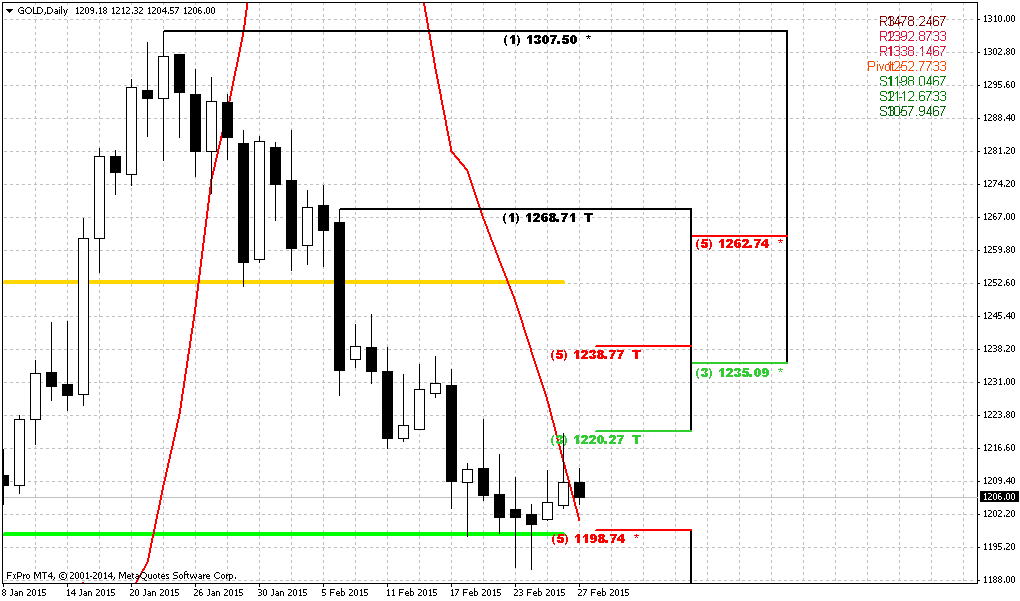
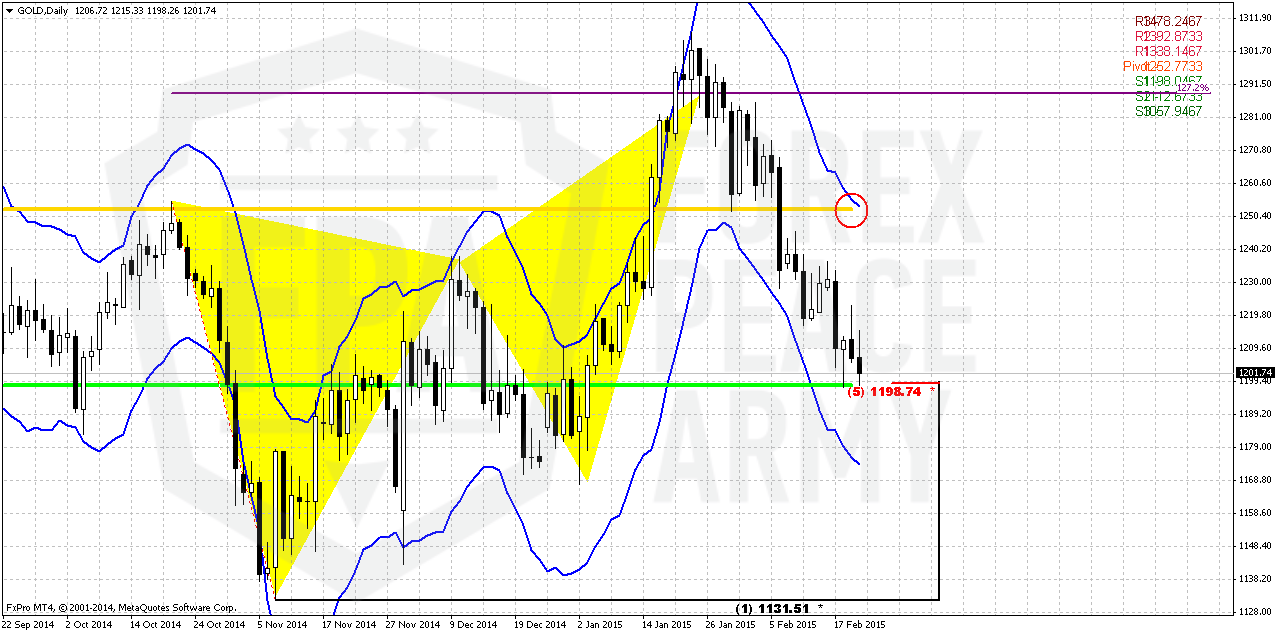
Daily
Daily chart does not provide us anything really special. Market just has completed our former analysis and has reached 1200 support level. Trend holds bearish here. Our tactical trading plan is based on possible bounce up as respect of 1200 strong support. If this really will happen market could reach as far as 1250 level, since gold likes to show 5/8 retracements and re-test former extreme points. This also will be overbought and MPP. Thus, in short-term perspective we continue to watch for reversal patterns here that could let us to take scalp long position with minimum risk.
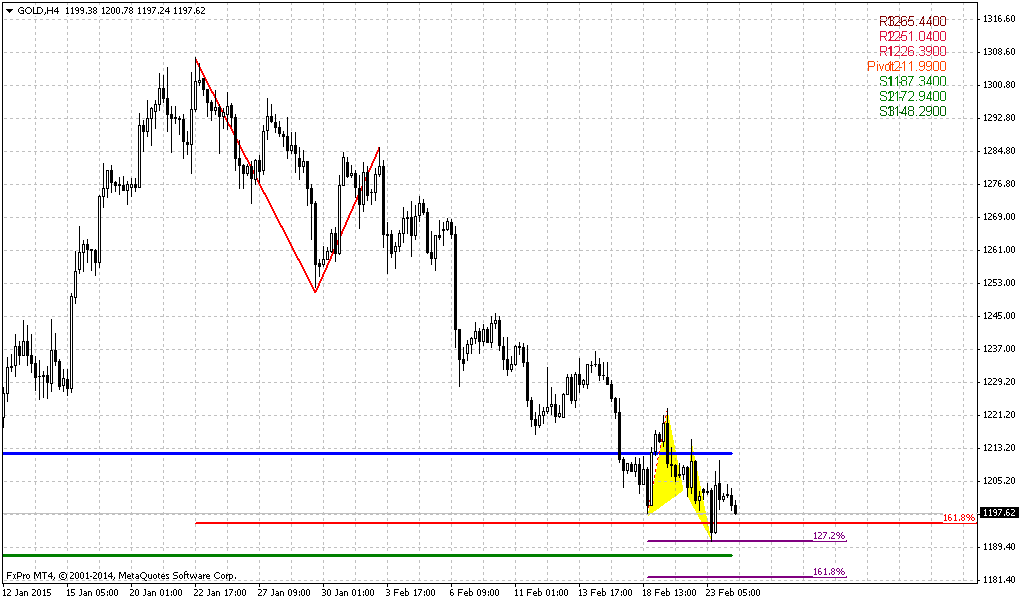
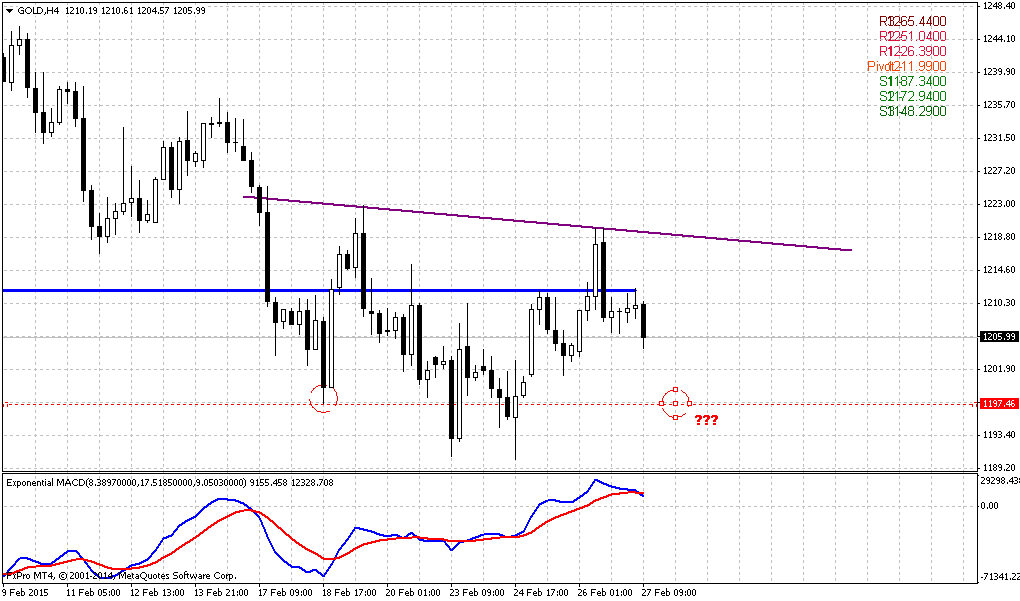
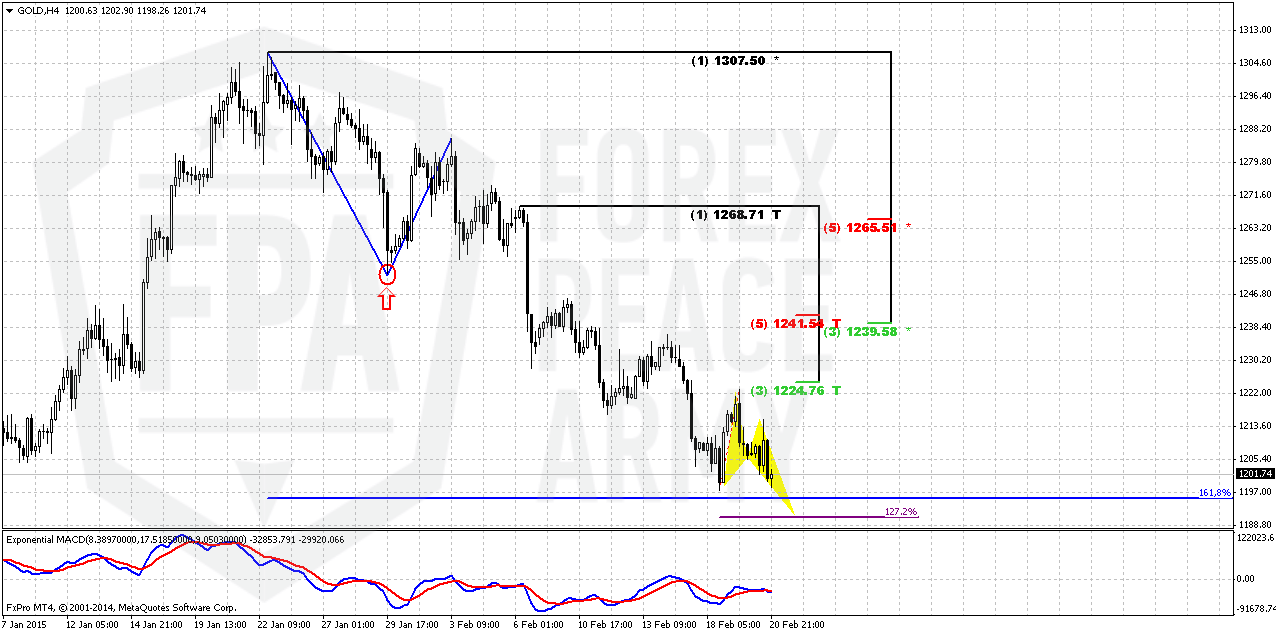
4-hour
Here finally, we have pattern that may be trigger upside reaction on strong support area. This is butterfly “buy” pattern. Probably it should be 1.27 pattern since this will be enough to reach 1.618 AB-CD major target.
Conclusion:
From technical point of view we have no reasons yet to abandon possible long-term downward AB-CD as VoB (Volatility breakout) development. Fundamental background is not very supportive for gold right now and one cluster of events that could bring unexpected bullish surprise is geopolitical tensions.
In short-term perspective trend will depend on 1200 level. If market will hold above it – upside trend will be valid and gold could turn to 1340 next target, while failure around 1200 will bring market to former 1130 lows first.
The technical portion of Sive's analysis owes a great deal to Joe DiNapoli's methods, and uses a number of Joe's proprietary indicators. Please note that Sive's analysis is his own view of the market and is not endorsed by Joe DiNapoli or any related companies.
Weekly Gold Trading Report prepared by Sive Morten exclusively for ForexPeaceArmy.com
Gold turned lower in choppy dealings on Friday, flirting with a seven-week low after the euro zone discussed extending the Greek bailout by just four months, while prices headed for their fourth straight weekly drop.
A draft text on extending Greece's bailout from its international creditors proposes prolonging the program by four months rather than a previously suggested six, officials from Greece and other euro zone states said on Friday.
"Overall, gold is lower as the market grows increasingly optimistic about a positive resolution, hence less need for a safe haven investment," said Tai Wong, director of base and precious metals trading for BMO Capital Markets in New York.
The euro traded near session highs against the U.S. dollar after the Greek bailout was drafted.
Traders were set to focus on the U.S. Federal Reserve and its monetary policy for clues on a possible interest rates hike by June, despite caution evident in the minutes from the latest Fed policy meeting.
Any hike by the Fed, which has kept rates near zero since 2008 to stimulate the U.S. economy, could hurt demand for non-interest-bearing bullion.
Liquidity was thin in Asia as No.2 consumer China and several other Asian countries were shut for the Lunar New Year holiday.
Gold prices had received some support from Chinese buying ahead of the holiday, when gold is bought for gift giving.
"A lot hinges on the return of China next Wednesday as many participants are expecting them to be on the bid following their New Year festivities," MKS Group said in a note.
"If this fails to be the case, the complex would likely continue its slide lower."
Recent CFTC data shows contraction of positions as in terms of open interest as in terms of net long position. Speculative shorts, oppositely, has grown a bit. Our long-to-total position ratio has dropped to 77-78% and this should be sufficient correction for upside continuation. Other worlds, ratio right now stands at levels that do not prevent market from further upside action.
SPDR fund, despite solid drop on spot market, reports on 3 tonnes inflow to 771 tonnes. Here is important not the value of growth per se, but the fact of growth on dropping market. Mostly this analysis of CFTC and SPDR data does not care something special and leads us again to crucial 1200 level. Although SPDR dynamic hints on retracement nature of recent drop, but at the same time we see significant decrease of net long positions and this could be also a sign of reversal. Thus, this data does not clarify much what should happen.
Here is detailed breakdown of speculative positions:
Open interest:
Technicals
Monthly
So, drop on recent couple of weeks looks significant. Here we still have last big pattern in progress that is Volatility breakout (VOB). It suggests at least 0.618 AB-CD down. And this target is 1050$.
Since the beginning of the year market shows solid upside action. Market was able to exceed yearly pivot, passed half way to Yearly Pivot resistance 1 but right now has turned to retracement and right now has closed below YPP. From technical point of view this is bearish sign. This could be very significant moment and next logical destination will be yearly pivot support 1 around 1083$.
At the same time the major driving factor for Gold is inflation. Previous data has shown anemic pace of it or even decreasing. But last NFP data has value not just because of increasing of employment but increasing of cost of labor. Data has shown 12 cent growth and this is approximately 2,2% of annual inflation Currently this numbers have negative effect on gold, since they simultaneously increase chance of rate hike, but when rate will be increased and inflation will show gradual upside pace – this will be supportive factor for gold. Especially if this will be accompanied by reversal on crude oil. But this is future talks and currently we do not see reasons yet to cancel our 1050$ target or at least possible big AB-CD down.
Shortly speaking gold now will fluctuate in difficult period. If coming data will be gradual and supportive for rate hike – NFP will continue show upside trend, inflation will grow, GDP will keep high pace – gold will remain under pressure till first rate hike. After that inflation will be supportive factor for gold.
If data will be mixed as it was recently – then it could lead to local strength on gold market.
Still, if we will take into consideration geopolitical situation and risks that have appeared recently, it could happen that situation will change, especially if situation in Ukraine will escalate and peaceful regulation will fail.
That’s being said, economical data supports further gold decreasing but geopolicy could bring significant adjustment. But unfortunately the geopolicy is sphere where we can’t do much. Right now our major attention will stand on 1200 level that could become a clue to medium-term perspective of gold market.
Weekly
Trend here still holds bullish and market has come rather close to MACDP line. Thus, on coming week we will be watching also for bullish grabbers on weekly chart. DiNapoli bearish “Stretch” pattern has worked nice and market has reached it’s target – middle point between overbought and oversold bands.
Recent drop looks a bit scaring, but drastical breakout has not happened yet. We even could say that most important event that has happened recently is downward breakout of YPP.
As previously we think that 1200 area has major importance. Gold likes to show deep retracements and now it comes down from overbought. 1200 is MPS1 and 5/8 Fib support. Until pivot support holds retracement – previous trend is valid and MACD confirms this by far. Also do not forget about former big ratio of CFTC data that was supportive for retracement down. Conclusion here is as follows – bulls has lost nothing yet, at least until market stands above 1200. Breaking through 1200 will suggest changing in weekly trend. Now we are coming to culmination that will clarify trend direction for gold.
Daily
Daily chart does not provide us anything really special. Market just has completed our former analysis and has reached 1200 support level. Trend holds bearish here. Our tactical trading plan is based on possible bounce up as respect of 1200 strong support. If this really will happen market could reach as far as 1250 level, since gold likes to show 5/8 retracements and re-test former extreme points. This also will be overbought and MPP. Thus, in short-term perspective we continue to watch for reversal patterns here that could let us to take scalp long position with minimum risk.
4-hour
Here finally, we have pattern that may be trigger upside reaction on strong support area. This is butterfly “buy” pattern. Probably it should be 1.27 pattern since this will be enough to reach 1.618 AB-CD major target.
Conclusion:
From technical point of view we have no reasons yet to abandon possible long-term downward AB-CD as VoB (Volatility breakout) development. Fundamental background is not very supportive for gold right now and one cluster of events that could bring unexpected bullish surprise is geopolitical tensions.
In short-term perspective trend will depend on 1200 level. If market will hold above it – upside trend will be valid and gold could turn to 1340 next target, while failure around 1200 will bring market to former 1130 lows first.
The technical portion of Sive's analysis owes a great deal to Joe DiNapoli's methods, and uses a number of Joe's proprietary indicators. Please note that Sive's analysis is his own view of the market and is not endorsed by Joe DiNapoli or any related companies.