Sive Morten
Special Consultant to the FPA
- Messages
- 18,699
Fundamentals
Gold rose to a three-month high above $1,300 an ounce on Friday, gaining 1 percent and notching its biggest weekly gain in six months, as weak U.S. manufacturing output pressured the dollar and lifted bullion's currency-hedge appeal. A technical break-out above tough resistance at its 200-day moving average, and signs of recovering investment demand in gold exchange-traded funds, also triggered gold buying, traders said. Bullion reversed its recent strong inverse link with equities, which had been pressured by economic uncertainties and emerging-market jitters.
On Friday, U.S. equities, measured by the S&P 500 index, rose 0.5 percent as investors were willing to add riskier investments by overlooking some soft economic data stemming from bad weather.
"Risk-on is typically deemed bad for precious metals prices, but the downdraft for the dollar and the steady-as-she-goes Fed policy threatening slow retreat from an ultra-easy stance, is boosting demand for gold," said Andrew Wilkinson, chief market analyst at Interactive Brokers LLC. Spot gold was up 1.2 percent at $1,317.90 an ounce by 2:06 p.m. EST (1906 GMT), after rising to its highest since Nov. 7 at $1,320.90. It was up around 4 percent for the week, the largest such gain since mid-August. The technical picture has improved over the past few sessions and a move above its 200-day moving average, last seen in August 2012, analysts said. Gold has gained nearly 9 percent since the beginning of the year, after a 28 percent drop in 2013, on doubts over the U.S. economic recovery and as emerging-market turmoil weighed on some equity markets.
Analysts remain cautious over the medium-term outlook for gold, however. Many expect the U.S. economy to recover and the dollar to rally, making the investment case for gold, usually seen as a safe haven in times of trouble, still unattractive. Investor sentiment seems to have improved, with SPDR Gold Trust, the world's largest gold-backed exchange-traded fund, posting its biggest inflow since late December, up 7.5 tonnes to 806.35 tonnes on Thursday.
Recall that we’ve pointed on previous week that CFTC data has showed very interesting picture. We saw significant increasing in net long position and simultaneous decreasing of open interest. It means that recent upward action was not supported by trading volumes. This makes it fragile. Second interesting fact here is activity on gold market decreases during the recent year. Take a look that since last January – open interest is gradually decreasing right till current moment, despite how net position has changed and it stands at the level of March 2013. As current move up was not supported by volumes, we should be ready either for deep move down or even to downward continuation. Anyway be careful with any long position on daily time frame and higher.
And now we’ve got logical continuation of this suggestion – open interest has jumped significantly with simultaneous decreasing of net long position. It means that more new short positions have come on market. This absolutely does not mean that upward action will not continue or fail. But this could become a sign of possible solid bounce.
Monthly
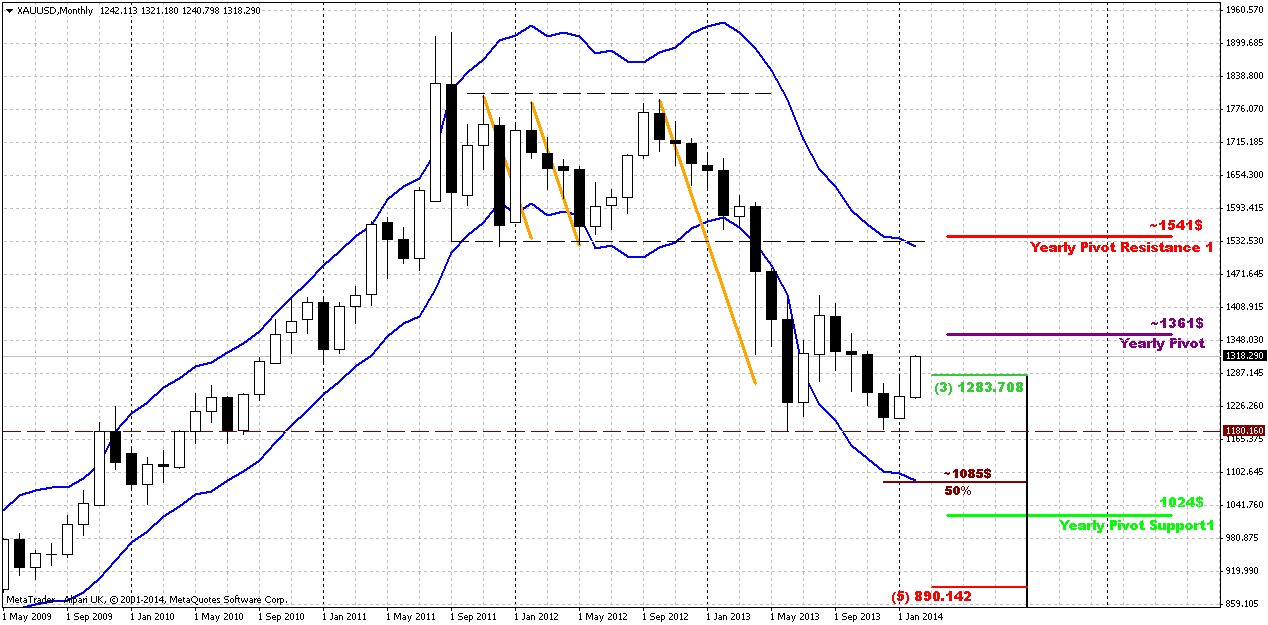
Just on previous week we’ve discussed how it could become important to get clear bullish engulfing pattern here. But right at the last week of January upward candle has diminished twice in size. Market has erased almost 50% of upward January action. As result we’ve got much shyer engulfing pattern that in fact, stands at the edge to be called as “englfing”. Still, as we’ve said that our invalidation point is previous lows – let’s see. Chances on upward action still exist here, especially now, since February action as twice as greater than January. The warning sign is CFTC report of cause, but currently it has not led to any negative conequences. Besides, it could trigger just a retracement, but not neccesary downward continuation on monthly.
Trend holds bearish still. Appearing of 1361 Yearly PP could get special meaning from possible retracement point of view. It could become possible nearest upside target. Yearly PR1 is also very significant. We know that gold likes to re-test previously broken lows and consolidations. 1540 area is monthly overbought, YPR1 and low border of broken long-term rectangle. As market was strongly oversold, why it can’t reach overbought? This is very typical action for any market.
As another application of significantly oversold we’ve suggested retracement up. Thus, we’ve made an assumption of possible deeper upward retracement that could take a shape of AB=CD, and invalidation for this setup is previous lows around 1170s. In fact current move up could be the last chance for possible upward bounce, if, say, market will show something like double bottom. Currently price action is very suitable for that – W&R of first bottom. This action in general is very typical for double bottoms and fake breakout could be the first sign of possible retracement up. Bearish market has no other reasons to stop right here, since there is no support right now – it has passed through 3/8 support, it’s not at oversold. Currently we should keep a close eye on move up.
At the same time fundamental data, still stands very unstable and fickle, seasonal trend and physical demand from time to time also do not quite support upward action, at least right now. May be a bit later situation will change, but market will enter seasonal bearish trend in February and it will be even more difficult to continue move higher. Recent CFTC data also does not encourage optimism, although SPDR reports on inflow. Definitely situation is better than some months ago and something really is changing here, but this optimism is still very unstable. Very probably that market will become a shadow of US macro data in nearest months. Investors right now still are over-reliant on US data and this is understandably. This relation probably will hold for some time still.
Weekly
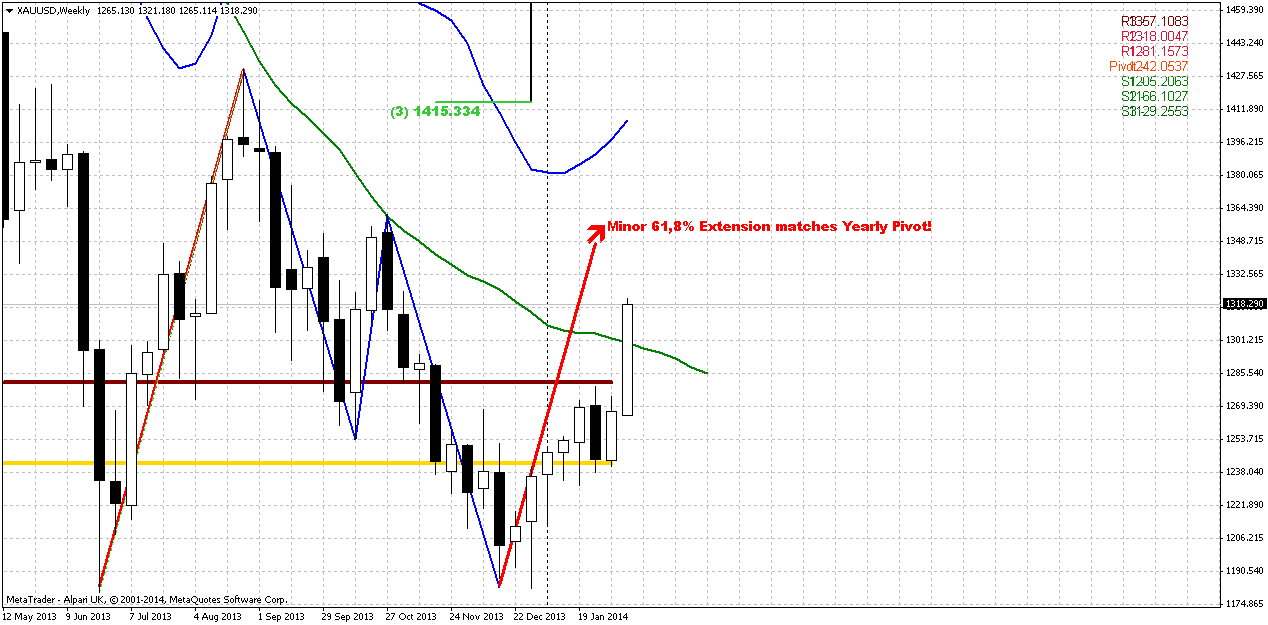
Trend is bullish here, market is not at overbought. Recent week has shown solid bullish action that gives us more confidence with its continuation. First is, market has passed through MPR1 and this is definitely bullish sign suggesting that current upward action is not just upward retracement. Second – market has passed through weekly 25x5 DMA. This also usually happens when trend is changing.
Previously we also have noted that we’ve got solid bullish divergence with MACD. By treating valleys as AB=CD pattern we’ll see that minor extension stands almost right at Yearly Pivot Point, and 1.618 extension stands slightly higher than Yearly PR1. Thus, our next destination here is YPP.
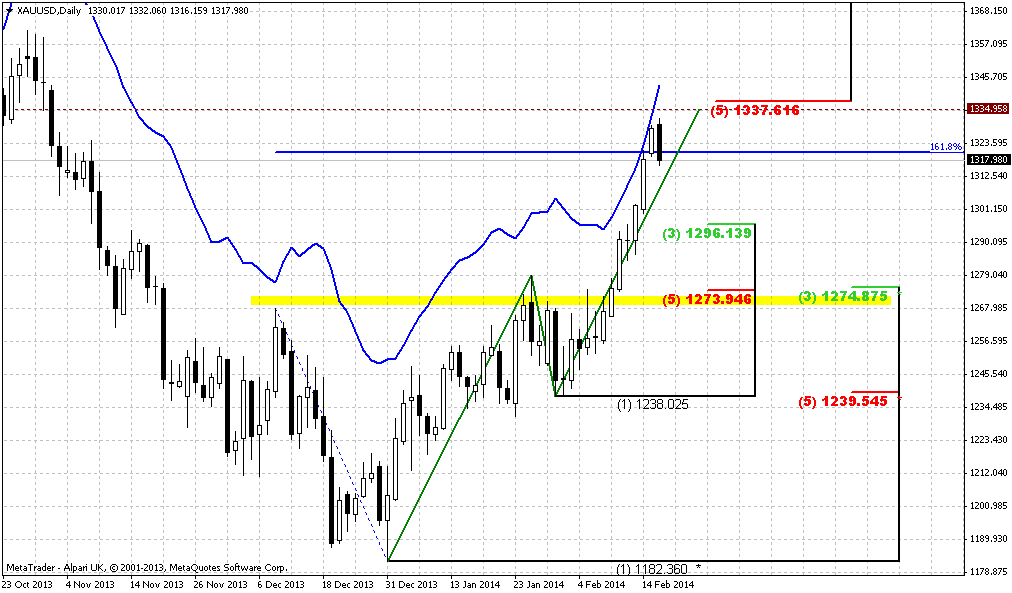
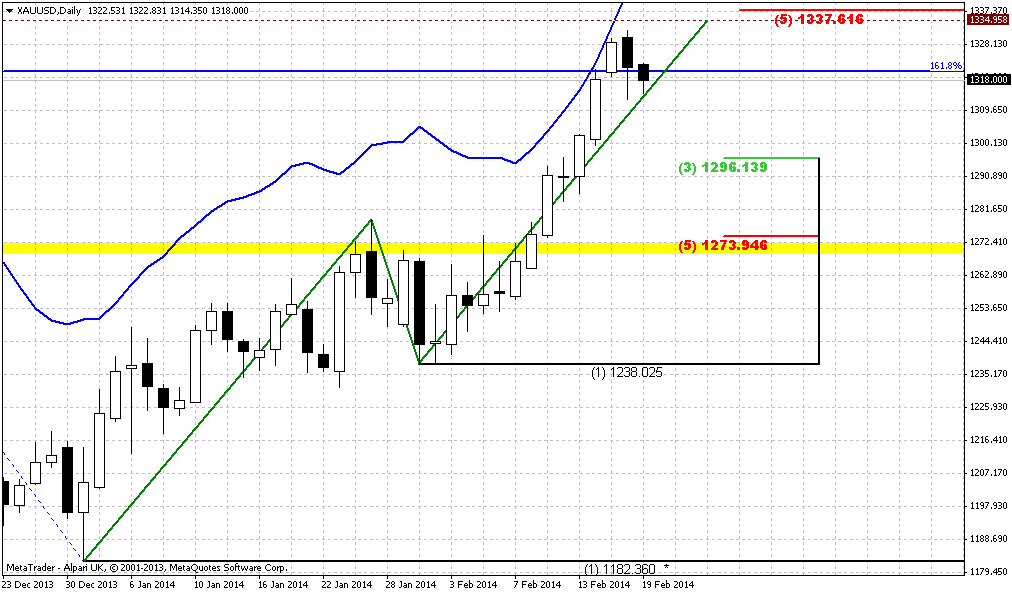
Daily
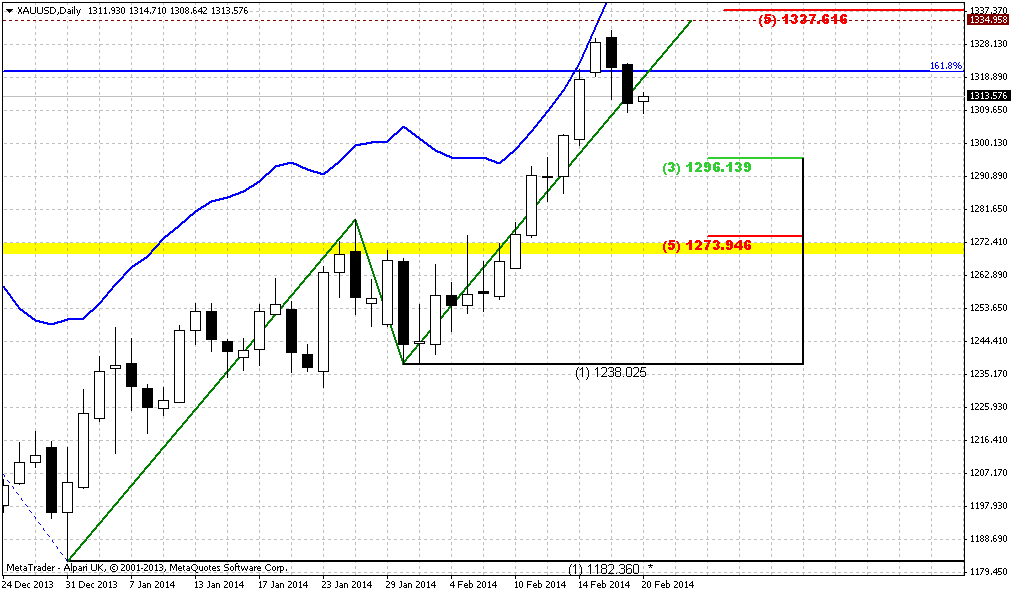
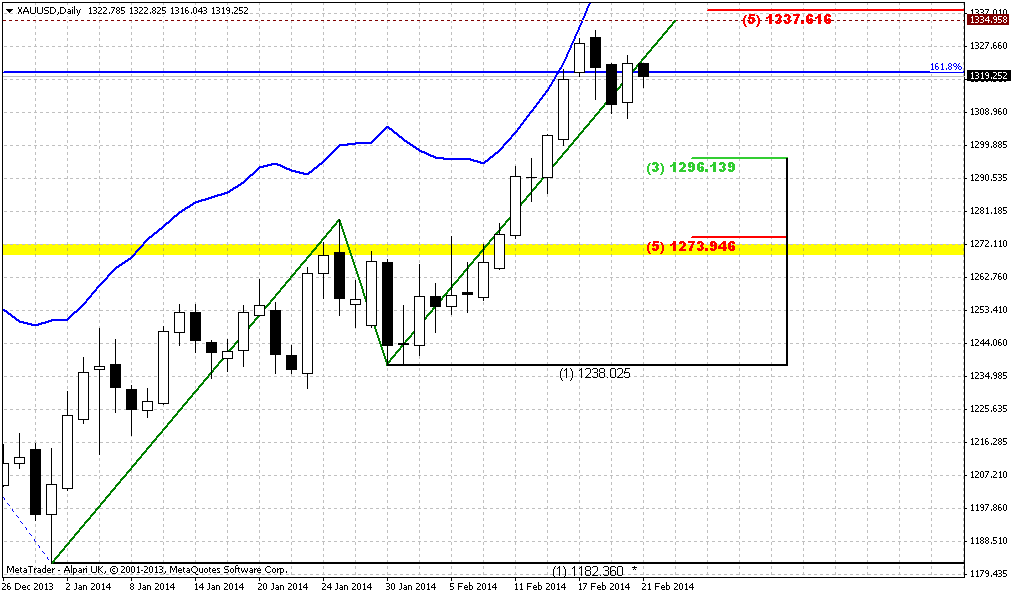
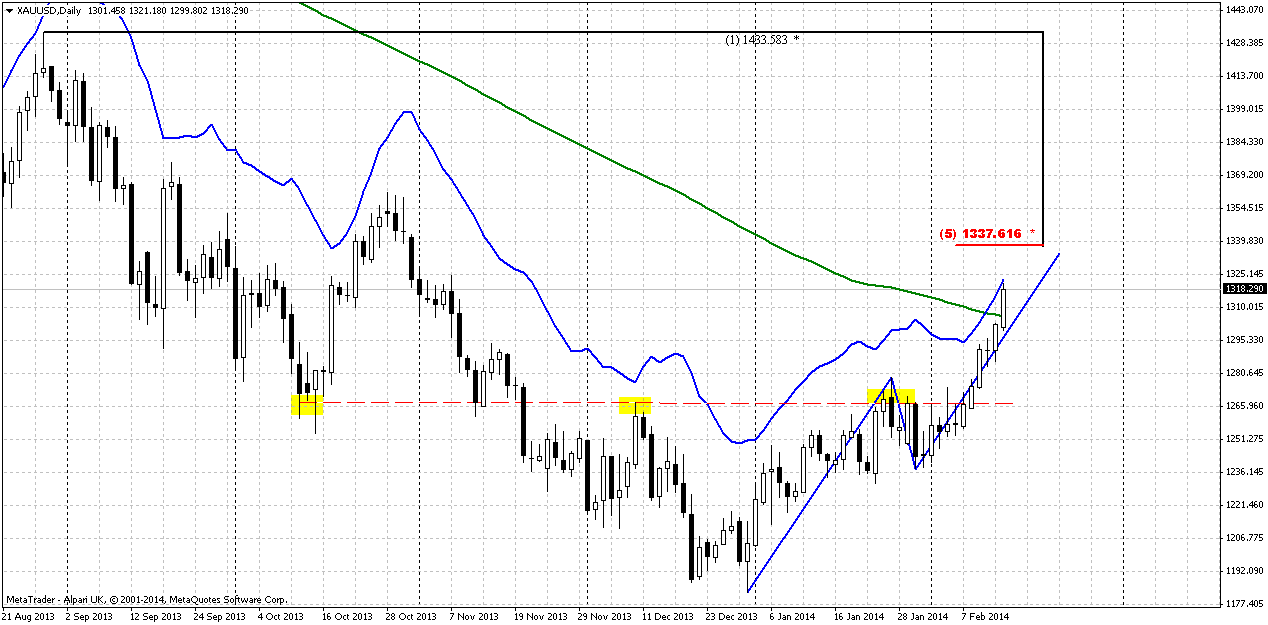
Technically picture reminds daily one of GBP that we also have prepared on current week. Trend is bullish here, action up is strong, but market has hit daily overbought. It is very difficult to say, guys, whether we’ve got here reversed H&S or not – decide by yourself. Hindsight is always twenty-twenty and probably we could find both shoulders here, but it was too skewed for normal H&S and it was really challenge to find this while pattern was standing in progress. Right now we just could use possible target of this move. At least this just the one pattern that we have now – upward AB=CD that creates an Agreement with solid 5/8 Fib resistance around 1335-1340 level. As market has passed halfway already to the point, it should not turn down significantly. Besides, gold market has such issue – it can stand with overbought during extended period. It means that theoretically we should not get too extended retracement down, until market will not hit target. Other words, I can’t exclude possible scenario, when market will creep with overbought line till its target. On intraday charts it will look like small retracements at the beginning of the day and action to new highs at the end of the day. Once again, here we will have to look on patterns. B&B’s are very typical for such price action. Green line is 200-MA that was mentioned in fundamental part of this research…
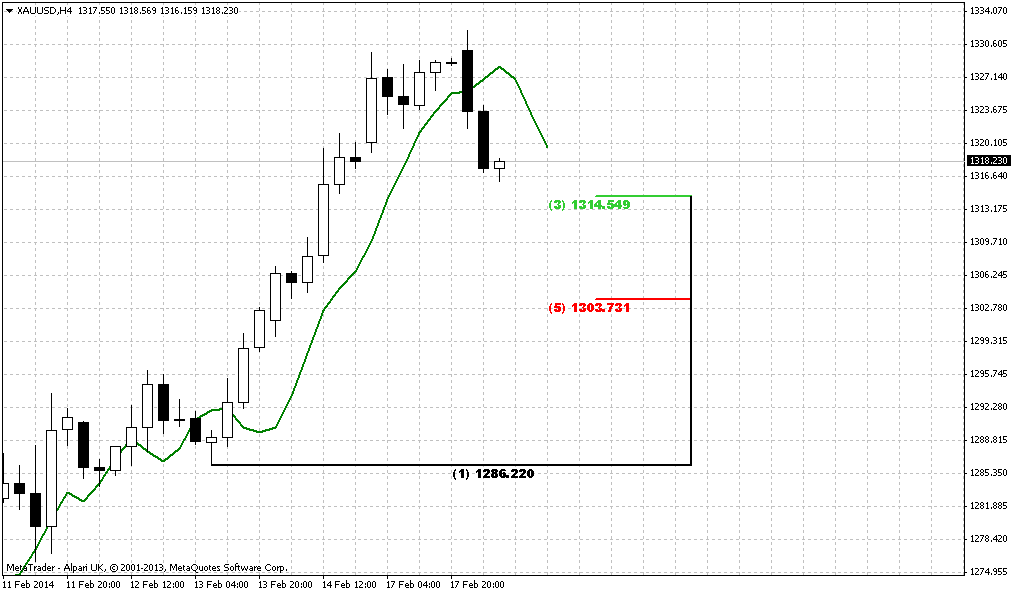
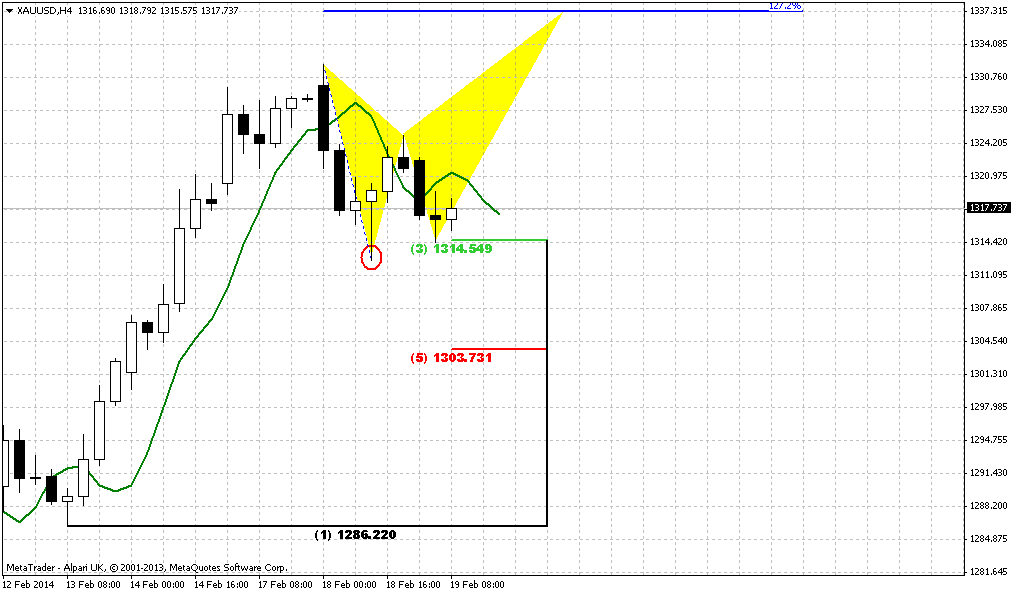
4-hour
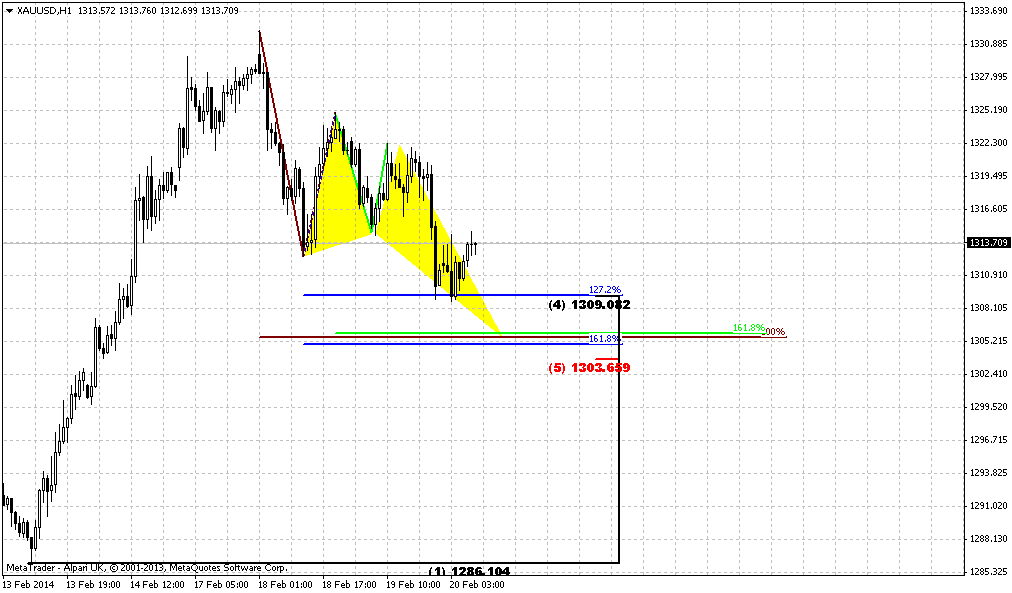
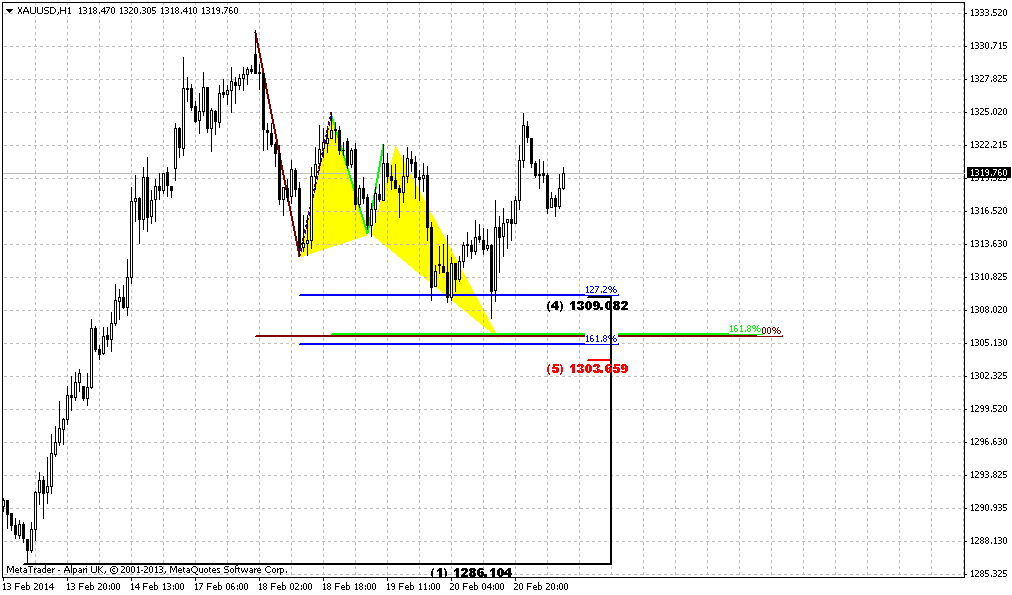
Here, guys again – as in current GBP research, watch for type of pattern that will trigger retracement down. Although we’ve said that theoretically market should turn to forming of minor bounces day by day and continue creep higher to daily AB-CD target, but you will be able to understand if this will not happen by keeping an eye on patterns. Particularly speaking most probable patterns here are DRPO or B&B by DiNapoli framework. If market will form B&B from most recent swing up, then it will probably continue move higher, while appearing of DRPO here could trigger deeper retracement and lead to B&B, but on daily chart. You can read GBP analysis where we explain the same thing.
On hourly chart you can find even smaller setup for the same patterns – either B&B or DRPO.
Conclusion:
So, there is definitely something is changing on gold market, but these changes are not stable yet and investors will be over-reliant on US macro data in nearest future. Technically context looks bullish with nearest target at 1360 area.
In short-term perspective market should continue move higher till 1330 target, but could do this differently either after solid daily retracement or by just creeping with daily overbought. You will be able to understand it if will keep an eye on patterns that market will form in intraday charts in the beginning of the week.
The technical portion of Sive's analysis owes a great deal to Joe DiNapoli's methods, and uses a number of Joe's proprietary indicators. Please note that Sive's analysis is his own view of the market and is not endorsed by Joe DiNapoli or any related companies.
Gold rose to a three-month high above $1,300 an ounce on Friday, gaining 1 percent and notching its biggest weekly gain in six months, as weak U.S. manufacturing output pressured the dollar and lifted bullion's currency-hedge appeal. A technical break-out above tough resistance at its 200-day moving average, and signs of recovering investment demand in gold exchange-traded funds, also triggered gold buying, traders said. Bullion reversed its recent strong inverse link with equities, which had been pressured by economic uncertainties and emerging-market jitters.
On Friday, U.S. equities, measured by the S&P 500 index, rose 0.5 percent as investors were willing to add riskier investments by overlooking some soft economic data stemming from bad weather.
"Risk-on is typically deemed bad for precious metals prices, but the downdraft for the dollar and the steady-as-she-goes Fed policy threatening slow retreat from an ultra-easy stance, is boosting demand for gold," said Andrew Wilkinson, chief market analyst at Interactive Brokers LLC. Spot gold was up 1.2 percent at $1,317.90 an ounce by 2:06 p.m. EST (1906 GMT), after rising to its highest since Nov. 7 at $1,320.90. It was up around 4 percent for the week, the largest such gain since mid-August. The technical picture has improved over the past few sessions and a move above its 200-day moving average, last seen in August 2012, analysts said. Gold has gained nearly 9 percent since the beginning of the year, after a 28 percent drop in 2013, on doubts over the U.S. economic recovery and as emerging-market turmoil weighed on some equity markets.
Analysts remain cautious over the medium-term outlook for gold, however. Many expect the U.S. economy to recover and the dollar to rally, making the investment case for gold, usually seen as a safe haven in times of trouble, still unattractive. Investor sentiment seems to have improved, with SPDR Gold Trust, the world's largest gold-backed exchange-traded fund, posting its biggest inflow since late December, up 7.5 tonnes to 806.35 tonnes on Thursday.
Recall that we’ve pointed on previous week that CFTC data has showed very interesting picture. We saw significant increasing in net long position and simultaneous decreasing of open interest. It means that recent upward action was not supported by trading volumes. This makes it fragile. Second interesting fact here is activity on gold market decreases during the recent year. Take a look that since last January – open interest is gradually decreasing right till current moment, despite how net position has changed and it stands at the level of March 2013. As current move up was not supported by volumes, we should be ready either for deep move down or even to downward continuation. Anyway be careful with any long position on daily time frame and higher.
And now we’ve got logical continuation of this suggestion – open interest has jumped significantly with simultaneous decreasing of net long position. It means that more new short positions have come on market. This absolutely does not mean that upward action will not continue or fail. But this could become a sign of possible solid bounce.
Monthly
Just on previous week we’ve discussed how it could become important to get clear bullish engulfing pattern here. But right at the last week of January upward candle has diminished twice in size. Market has erased almost 50% of upward January action. As result we’ve got much shyer engulfing pattern that in fact, stands at the edge to be called as “englfing”. Still, as we’ve said that our invalidation point is previous lows – let’s see. Chances on upward action still exist here, especially now, since February action as twice as greater than January. The warning sign is CFTC report of cause, but currently it has not led to any negative conequences. Besides, it could trigger just a retracement, but not neccesary downward continuation on monthly.
Trend holds bearish still. Appearing of 1361 Yearly PP could get special meaning from possible retracement point of view. It could become possible nearest upside target. Yearly PR1 is also very significant. We know that gold likes to re-test previously broken lows and consolidations. 1540 area is monthly overbought, YPR1 and low border of broken long-term rectangle. As market was strongly oversold, why it can’t reach overbought? This is very typical action for any market.
As another application of significantly oversold we’ve suggested retracement up. Thus, we’ve made an assumption of possible deeper upward retracement that could take a shape of AB=CD, and invalidation for this setup is previous lows around 1170s. In fact current move up could be the last chance for possible upward bounce, if, say, market will show something like double bottom. Currently price action is very suitable for that – W&R of first bottom. This action in general is very typical for double bottoms and fake breakout could be the first sign of possible retracement up. Bearish market has no other reasons to stop right here, since there is no support right now – it has passed through 3/8 support, it’s not at oversold. Currently we should keep a close eye on move up.
At the same time fundamental data, still stands very unstable and fickle, seasonal trend and physical demand from time to time also do not quite support upward action, at least right now. May be a bit later situation will change, but market will enter seasonal bearish trend in February and it will be even more difficult to continue move higher. Recent CFTC data also does not encourage optimism, although SPDR reports on inflow. Definitely situation is better than some months ago and something really is changing here, but this optimism is still very unstable. Very probably that market will become a shadow of US macro data in nearest months. Investors right now still are over-reliant on US data and this is understandably. This relation probably will hold for some time still.
Weekly
Trend is bullish here, market is not at overbought. Recent week has shown solid bullish action that gives us more confidence with its continuation. First is, market has passed through MPR1 and this is definitely bullish sign suggesting that current upward action is not just upward retracement. Second – market has passed through weekly 25x5 DMA. This also usually happens when trend is changing.
Previously we also have noted that we’ve got solid bullish divergence with MACD. By treating valleys as AB=CD pattern we’ll see that minor extension stands almost right at Yearly Pivot Point, and 1.618 extension stands slightly higher than Yearly PR1. Thus, our next destination here is YPP.
Daily
Technically picture reminds daily one of GBP that we also have prepared on current week. Trend is bullish here, action up is strong, but market has hit daily overbought. It is very difficult to say, guys, whether we’ve got here reversed H&S or not – decide by yourself. Hindsight is always twenty-twenty and probably we could find both shoulders here, but it was too skewed for normal H&S and it was really challenge to find this while pattern was standing in progress. Right now we just could use possible target of this move. At least this just the one pattern that we have now – upward AB=CD that creates an Agreement with solid 5/8 Fib resistance around 1335-1340 level. As market has passed halfway already to the point, it should not turn down significantly. Besides, gold market has such issue – it can stand with overbought during extended period. It means that theoretically we should not get too extended retracement down, until market will not hit target. Other words, I can’t exclude possible scenario, when market will creep with overbought line till its target. On intraday charts it will look like small retracements at the beginning of the day and action to new highs at the end of the day. Once again, here we will have to look on patterns. B&B’s are very typical for such price action. Green line is 200-MA that was mentioned in fundamental part of this research…
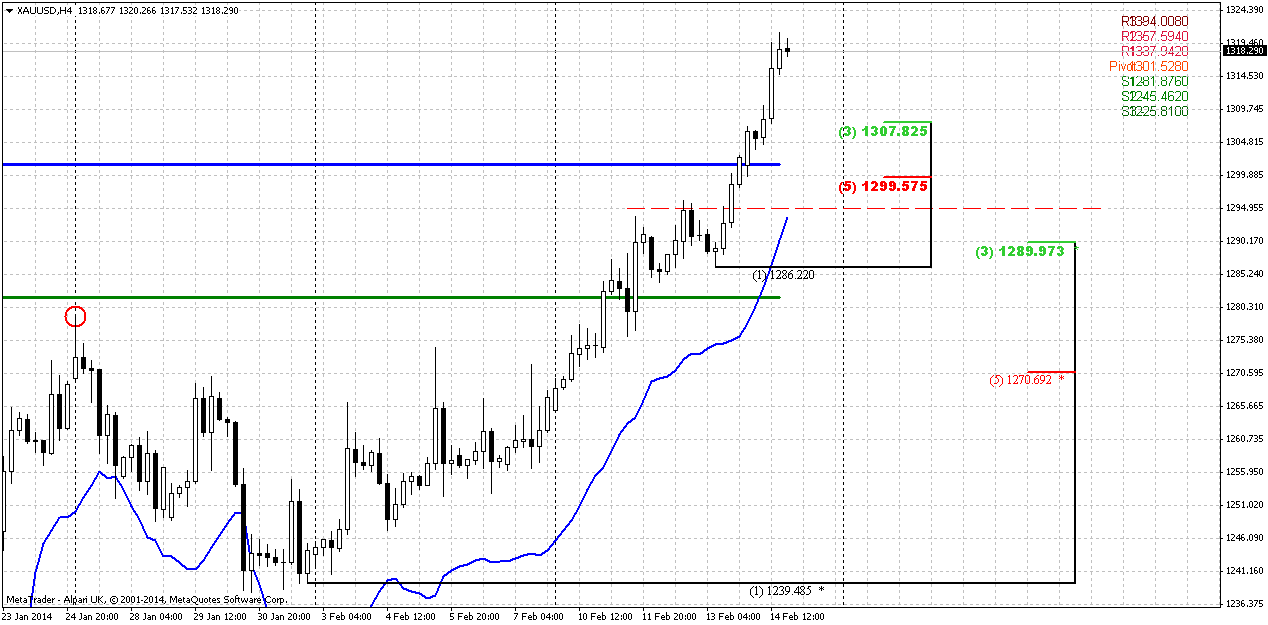
4-hour
Here, guys again – as in current GBP research, watch for type of pattern that will trigger retracement down. Although we’ve said that theoretically market should turn to forming of minor bounces day by day and continue creep higher to daily AB-CD target, but you will be able to understand if this will not happen by keeping an eye on patterns. Particularly speaking most probable patterns here are DRPO or B&B by DiNapoli framework. If market will form B&B from most recent swing up, then it will probably continue move higher, while appearing of DRPO here could trigger deeper retracement and lead to B&B, but on daily chart. You can read GBP analysis where we explain the same thing.
On hourly chart you can find even smaller setup for the same patterns – either B&B or DRPO.
Conclusion:
So, there is definitely something is changing on gold market, but these changes are not stable yet and investors will be over-reliant on US macro data in nearest future. Technically context looks bullish with nearest target at 1360 area.
In short-term perspective market should continue move higher till 1330 target, but could do this differently either after solid daily retracement or by just creeping with daily overbought. You will be able to understand it if will keep an eye on patterns that market will form in intraday charts in the beginning of the week.
The technical portion of Sive's analysis owes a great deal to Joe DiNapoli's methods, and uses a number of Joe's proprietary indicators. Please note that Sive's analysis is his own view of the market and is not endorsed by Joe DiNapoli or any related companies.