Sive Morten
Special Consultant to the FPA
- Messages
- 18,699
Fundamentals
Gold rose on Friday, notching its third consecutive weekly gain, as doubts over U.S. economic recovery helped lift bullion's safe-haven appeal. Bullion was supported after a report showed existing U.S. home sales fell more than expected to an 18-month low in January, the latest metric to indicate softness, though many analysts attributed the weakness to weather instead of worsening fundamentals. The yellow metal rallied to a 3-1/2 month high earlier this week after a series of disappointing U.S. economic indicators including weak manufacturing data sparked speculation that the Federal Reserve would slow the tapering of its bond purchases. Miguel Perez-Santalla, vice president at online precious metals market BullionVault, said the metal's ability to hold above key technical support at $1,200 an ounce earlier this year rekindled fund interest to buy gold. "I believe that the large investment firms have rebalanced their portfolios to include gold. And that is a main factor sustaining gold and may drive prices up into the future," said Perez-Santalla.
The world's largest gold-backed exchange-traded fund, SPDR Gold Shares, notched its first weekly outflow in four weeks, of 5.6 tonnes, although in general, outflow has lost it’s pace and within a month SPDR assets relatively stabilized, compares to what we’ve seen previously.
Buying in Asia, a major demand center for physical gold, remained light. Dealers saw purchases in the physical market this week, but many jewellers could be waiting for a correction. "I think (the price) is a little bit too high for Asians to buy gold, because we've been below $1,300 for a long time and people bought a lot," Yuichi Ikemizu, branch manager for Standard Bank in Tokyo, said.
Among other metals, silver gained 0.4 percent to $21.88 an ounce. Palladium was up 1.1 percent at $1,426.24 an ounce, while platinum rose 0.8 percent to $739.50 an ounce. Dealers said a violent attack in the turbulent, strike-hit platinum mining belt in South Africa lifted prices. A miner was killed by group of men at mine belonging to Anglo American Platinum, police said on Friday.
Recall that we’ve pointed on previous week that CFTC data has showed very interesting picture. We saw significant increasing in net long position and simultaneous decreasing of open interest. It means that recent upward action was not supported by trading volumes. This makes it fragile. Second interesting fact here is activity on gold market decreases during the recent year. Take a look that since last January – open interest is gradually decreasing right till current moment, despite how net position has changed and it stands at the level of March 2013. As current move up was not supported by volumes, we should be ready either for deep move down or even to downward continuation. Anyway be careful with any medium-term long position on daily time frame and higher. ON passed week we see the same picture – net long position has increased but open interest has not changed much…
Monthly
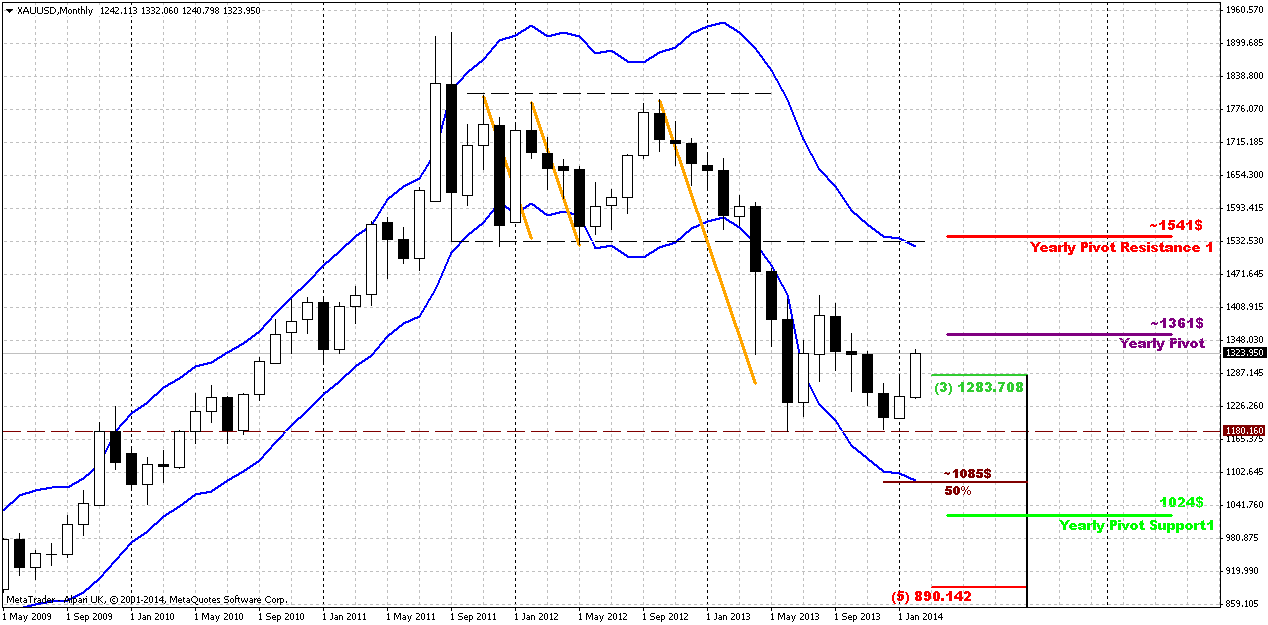
We’ve discussed how it could become important to get clear bullish engulfing pattern here. But right at the last week of January upward candle has diminished twice in size. Market has erased almost 50% of upward January action. As result we’ve got much shyer engulfing pattern that in fact, stands at the edge to be called as “englfing”. Still, as we’ve said that our invalidation point is previous lows – let’s see. February action is promising and we haven’t seen such action since mid 2013. Chances on upward action still exist here, especially now, since February action as twice as greater than January. The warning sign is CFTC report of cause, but currently it has not led to any negative conequences. Besides, it could trigger just a retracement, but not neccesary downward continuation on monthly. From fundamental part of view there two opposite opinions. Some analysts tell about 1050-1100 level and point that current action comes from negative US data, but this data is a result of heavy winter. As spring will come – data will improve and rally will be over. Others have opposite opinion. In general, here is excellent article on bloomberg, dedicated to gold:
Top Two Gold Forecasters Remain Bearish After 2014 Rally - Bloomberg
Second opinion comes from UBS – it opositely has increased forecast on gold:
Gold Losing Stigma for UBS as Tully Increases Forecasts for 2014 - Bloomberg
(But guys, to be honest, I suspect that both forecasts could be reached. Recall our long-term expectation – two leg retracement down. Now we expect deep retracement and later return to previous lows. Hence, first forecast of higher prices has relation to current retracement, while second one – to second leg, when gold due bearish momentum should return right back down to current lows.)
Anyway, trend holds bearish still. Appearing of 1361 Yearly PP could get special meaning from possible retracement point of view. It could become possible nearest upside target. Yearly PR1 is also very significant. We know that gold likes to re-test previously broken lows and consolidations. 1540 area is monthly overbought, YPR1 and low border of broken long-term rectangle. As market was strongly oversold, why it can’t reach overbought? This is very typical action for any market.
As another application of significantly oversold we’ve suggested retracement up. Thus, we’ve made an assumption of possible deeper upward retracement that could take a shape of AB=CD, and invalidation for this setup is previous lows around 1170s. In fact current move up could be the last chance for possible upward bounce, if, say, market will show something like double bottom. Currently price action is very suitable for that – W&R of first bottom. This action in general is very typical for double bottoms and fake breakout could be the first sign of possible retracement up. Bearish market has no other reasons to stop right here, since there is no support right now – it has passed through 3/8 support, it’s not at oversold. Currently we should keep a close eye on move up.
At the same time fundamental data, still stands very unstable and fickle, seasonal trend and physical demand from time to time also do not quite support upward action, at least right now. May be a bit later situation will change, but market will enter seasonal bearish trend in February and it will be even more difficult to continue move higher. Recent CFTC data also does not encourage optimism, although SPDR reports mixed data. Definitely situation is better than some months ago and something really is changing here, but this optimism is still very unstable. Very probably that market will become a shadow of US macro data in nearest months. Investors right now still are over-reliant on US data and this is understandably. This relation probably will hold for some time still.
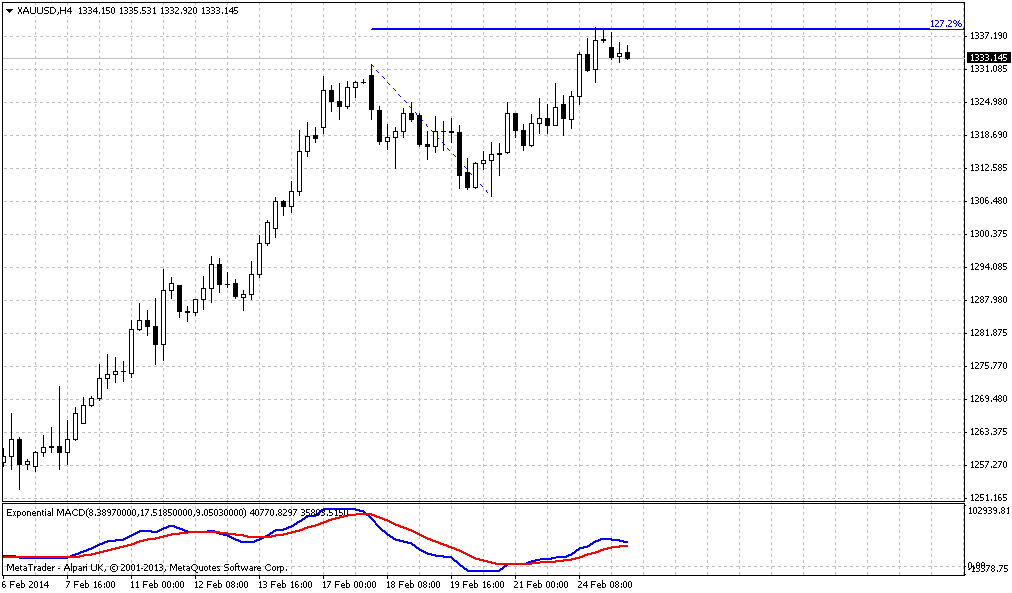
Weekly
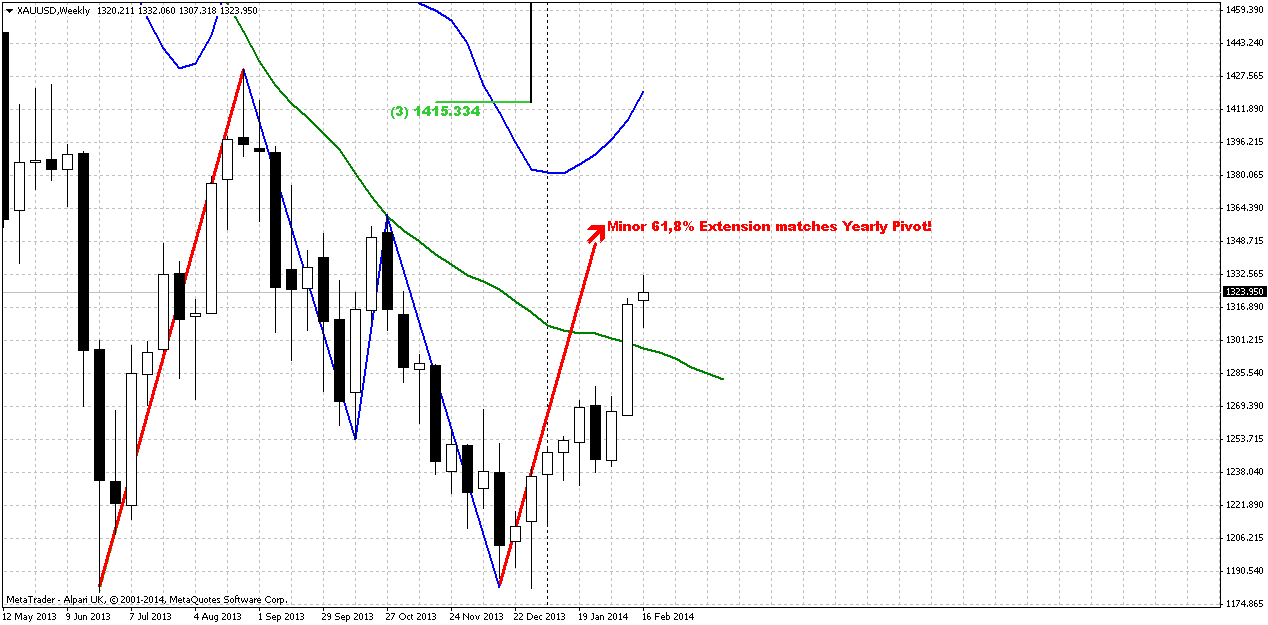
Trend is bullish here, market is not at overbought. Market has taken some pause in upward action during passed week, but previously gold has shown solid bullish action that gives us more confidence with its continuation. First is, market has passed through MPR1 and this is definitely bullish sign suggesting that current upward action is not just upward retracement. Second – market has passed through weekly 25x5 DMA. This also usually happens when trend is changing.
Previously we also have noted that we’ve got solid bullish divergence with MACD. By treating valleys as AB=CD pattern we’ll see that minor extension stands almost right at Yearly Pivot Point, and 1.618 extension stands slightly higher than Yearly PR1. Thus, our next destination here is YPP.
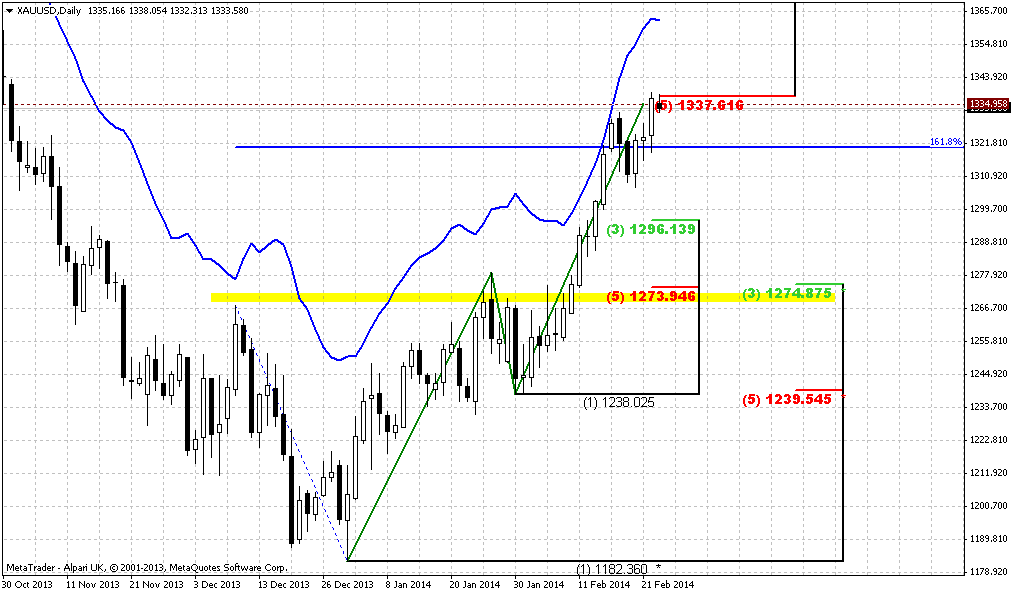
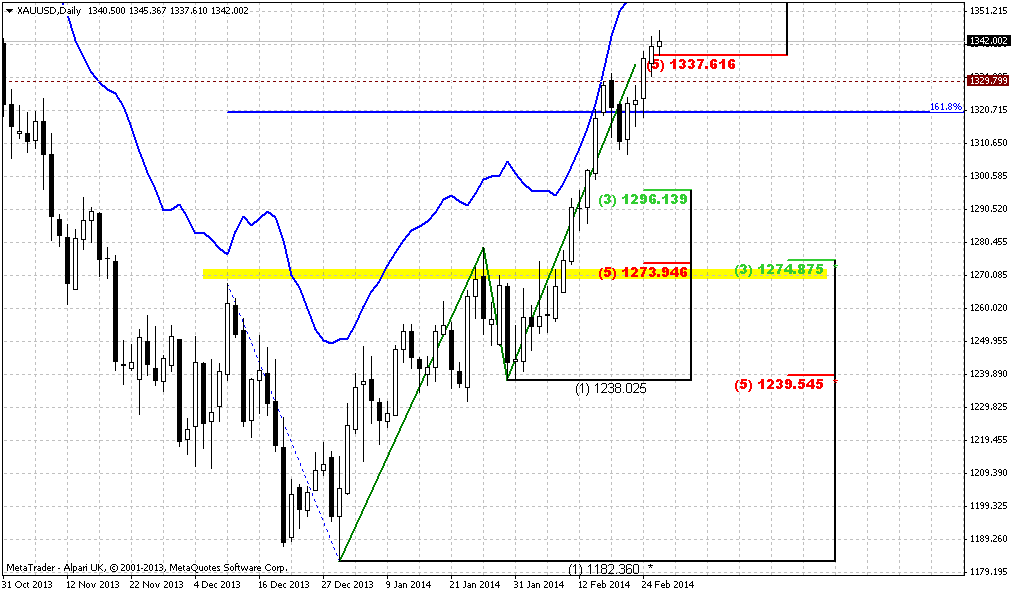
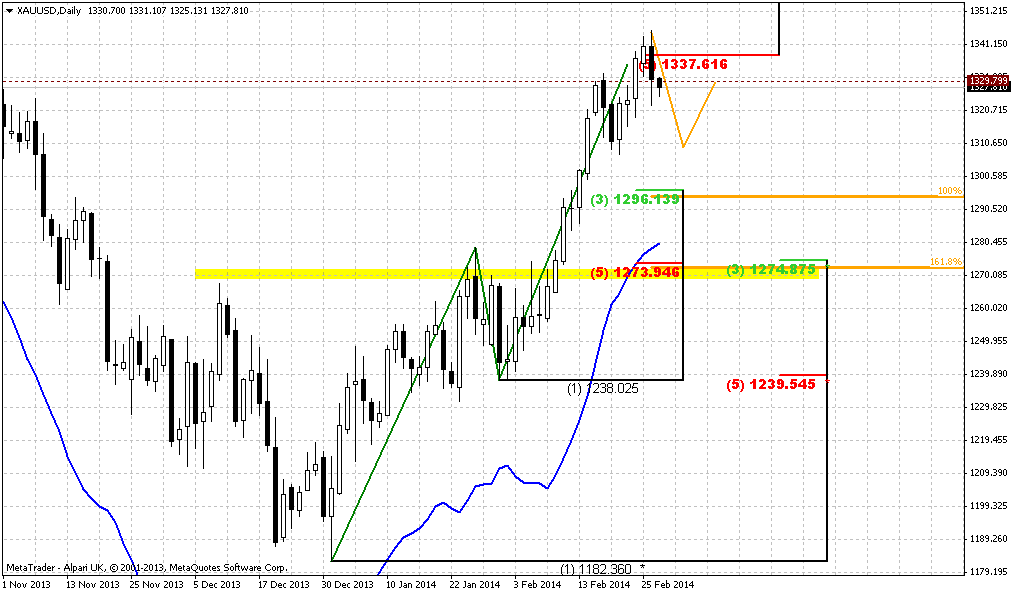
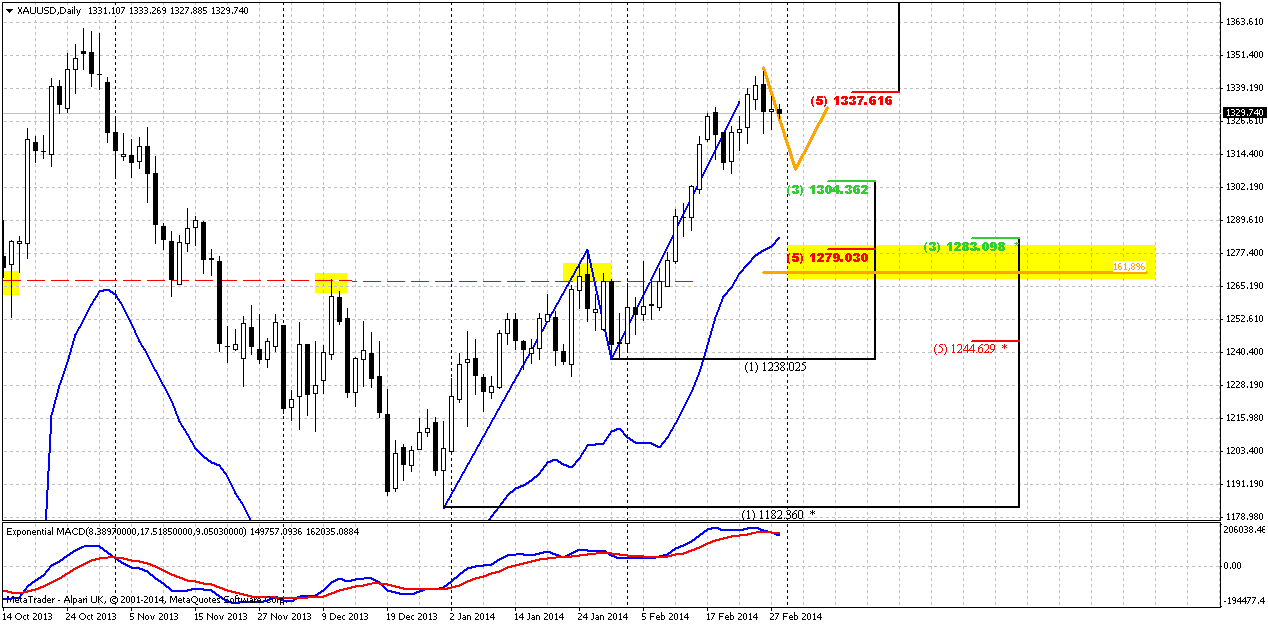
Daily
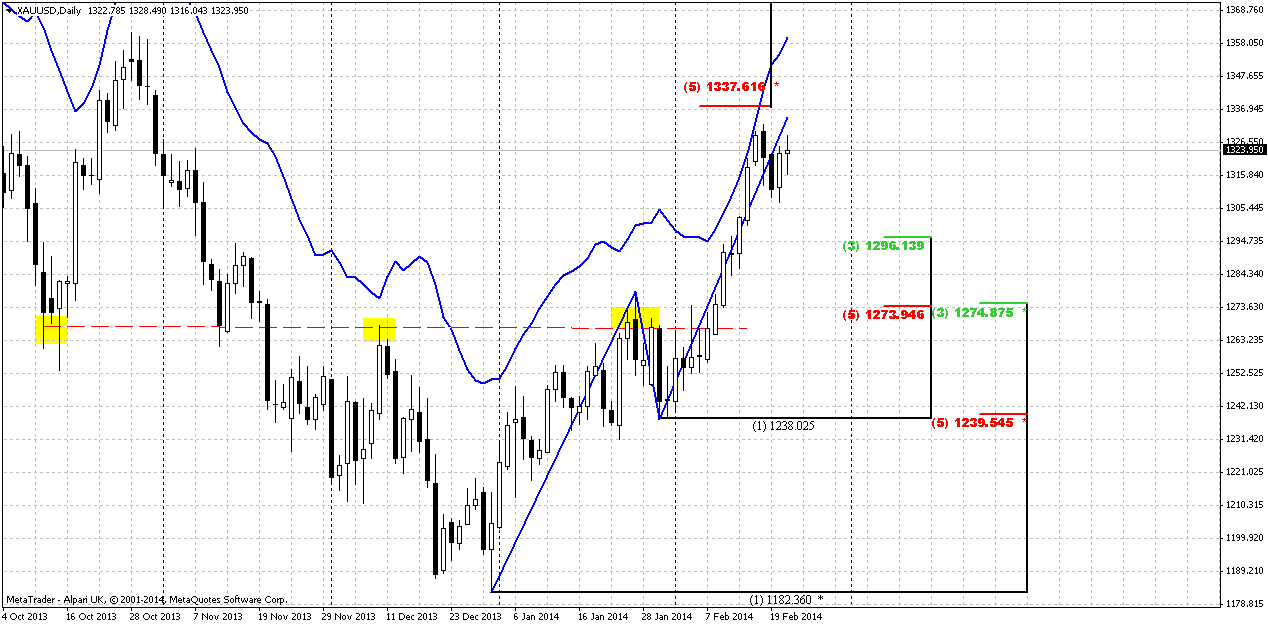
It happens quite rare, but today we can apply the same analysis here as week ago. Mostly because price has stand in very tight action on recent week, and points that we have expected to be achieved – weren’t achieved by price action. You probably already have tired from my repeating that price has not quite reached target, that’s why this should happen prior any meaningful retracement will start. But, guys, that’s really important and we just can’t ignore it, since this could become the core of short-term action on gold market.
The one pattern that we have now – upward AB=CD that creates an Agreement with solid 5/8 Fib resistance around 1335-1340 level. The CD leg is suitable for any DiNapoli pattern – either B&B or DRPO. We’ve counted on it on previous week, but haven’t got it. I do not have 3x3 DMA here, but market has not shown any crossing of it yet. So the major action still ahead, I suppose. Thus, first we need to get final (in short-term of cause) move up to 1335-1340 area. Here we can try to take scalp short position, depending on situation and the degree of clarity of patterns that could be formed there. Second stage is solid retracement down. I can’t exclude that this retracement could reach 1275 K-support area, also because gold has a habit to re-test broken levels and 1275 is former natural support /resistance line.
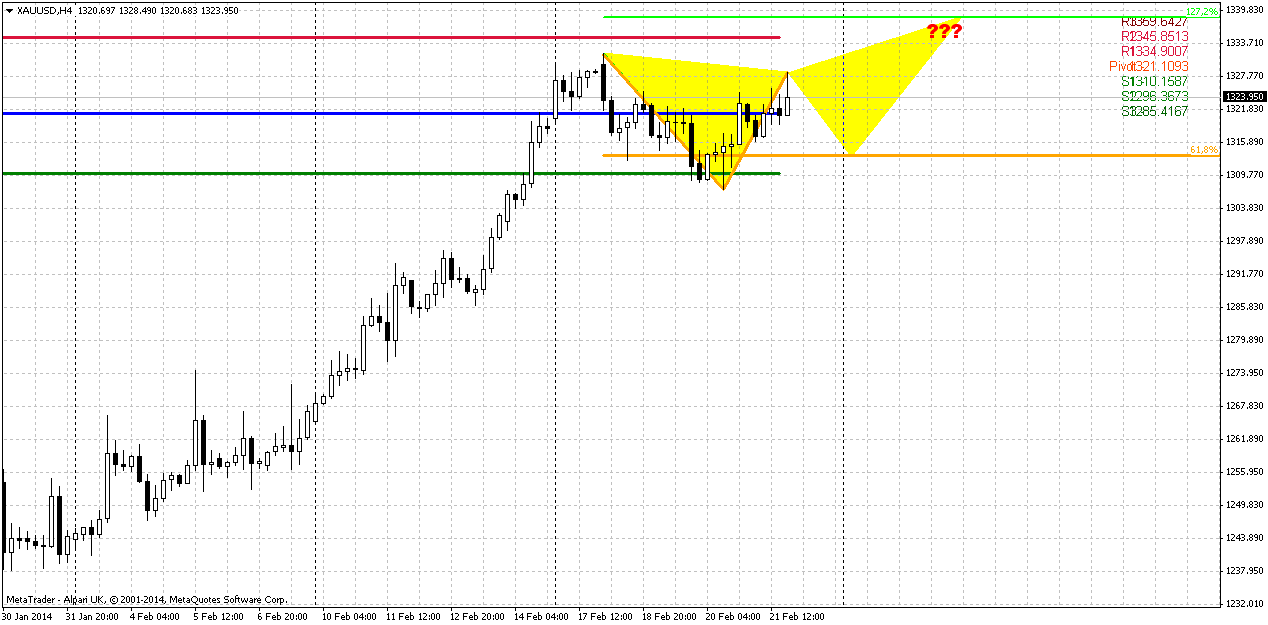
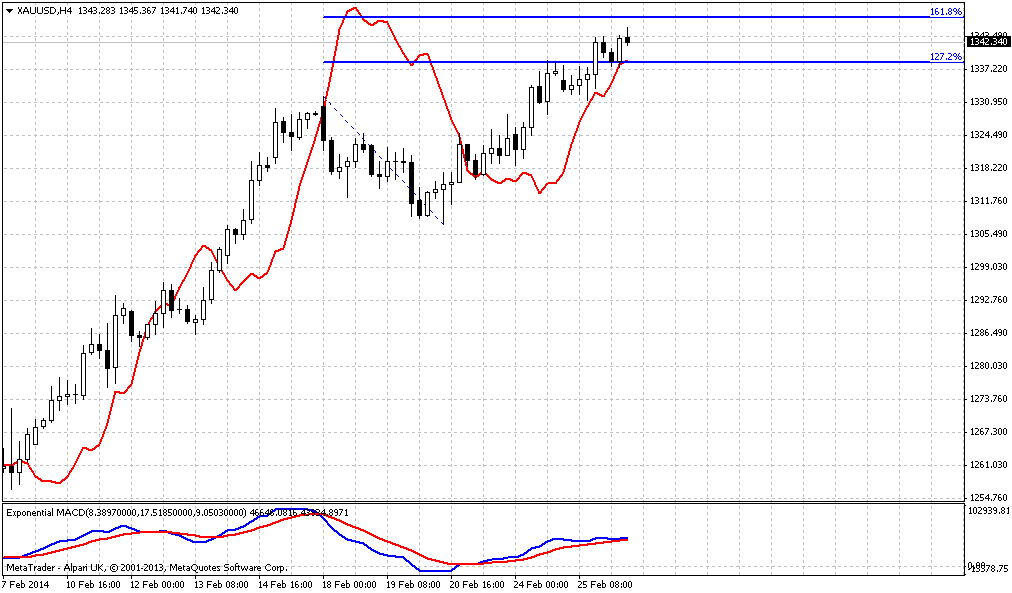
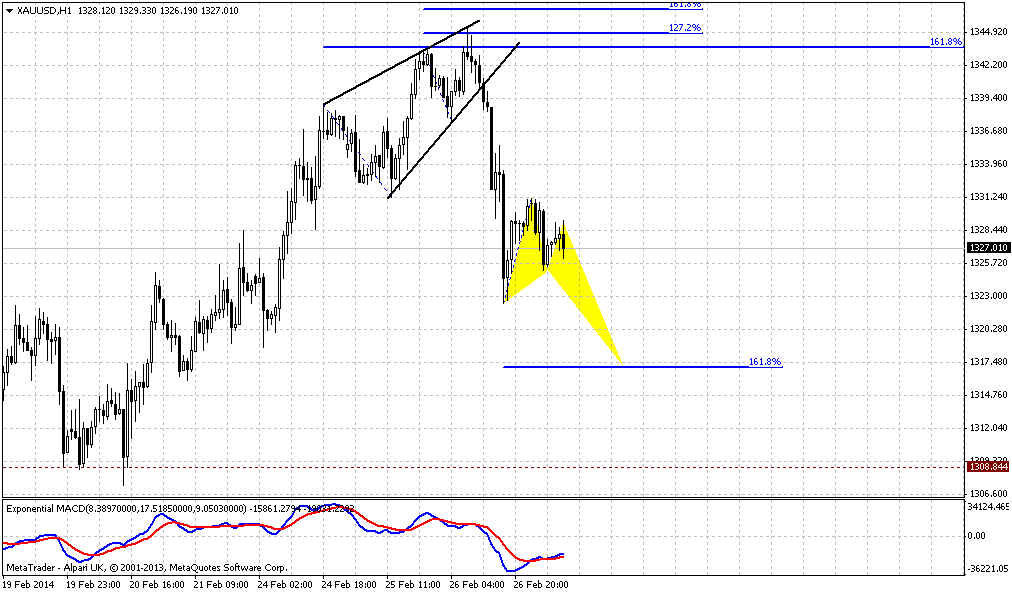
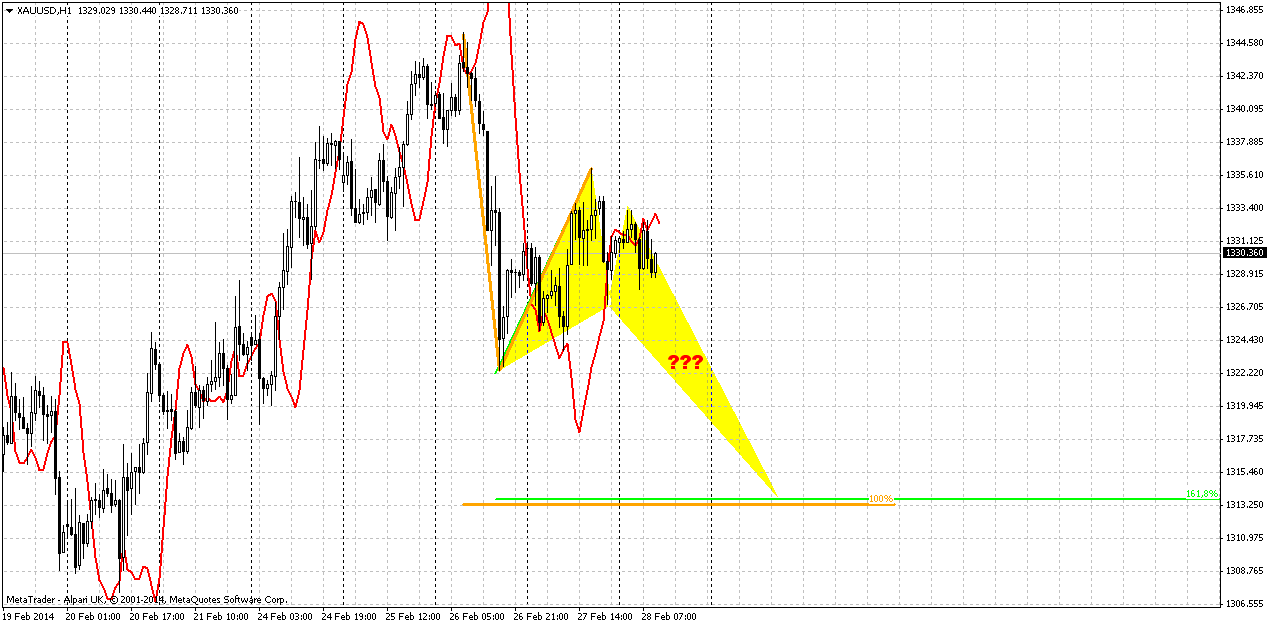
4-hour
On 4-hour chart I do not see right now any other scenario but the butterfly “sell”. Since only this pattern can satisfy all our requirements on reversal – first hit 1335-1340 area and turning down then. Pivot ponits stand very tight on coming week, since on previous week price also mostly stands indecision. Thus, market can show shy downward action in the beginning of the week as 0.618 extension of AB=CD and then start to form right shoulder of the pattern. May be price will reach WPS1, but this will not change the core. The major condition here is price should stand inside initial swing. Otherwise butterfly will fail. Extension target of the pattern gives us 1339 level that is 100% acceptable for our trading plan. Simultaneously butterfly could become a triggering pattern to 1275 move, since this is reversal pattern as well.
Conclusion:
So, there is definitely something is changing on gold market, but these changes are not stable yet and investors will be over-reliant on US macro data in nearest future. Technically context looks bullish with nearest target at 1360 area.
In short-term perspective market should hit 1335-1340 area first, prior to any solid retracement. Thus, any move down before target will be hit, should be treated with suspicions. In fact, we do not care much how market will hit 1335-1340 – either by 4-hour butterfly pattern or by some daily pattern. We can use any of them, depending on what we will get. The primary target is to get this level, since this is the key to retracement. When and if market will hit this target we can try to search for scalp short patterns, since target of possible retracement down will be around 1275. But our major object here is long entry after this retracement for medium-term perspective and upside target around 1360 first.
The technical portion of Sive's analysis owes a great deal to Joe DiNapoli's methods, and uses a number of Joe's proprietary indicators. Please note that Sive's analysis is his own view of the market and is not endorsed by Joe DiNapoli or any related companies.
Gold rose on Friday, notching its third consecutive weekly gain, as doubts over U.S. economic recovery helped lift bullion's safe-haven appeal. Bullion was supported after a report showed existing U.S. home sales fell more than expected to an 18-month low in January, the latest metric to indicate softness, though many analysts attributed the weakness to weather instead of worsening fundamentals. The yellow metal rallied to a 3-1/2 month high earlier this week after a series of disappointing U.S. economic indicators including weak manufacturing data sparked speculation that the Federal Reserve would slow the tapering of its bond purchases. Miguel Perez-Santalla, vice president at online precious metals market BullionVault, said the metal's ability to hold above key technical support at $1,200 an ounce earlier this year rekindled fund interest to buy gold. "I believe that the large investment firms have rebalanced their portfolios to include gold. And that is a main factor sustaining gold and may drive prices up into the future," said Perez-Santalla.
The world's largest gold-backed exchange-traded fund, SPDR Gold Shares, notched its first weekly outflow in four weeks, of 5.6 tonnes, although in general, outflow has lost it’s pace and within a month SPDR assets relatively stabilized, compares to what we’ve seen previously.
Buying in Asia, a major demand center for physical gold, remained light. Dealers saw purchases in the physical market this week, but many jewellers could be waiting for a correction. "I think (the price) is a little bit too high for Asians to buy gold, because we've been below $1,300 for a long time and people bought a lot," Yuichi Ikemizu, branch manager for Standard Bank in Tokyo, said.
Among other metals, silver gained 0.4 percent to $21.88 an ounce. Palladium was up 1.1 percent at $1,426.24 an ounce, while platinum rose 0.8 percent to $739.50 an ounce. Dealers said a violent attack in the turbulent, strike-hit platinum mining belt in South Africa lifted prices. A miner was killed by group of men at mine belonging to Anglo American Platinum, police said on Friday.
Recall that we’ve pointed on previous week that CFTC data has showed very interesting picture. We saw significant increasing in net long position and simultaneous decreasing of open interest. It means that recent upward action was not supported by trading volumes. This makes it fragile. Second interesting fact here is activity on gold market decreases during the recent year. Take a look that since last January – open interest is gradually decreasing right till current moment, despite how net position has changed and it stands at the level of March 2013. As current move up was not supported by volumes, we should be ready either for deep move down or even to downward continuation. Anyway be careful with any medium-term long position on daily time frame and higher. ON passed week we see the same picture – net long position has increased but open interest has not changed much…
Monthly
We’ve discussed how it could become important to get clear bullish engulfing pattern here. But right at the last week of January upward candle has diminished twice in size. Market has erased almost 50% of upward January action. As result we’ve got much shyer engulfing pattern that in fact, stands at the edge to be called as “englfing”. Still, as we’ve said that our invalidation point is previous lows – let’s see. February action is promising and we haven’t seen such action since mid 2013. Chances on upward action still exist here, especially now, since February action as twice as greater than January. The warning sign is CFTC report of cause, but currently it has not led to any negative conequences. Besides, it could trigger just a retracement, but not neccesary downward continuation on monthly. From fundamental part of view there two opposite opinions. Some analysts tell about 1050-1100 level and point that current action comes from negative US data, but this data is a result of heavy winter. As spring will come – data will improve and rally will be over. Others have opposite opinion. In general, here is excellent article on bloomberg, dedicated to gold:
Top Two Gold Forecasters Remain Bearish After 2014 Rally - Bloomberg
Second opinion comes from UBS – it opositely has increased forecast on gold:
Gold Losing Stigma for UBS as Tully Increases Forecasts for 2014 - Bloomberg
(But guys, to be honest, I suspect that both forecasts could be reached. Recall our long-term expectation – two leg retracement down. Now we expect deep retracement and later return to previous lows. Hence, first forecast of higher prices has relation to current retracement, while second one – to second leg, when gold due bearish momentum should return right back down to current lows.)
Anyway, trend holds bearish still. Appearing of 1361 Yearly PP could get special meaning from possible retracement point of view. It could become possible nearest upside target. Yearly PR1 is also very significant. We know that gold likes to re-test previously broken lows and consolidations. 1540 area is monthly overbought, YPR1 and low border of broken long-term rectangle. As market was strongly oversold, why it can’t reach overbought? This is very typical action for any market.
As another application of significantly oversold we’ve suggested retracement up. Thus, we’ve made an assumption of possible deeper upward retracement that could take a shape of AB=CD, and invalidation for this setup is previous lows around 1170s. In fact current move up could be the last chance for possible upward bounce, if, say, market will show something like double bottom. Currently price action is very suitable for that – W&R of first bottom. This action in general is very typical for double bottoms and fake breakout could be the first sign of possible retracement up. Bearish market has no other reasons to stop right here, since there is no support right now – it has passed through 3/8 support, it’s not at oversold. Currently we should keep a close eye on move up.
At the same time fundamental data, still stands very unstable and fickle, seasonal trend and physical demand from time to time also do not quite support upward action, at least right now. May be a bit later situation will change, but market will enter seasonal bearish trend in February and it will be even more difficult to continue move higher. Recent CFTC data also does not encourage optimism, although SPDR reports mixed data. Definitely situation is better than some months ago and something really is changing here, but this optimism is still very unstable. Very probably that market will become a shadow of US macro data in nearest months. Investors right now still are over-reliant on US data and this is understandably. This relation probably will hold for some time still.
Weekly
Trend is bullish here, market is not at overbought. Market has taken some pause in upward action during passed week, but previously gold has shown solid bullish action that gives us more confidence with its continuation. First is, market has passed through MPR1 and this is definitely bullish sign suggesting that current upward action is not just upward retracement. Second – market has passed through weekly 25x5 DMA. This also usually happens when trend is changing.
Previously we also have noted that we’ve got solid bullish divergence with MACD. By treating valleys as AB=CD pattern we’ll see that minor extension stands almost right at Yearly Pivot Point, and 1.618 extension stands slightly higher than Yearly PR1. Thus, our next destination here is YPP.
Daily
It happens quite rare, but today we can apply the same analysis here as week ago. Mostly because price has stand in very tight action on recent week, and points that we have expected to be achieved – weren’t achieved by price action. You probably already have tired from my repeating that price has not quite reached target, that’s why this should happen prior any meaningful retracement will start. But, guys, that’s really important and we just can’t ignore it, since this could become the core of short-term action on gold market.
The one pattern that we have now – upward AB=CD that creates an Agreement with solid 5/8 Fib resistance around 1335-1340 level. The CD leg is suitable for any DiNapoli pattern – either B&B or DRPO. We’ve counted on it on previous week, but haven’t got it. I do not have 3x3 DMA here, but market has not shown any crossing of it yet. So the major action still ahead, I suppose. Thus, first we need to get final (in short-term of cause) move up to 1335-1340 area. Here we can try to take scalp short position, depending on situation and the degree of clarity of patterns that could be formed there. Second stage is solid retracement down. I can’t exclude that this retracement could reach 1275 K-support area, also because gold has a habit to re-test broken levels and 1275 is former natural support /resistance line.
4-hour
On 4-hour chart I do not see right now any other scenario but the butterfly “sell”. Since only this pattern can satisfy all our requirements on reversal – first hit 1335-1340 area and turning down then. Pivot ponits stand very tight on coming week, since on previous week price also mostly stands indecision. Thus, market can show shy downward action in the beginning of the week as 0.618 extension of AB=CD and then start to form right shoulder of the pattern. May be price will reach WPS1, but this will not change the core. The major condition here is price should stand inside initial swing. Otherwise butterfly will fail. Extension target of the pattern gives us 1339 level that is 100% acceptable for our trading plan. Simultaneously butterfly could become a triggering pattern to 1275 move, since this is reversal pattern as well.
Conclusion:
So, there is definitely something is changing on gold market, but these changes are not stable yet and investors will be over-reliant on US macro data in nearest future. Technically context looks bullish with nearest target at 1360 area.
In short-term perspective market should hit 1335-1340 area first, prior to any solid retracement. Thus, any move down before target will be hit, should be treated with suspicions. In fact, we do not care much how market will hit 1335-1340 – either by 4-hour butterfly pattern or by some daily pattern. We can use any of them, depending on what we will get. The primary target is to get this level, since this is the key to retracement. When and if market will hit this target we can try to search for scalp short patterns, since target of possible retracement down will be around 1275. But our major object here is long entry after this retracement for medium-term perspective and upside target around 1360 first.
The technical portion of Sive's analysis owes a great deal to Joe DiNapoli's methods, and uses a number of Joe's proprietary indicators. Please note that Sive's analysis is his own view of the market and is not endorsed by Joe DiNapoli or any related companies.
")