Sive Morten
Special Consultant to the FPA
- Messages
- 18,732
Fundamentals
Weekly Gold Tading Report prepared by Sive Morten exclusively for ForexPeaceArmy.com
Reuters reports, Gold rose on Friday as the dollar and equities failed to react to a better-than-forecast U.S. jobs report, and the metal was set for the first weekly gain in four weeks as political uncertainty in Greece boosted demand for assets seen as safe.
Spot prices were heading for a 2.5 percent weekly gain, snapping a three-week losing streak, mostly due to global equities slumping at the start of the week on worries over developments in Greece that could see it quitting the euro.
Despite recent improvements in the job market, investors remained focused on the fact that the minutes of the Federal Reserve's latest policy meeting released on Wednesday indicated the U.S. central bank would be patient in raising interest rates due to low inflation expectations.
"Fed doves are happy to wait until they feel inflation's rapier at the tip of their breastbone, rather than just seeing the whites of their eyes," said Tai Wong, director of base and precious metals trading for BMO Capital Markets in New York.
Boston Fed President Eric Rosengren highlighted the Fed's cautious stance, saying it can likely be patient not only on the timing of the first rate hike but also on subsequent increases.
Gold is supported in this tight $1,200/$1,230 range because people are still a bit worried that with low inflationary pressures the Fed will not hike interest rates so soon," ABN Amro analyst Georgette Boele said.
In the physical markets, demand from China has been strong in recent weeks in the build-up to the Lunar New Year holiday in February, when gold is bought for gift-giving.
Premiums on the Shanghai Gold Exchange were hovering between $5 and $6 on Friday over the global benchmark, indicating strong buying interest.
Finally CFTC data starts to give some information. Recent data shows shy increase in open interest, but take a look – this open interest grows mostly due long position, but not short… Interesting. So, it seems that upside action still is getting some support from purchases. Now we need to get respond from SPDR fund – it should either confirm it or… this upside action will fade soon and CFTC data will change. At the same time we need to say that total investors’ positions are small.
Here is detailed breakdown of speculative positions:
Open interest:
 Shorts:
 Longs:

Also guys, I want to share with you on rumors that have appeared around CME. Rumors tell that CME has adopted new trading rule that put more limitations on single day price changing on gold options and futures:
http://www.cmegroup.com/content/dam...ion/lookups/advisories/ser/files/SER-7258.pdf
It raises some questions. Most radical traders think that CME is preparing to unprecedented gold rally and tries to insure and protect itself in advance. Personally I’ve not studied this document with scrutiny yet, but probably I will have to do it soon. It will be great if you will take a look at it and share with your opinion on forum.
Technicals
Monthly
As New Year has started we’ve got some new inputs on monthly chart. Thus, we’ve got new yearly pivots. Most important thing here is shifting up of YPS1. In 2014 it stand at 1020, while in 2015 it stands at 1082$. This is very close to our ultimate 1050 target and in fact coincides with 1.618 butterfly target on monthly chart.
Second important issue – we’ve got bearish grabber on monthly chart as result of December close. I do not know how to match it with worries on new CME regulation act, but this is just a rumor yet and it is possible that this rumor is overestimated. But grabber is a pattern that we have in place. Still they do not contradict to each other, because market could reach lower targets first and only after that turn to upside rally…
Here we still have last big pattern in progress that is Volatility breakout (VOB). It suggests at least 0.618 AB-CD down. And this target is 1050$. This pattern could take shape of butterfly, if it will proceed to 1.618 target.
On recent week market has shown solid upside action. If it will continue in the same manner, then monthly grabber will fail probably. Somehow we think that market tends to YPP@1237. If this is indeed so, then grabber probably will fail…
At the same time, returning back to discussion of recent NFP release, the major driving factor for Gold is inflation and particularly here US economy has problem. Wages again have contracted for 0.2%. Accompanied by positive NFP numbers increasing chances on sooner rate hiking will be negative combination for gold. That’s why currently we do not see reasons yet to cancel our 1050$ target. Analysts of different big banks also think that gold will remain under pressure in the first half of 2015 and announce close targets around 1000-1100$. Meantime we do not exclude current upside retracement, when market could test YPP or even move slightly higher. But this possible rally does not cancel yet chances on later downward turnover. Seasonal bullish trend will finish within 1 month or so. Then we will see how situation will start to change.

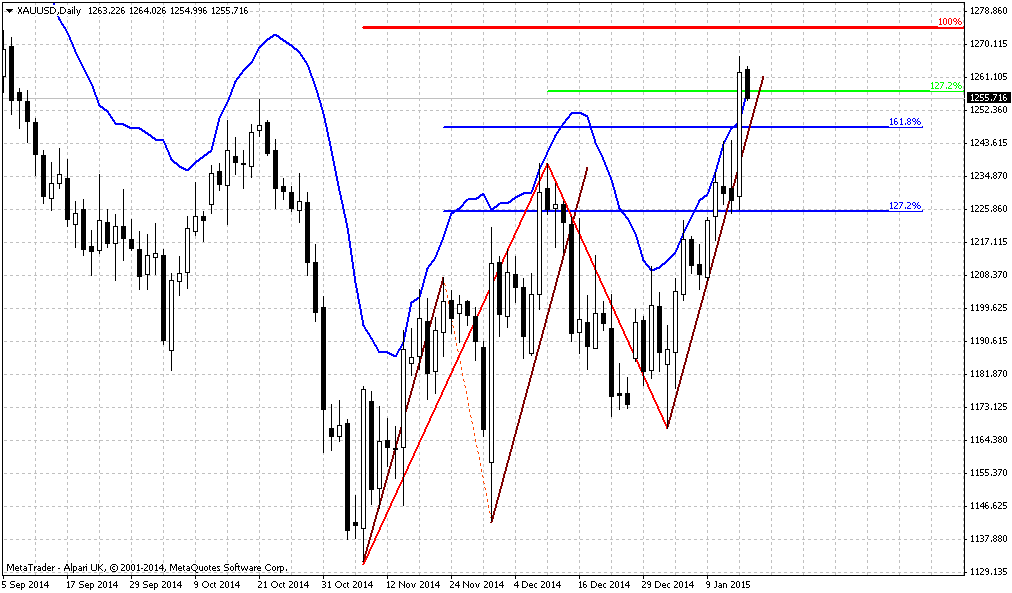
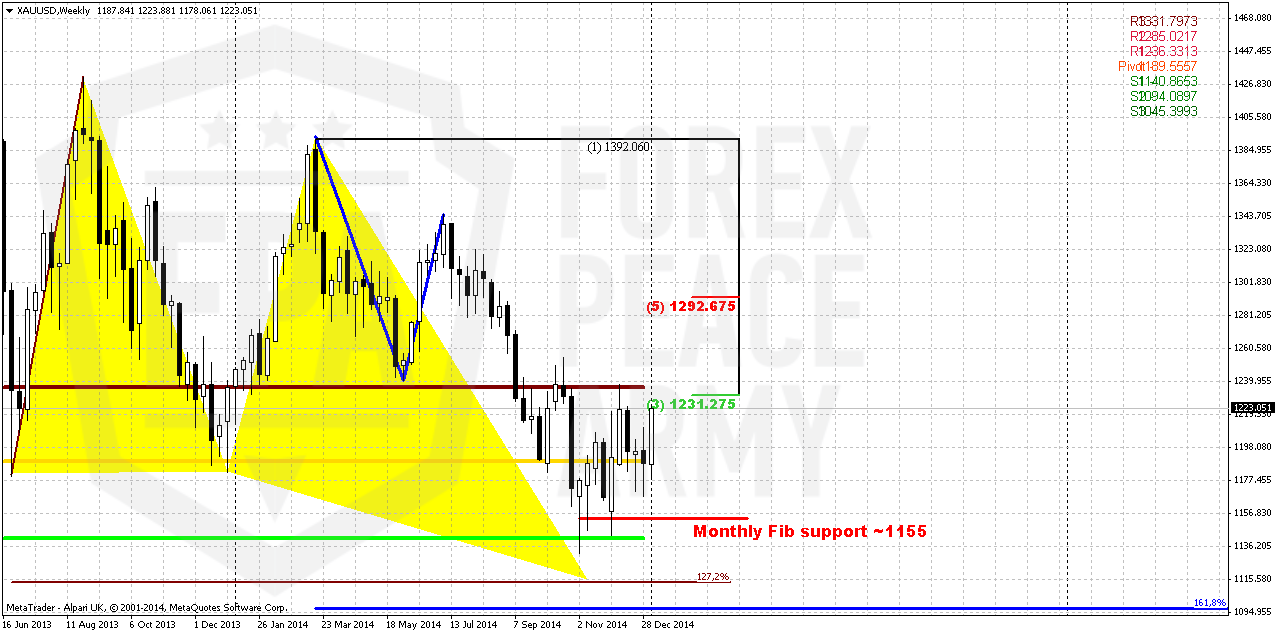
Weekly
Weekly charts mostly shows warning to us in relation to current upside price action. First of all, upside action does not look as impulse upside action, as reversal. Mostly it reminds retracement up.
Initial reaction of AB=CD completion point and monthly Agreement now looks not as impressive as previously. It is slowed and become more choppy with long shadows as to upside as to downside. Taking into consideration recent fundamental data and existence of untouched butterfly and 1.618 AB-CD targets, downward continuation seems not impossible. That’s being said, when market reaches significant support area but reaction on this event is mild – logically to suggest possible further downward continuation. This is one of the reasons why we think that it is too early to refuse our bearish targets.
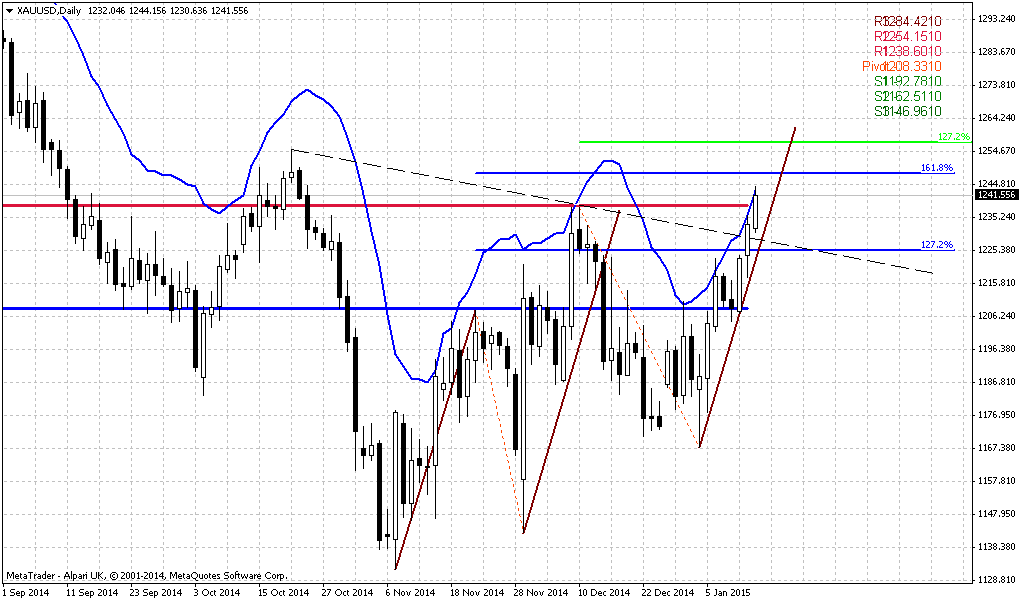
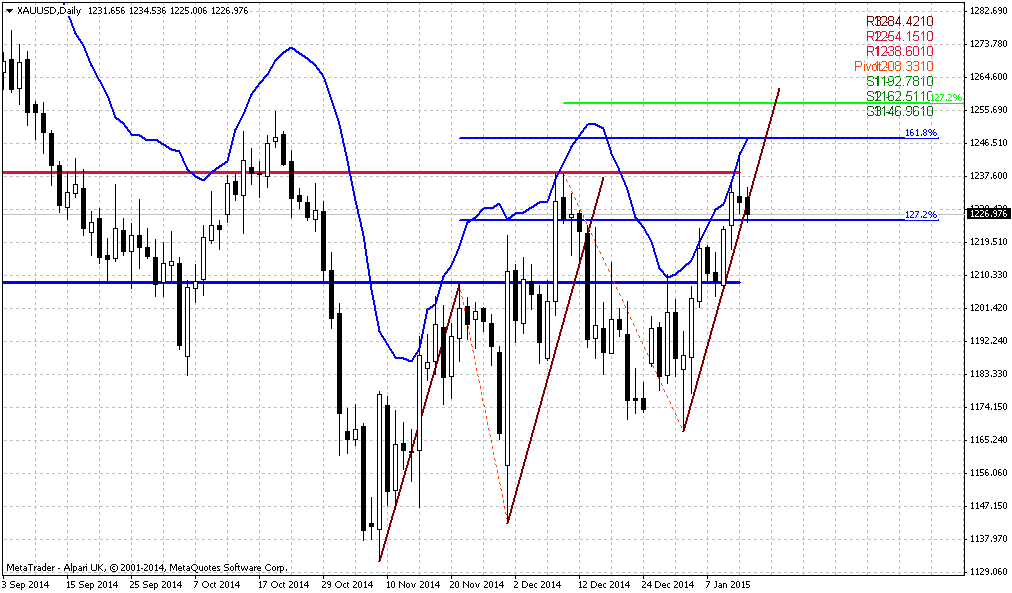
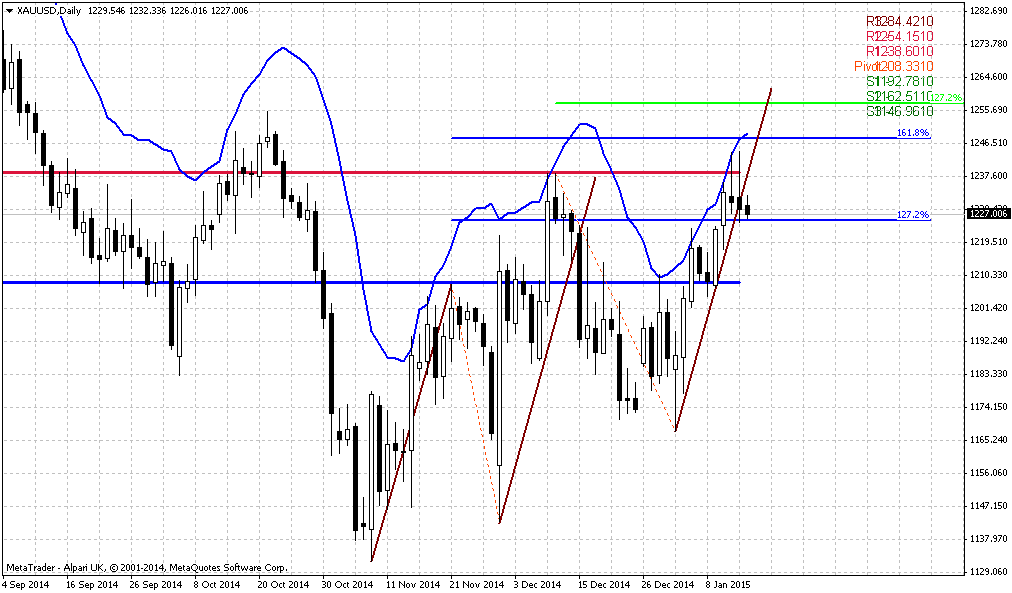
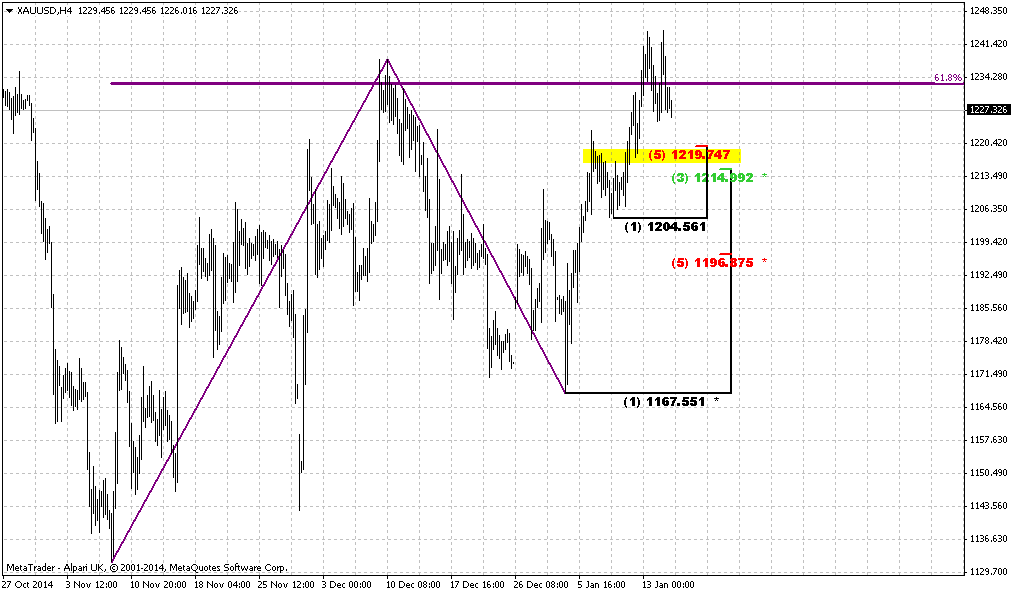
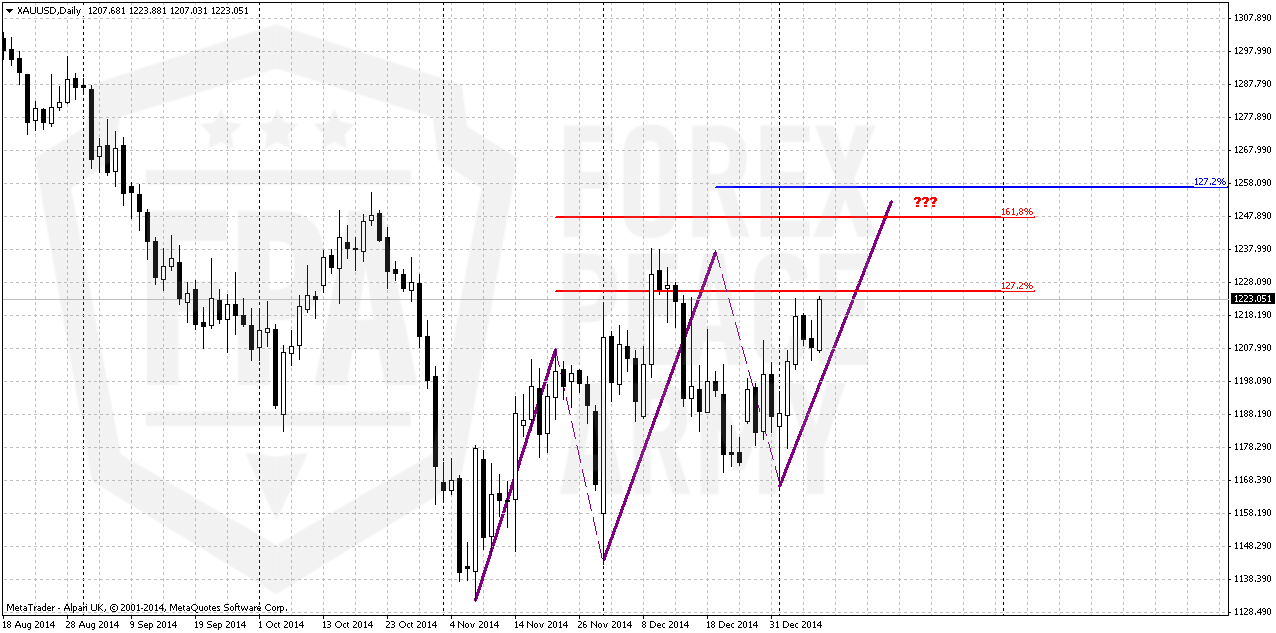
Daily
Today guys, I will not show you here H&S pattern that we already know well. Weekly chart puts me to one thought and I will draw it here. This choppy action as we’ve said mostly looks like retracement. Hence this upside action might be temporal. We have some other reasons that point on this, right? Current price action holds ratios of 3-Drive very well. It means that market could finish upside action around 1240-1245 area. It will test YPP, MPR1, also will complete AB=CD target of H&S and 1.618 target of initial H&S AB-CD pattern. Simultaneously 3-Drive pattern could become reversal one for downward gold continuation and will answer on question why gold is growing but physical demand is not…
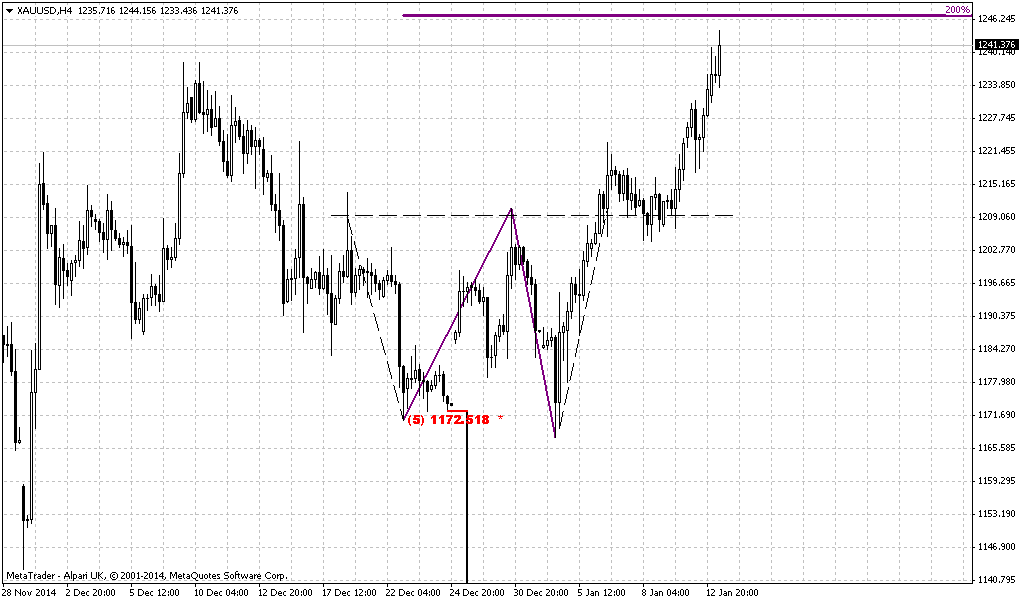
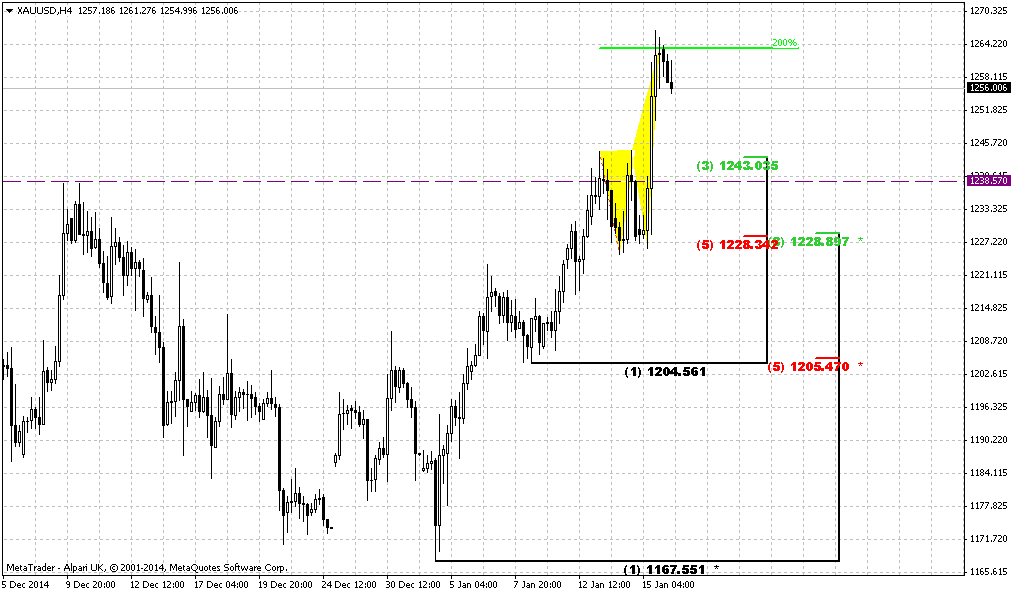
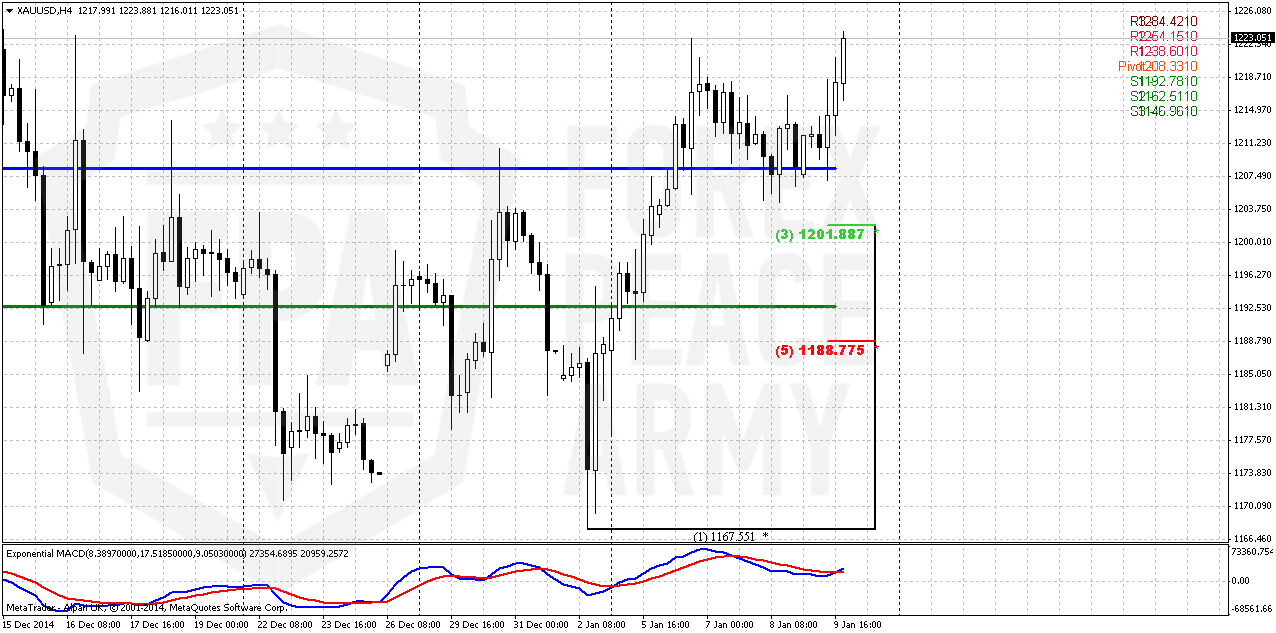
4-hour
4-hour chart shows perfect bullish action. As we’ve talked – to keep bullish setup it is preferable to see that retracement will be shy, only to re-test neckline of double bottom. This has happened. Right now market turns to upside again. Gold is not overbought on daily chart, so it has space to move up further. Still we have neckline of daily H&S around 1230 accompanied by daily overbought. This probably will be next short-term destination on gold market.
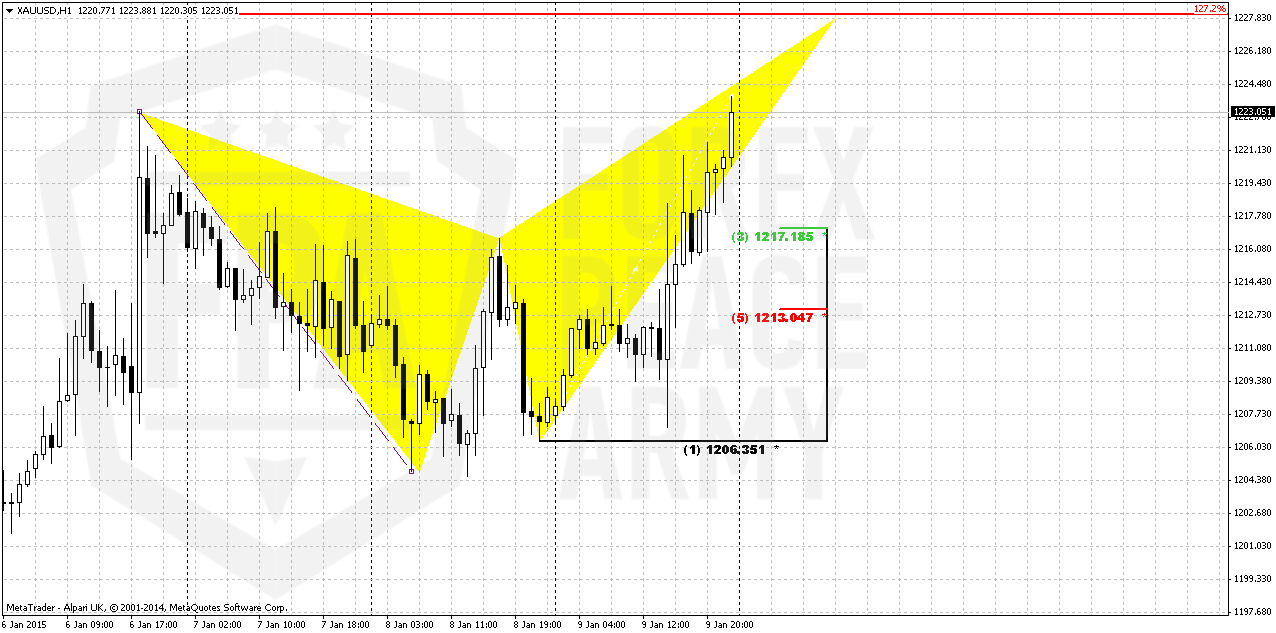
Hourly
Action to neckline at 1230 could take shape of butterfly. As major retracement down already has happened market probably should move directly to neckline and any retracement will be small. Thus, if you would like to take long position, better to watch for 1217 Fib level.
Conclusion:
Since market still keeps normal bearish tendency we should not refuse our 1050 target yet. Recent data shows some chill out in further upside sentiment. Currently it is not quite clear whether the reason is just end of the year and Xmas or really something is changing in big sentiment. Recent data suggests that first variant is more probable by far. Technical picture also does not look rock hard bullish. January will probably clarify some moments.
In short-term perspective market points on possible action to 1230 first, but may be even to YPP around 1240-1250 area in perspective. At the same time this action currently mostly look as 3-Drive pattern that could point on reversal nature of it.
The technical portion of Sive's analysis owes a great deal to Joe DiNapoli's methods, and uses a number of Joe's proprietary indicators. Please note that Sive's analysis is his own view of the market and is not endorsed by Joe DiNapoli or any related companies.
Weekly Gold Tading Report prepared by Sive Morten exclusively for ForexPeaceArmy.com
Reuters reports, Gold rose on Friday as the dollar and equities failed to react to a better-than-forecast U.S. jobs report, and the metal was set for the first weekly gain in four weeks as political uncertainty in Greece boosted demand for assets seen as safe.
Spot prices were heading for a 2.5 percent weekly gain, snapping a three-week losing streak, mostly due to global equities slumping at the start of the week on worries over developments in Greece that could see it quitting the euro.
Despite recent improvements in the job market, investors remained focused on the fact that the minutes of the Federal Reserve's latest policy meeting released on Wednesday indicated the U.S. central bank would be patient in raising interest rates due to low inflation expectations.
"Fed doves are happy to wait until they feel inflation's rapier at the tip of their breastbone, rather than just seeing the whites of their eyes," said Tai Wong, director of base and precious metals trading for BMO Capital Markets in New York.
Boston Fed President Eric Rosengren highlighted the Fed's cautious stance, saying it can likely be patient not only on the timing of the first rate hike but also on subsequent increases.
Gold is supported in this tight $1,200/$1,230 range because people are still a bit worried that with low inflationary pressures the Fed will not hike interest rates so soon," ABN Amro analyst Georgette Boele said.
In the physical markets, demand from China has been strong in recent weeks in the build-up to the Lunar New Year holiday in February, when gold is bought for gift-giving.
Premiums on the Shanghai Gold Exchange were hovering between $5 and $6 on Friday over the global benchmark, indicating strong buying interest.
Finally CFTC data starts to give some information. Recent data shows shy increase in open interest, but take a look – this open interest grows mostly due long position, but not short… Interesting. So, it seems that upside action still is getting some support from purchases. Now we need to get respond from SPDR fund – it should either confirm it or… this upside action will fade soon and CFTC data will change. At the same time we need to say that total investors’ positions are small.
Here is detailed breakdown of speculative positions:
Open interest:
Also guys, I want to share with you on rumors that have appeared around CME. Rumors tell that CME has adopted new trading rule that put more limitations on single day price changing on gold options and futures:
http://www.cmegroup.com/content/dam...ion/lookups/advisories/ser/files/SER-7258.pdf
It raises some questions. Most radical traders think that CME is preparing to unprecedented gold rally and tries to insure and protect itself in advance. Personally I’ve not studied this document with scrutiny yet, but probably I will have to do it soon. It will be great if you will take a look at it and share with your opinion on forum.
Technicals
Monthly
As New Year has started we’ve got some new inputs on monthly chart. Thus, we’ve got new yearly pivots. Most important thing here is shifting up of YPS1. In 2014 it stand at 1020, while in 2015 it stands at 1082$. This is very close to our ultimate 1050 target and in fact coincides with 1.618 butterfly target on monthly chart.
Second important issue – we’ve got bearish grabber on monthly chart as result of December close. I do not know how to match it with worries on new CME regulation act, but this is just a rumor yet and it is possible that this rumor is overestimated. But grabber is a pattern that we have in place. Still they do not contradict to each other, because market could reach lower targets first and only after that turn to upside rally…
Here we still have last big pattern in progress that is Volatility breakout (VOB). It suggests at least 0.618 AB-CD down. And this target is 1050$. This pattern could take shape of butterfly, if it will proceed to 1.618 target.
On recent week market has shown solid upside action. If it will continue in the same manner, then monthly grabber will fail probably. Somehow we think that market tends to YPP@1237. If this is indeed so, then grabber probably will fail…
At the same time, returning back to discussion of recent NFP release, the major driving factor for Gold is inflation and particularly here US economy has problem. Wages again have contracted for 0.2%. Accompanied by positive NFP numbers increasing chances on sooner rate hiking will be negative combination for gold. That’s why currently we do not see reasons yet to cancel our 1050$ target. Analysts of different big banks also think that gold will remain under pressure in the first half of 2015 and announce close targets around 1000-1100$. Meantime we do not exclude current upside retracement, when market could test YPP or even move slightly higher. But this possible rally does not cancel yet chances on later downward turnover. Seasonal bullish trend will finish within 1 month or so. Then we will see how situation will start to change.
Weekly
Weekly charts mostly shows warning to us in relation to current upside price action. First of all, upside action does not look as impulse upside action, as reversal. Mostly it reminds retracement up.
Initial reaction of AB=CD completion point and monthly Agreement now looks not as impressive as previously. It is slowed and become more choppy with long shadows as to upside as to downside. Taking into consideration recent fundamental data and existence of untouched butterfly and 1.618 AB-CD targets, downward continuation seems not impossible. That’s being said, when market reaches significant support area but reaction on this event is mild – logically to suggest possible further downward continuation. This is one of the reasons why we think that it is too early to refuse our bearish targets.
Daily
Today guys, I will not show you here H&S pattern that we already know well. Weekly chart puts me to one thought and I will draw it here. This choppy action as we’ve said mostly looks like retracement. Hence this upside action might be temporal. We have some other reasons that point on this, right? Current price action holds ratios of 3-Drive very well. It means that market could finish upside action around 1240-1245 area. It will test YPP, MPR1, also will complete AB=CD target of H&S and 1.618 target of initial H&S AB-CD pattern. Simultaneously 3-Drive pattern could become reversal one for downward gold continuation and will answer on question why gold is growing but physical demand is not…
4-hour
4-hour chart shows perfect bullish action. As we’ve talked – to keep bullish setup it is preferable to see that retracement will be shy, only to re-test neckline of double bottom. This has happened. Right now market turns to upside again. Gold is not overbought on daily chart, so it has space to move up further. Still we have neckline of daily H&S around 1230 accompanied by daily overbought. This probably will be next short-term destination on gold market.
Hourly
Action to neckline at 1230 could take shape of butterfly. As major retracement down already has happened market probably should move directly to neckline and any retracement will be small. Thus, if you would like to take long position, better to watch for 1217 Fib level.
Conclusion:
Since market still keeps normal bearish tendency we should not refuse our 1050 target yet. Recent data shows some chill out in further upside sentiment. Currently it is not quite clear whether the reason is just end of the year and Xmas or really something is changing in big sentiment. Recent data suggests that first variant is more probable by far. Technical picture also does not look rock hard bullish. January will probably clarify some moments.
In short-term perspective market points on possible action to 1230 first, but may be even to YPP around 1240-1250 area in perspective. At the same time this action currently mostly look as 3-Drive pattern that could point on reversal nature of it.
The technical portion of Sive's analysis owes a great deal to Joe DiNapoli's methods, and uses a number of Joe's proprietary indicators. Please note that Sive's analysis is his own view of the market and is not endorsed by Joe DiNapoli or any related companies.