Sive Morten
Special Consultant to the FPA
- Messages
- 18,695
Fundamentals
Weekly Gold Tading Report prepared by Sive Morten exclusively for ForexPeaceArmy.com
Reuters reports, Gold rose to a four-month high on Friday and was set to increase 4.5 percent for the week, its biggest weekly gain since August 2013, as investors sought safety from volatility in wider markets after Switzerland unexpectedly abandoned a cap on the franc.
Gold's move higher came despite a dollar up 0.5 percent against a basket of major currencies, which would normally limit gains by the metal.
"The SNB announcement has added a bit of an extra juice to the gold story but from an interest rates and equity perspective it looks like there is a more solid foundation to its strength," Deutsche Bank analyst Michael Lewis said.
Global shares steadied after Thursday's volatility, while the yield on the benchmark 10-year U.S. Treasury remained near its lowest since May 2013. Low yields reduce the cost of holding non-interest bearing gold.
Dealers assumed that the SNB had moved with the knowledge that the European Central Bank would take the plunge into full scale quantitative easing at its policy meeting on Jan. 22.
We are not going to have a huge ramp-up in short-term interest rates from the Federal Reserve and the market is trying to price in the possibility of QE by the ECB," said Bart Melek, head of global commodity strategy for TD Securities in Toronto, referencing quantitative easing and the European Central Bank.
In a reflection of improving investor confidence, holdings of the SPDR Gold Trust , the world's largest gold-backed exchange-traded fund, rose 1.35 percent to 717.15 tonnes on Thursday.
Physical demand, however, suffered a setback with the higher prices putting off buyers in Asia. Premiums on the Shanghai Gold Exchange fell to $1 to $2 an ounce over the global benchmark, from about $3 to $4 in the previous session, indicating softer demand.
Recent CFTC data confirms structural changes in market sentiment. Open interest has started to grow and it’s increasing stands due growing of long speculative positions but not short. Recall that before New Year picture was opposite – shorts have grown faster and then they were closed massively right at the end of 2014.
Right now investors are returning back to market, but on opposite side. SPDR Fund also has shown solid growth of storages ~1.5%. This is not small growth. Average weekly change stands for 0.5-0.8% and only when something happens on market storage could change faster.
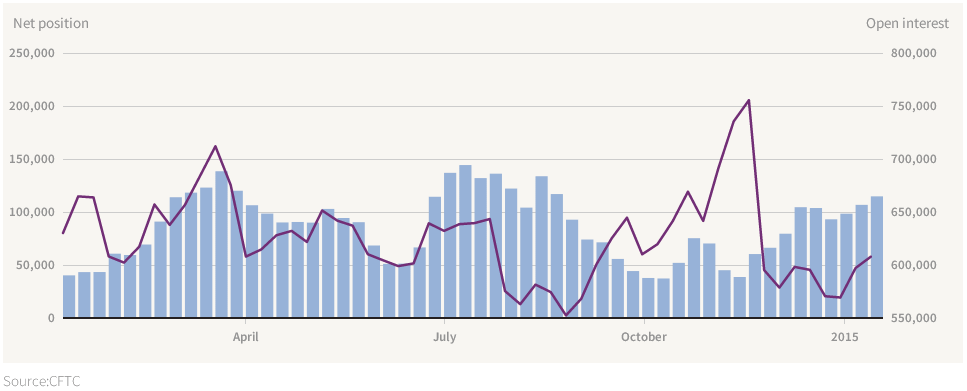
Here is detailed breakdown of speculative positions:
Open interest:
 Shorts:
 Longs:

Also guys, I keep here previous information on rumors that have appeared around CME. Rumors tell that CME has adopted new trading rule that put more limitations on single day price changing on gold options and futures:
http://www.cmegroup.com/content/dam...ion/lookups/advisories/ser/files/SER-7258.pdf
It raises some questions. Most radical traders think that CME is preparing to unprecedented gold rally and tries to insure and protect itself in advance. Personally I’ve not studied this document with scrutiny yet, but probably I will have to do it soon. It will be great if you will take a look at it and share with your opinion on forum.
Technicals
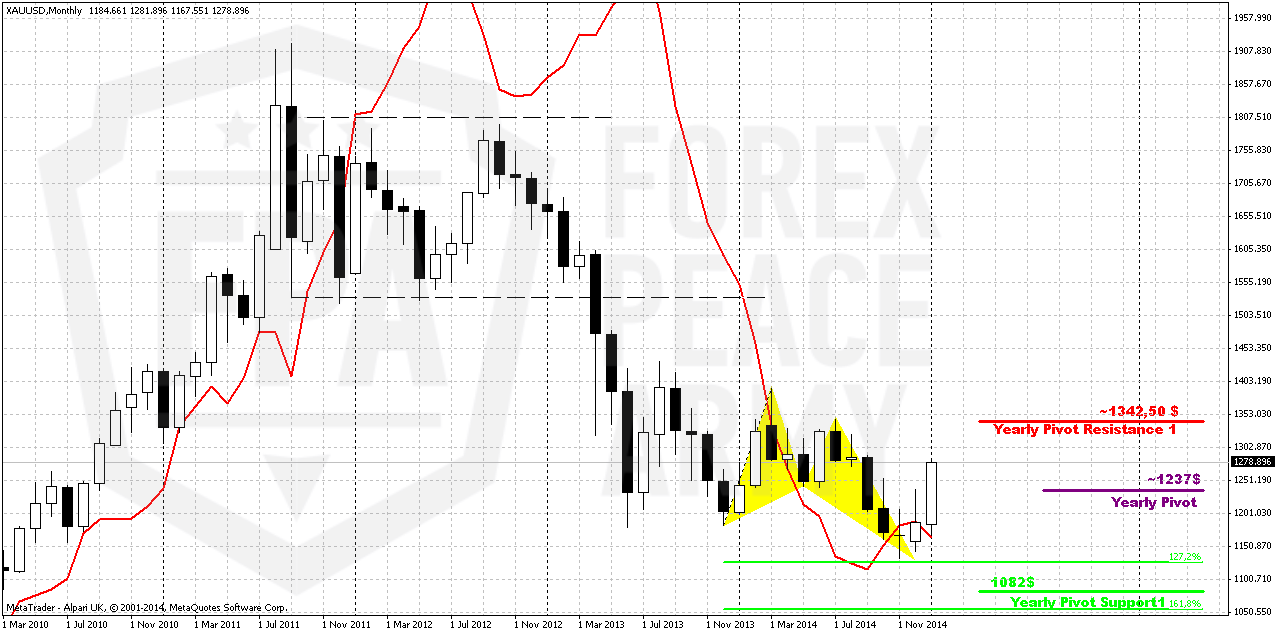
Monthly
As New Year has started we’ve got some new inputs on monthly chart. Thus, we’ve got new yearly pivots. Most important thing here is shifting up of YPS1. In 2014 it was stand at 1020, while in 2015 it stands at 1082$. This is very close to our ultimate 1050 target and in fact coincides with 1.618 butterfly target on monthly chart.
Second important issue – previously we’ve got bearish grabber on monthly chart as result of December close, but right now it is totally overcome by recent January action.
Here we still have last big pattern in progress that is Volatility breakout (VOB). It suggests at least 0.618 AB-CD down. And this target is 1050$. This pattern could take shape of butterfly, if it will proceed to 1.618 target.
On recent week market has shown solid upside action. Market right now not just exceeds yearly pivot, but passed half way to Yearly Pivot resistance 1 @ 1342,50.
At the same time, returning back to discussion of recent NFP release, the major driving factor for Gold is inflation and particularly here US economy has problem. Wages again have contracted for 0.2%. Accompanied by positive NFP numbers increasing chances on sooner rate hiking will be negative combination for gold. That’s why currently we do not see reasons yet to cancel our 1050$ target. Analysts of different big banks also think that gold will remain under pressure in the first half of 2015 and announce close targets around 1000-1100$. Meantime we do not exclude current upside retracement. But this possible rally does not cancel yet chances on later downward turnover. Seasonal bullish trend will finish within 1 month or so. Then we will see how situation will start to change.
Still, we would suggest you to read our recent weekly research on Forex markets. If we will take into consideration geopolitical situation and risks that have appeared recently, it could happen that current upside action could become not just retracement but real reversal and changing in global sentiment and risk assessment. Because even technically we have reversal pattern at place on monthly chart – 1.27 Butterfly...Trend probably will turn bullish here by the end of January.
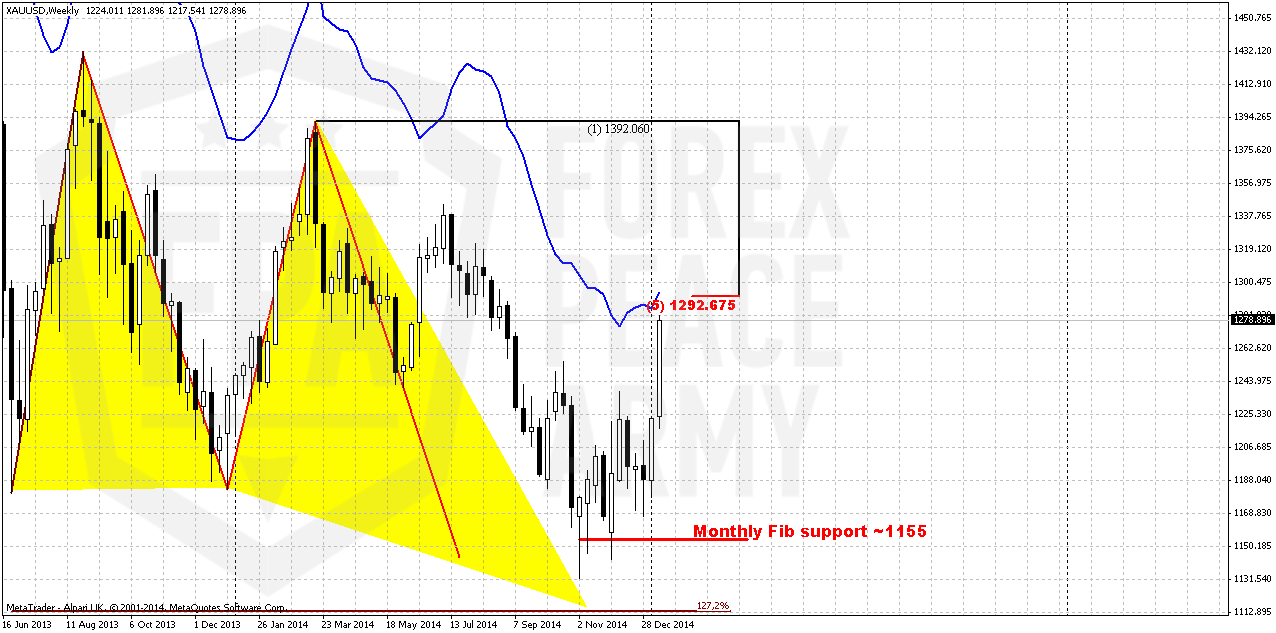
Weekly
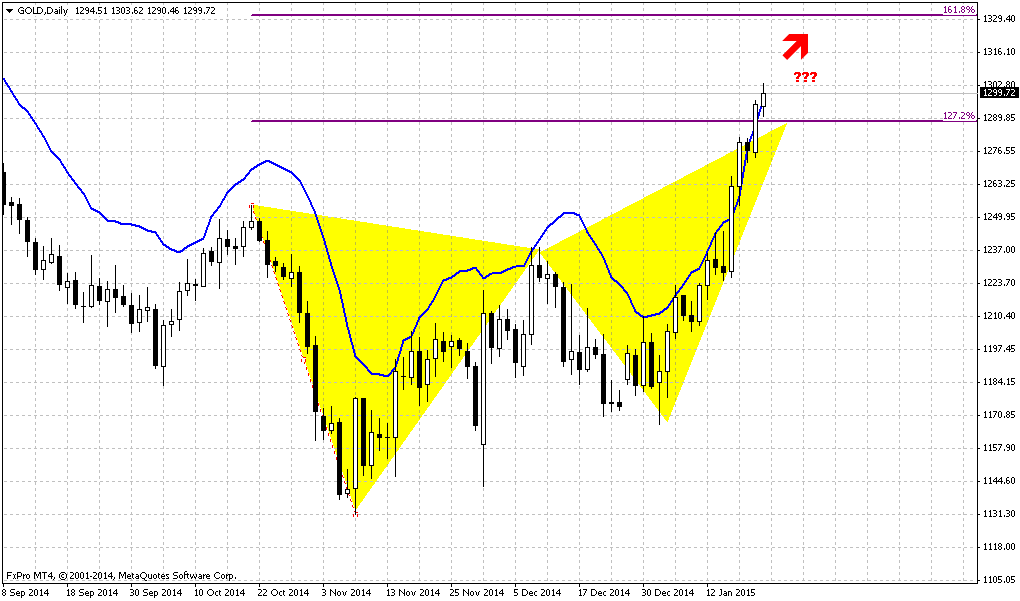
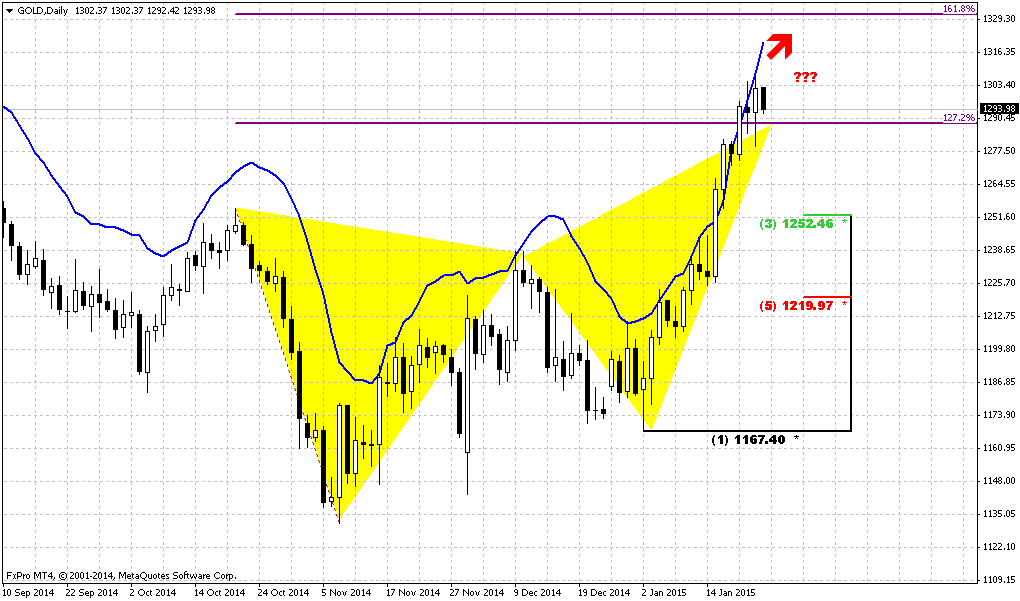
One of our doubts that previously stand on weekly chart was lack of impulse character in upside action. In recent two weeks gold really has turned to acceleration. Right now market has passed through all monthly pivots and comes very close to weekly overbought and 1292 Fib resistance. So, here market has limited upside potential on coming week.
Last concern that we have here is no quite completed butterfly target. We have completion of AB=CD, but market has not touched 1.27 butterfly target. Currently very difficult to expect soon return down, taking into consideration fast upside action. Although we always point on risk of existing untouched targets, current situation could be different and it is possible that not quite completed important pattern and the way how market has turned up, very fast reversal could be a sign of structural changes in sentiment. We will see.. Still, on coming week most probable action is upside continuation and reaching 1292 resistance and then some retracement down.
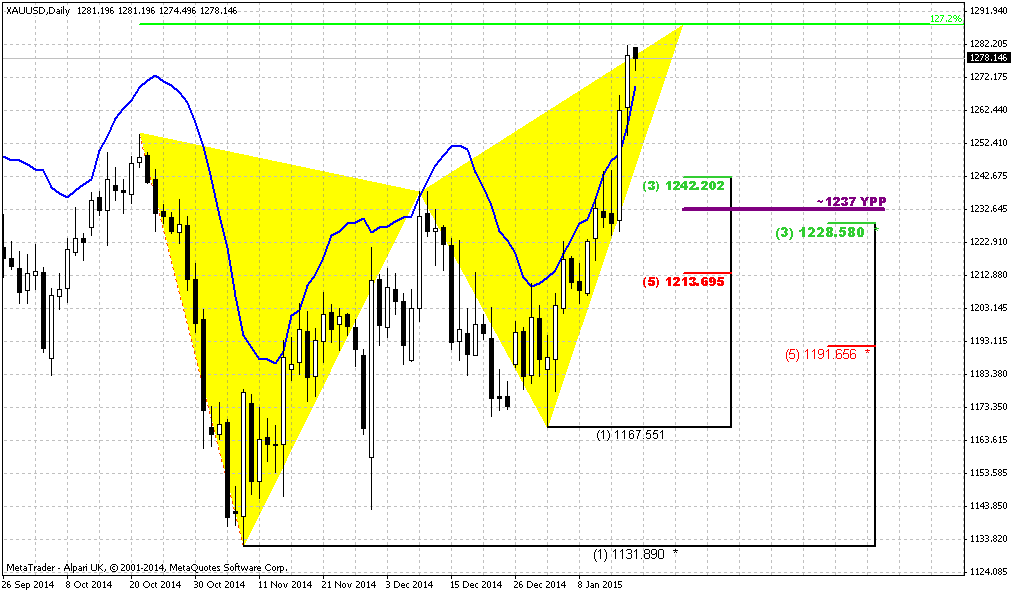
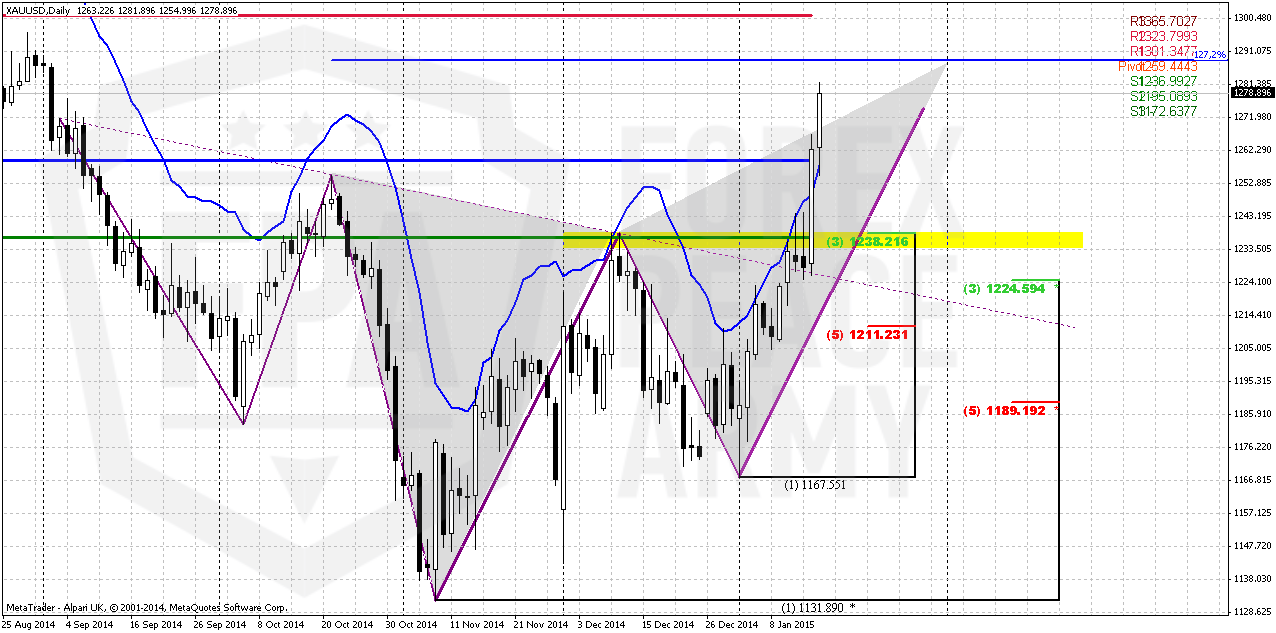
Daily
Here we see all beauty of thrust up. Market has exceeded all reversal extensions and patterns that we had – initial 1.618 AB-CD, most recent AB-CD, minimum H&S target – also AB=CD based on the head. Our 3-Drive pattern has failed as market has passed through its completion point. Market moves deeply overbought area, although this is normal for commodities markets. They could stay overbought for long period. Pay attention that most recent CD leg is faster than AB. It means that not bad chances exist on further upside continuation after some retracement.
On coming week we mostly will be watch for Butterfly pattern. As we’ve said – market stands very close to weekly resistance, Butterfly has the same target – around 1291 area. So despite daily overbought gold could try to reach this area and only after that will start retracement down.
Anyway most probable destination of retracement will stand around 1238 support – this is Fib level, Yearly Pivot point, WPS1 and former top.
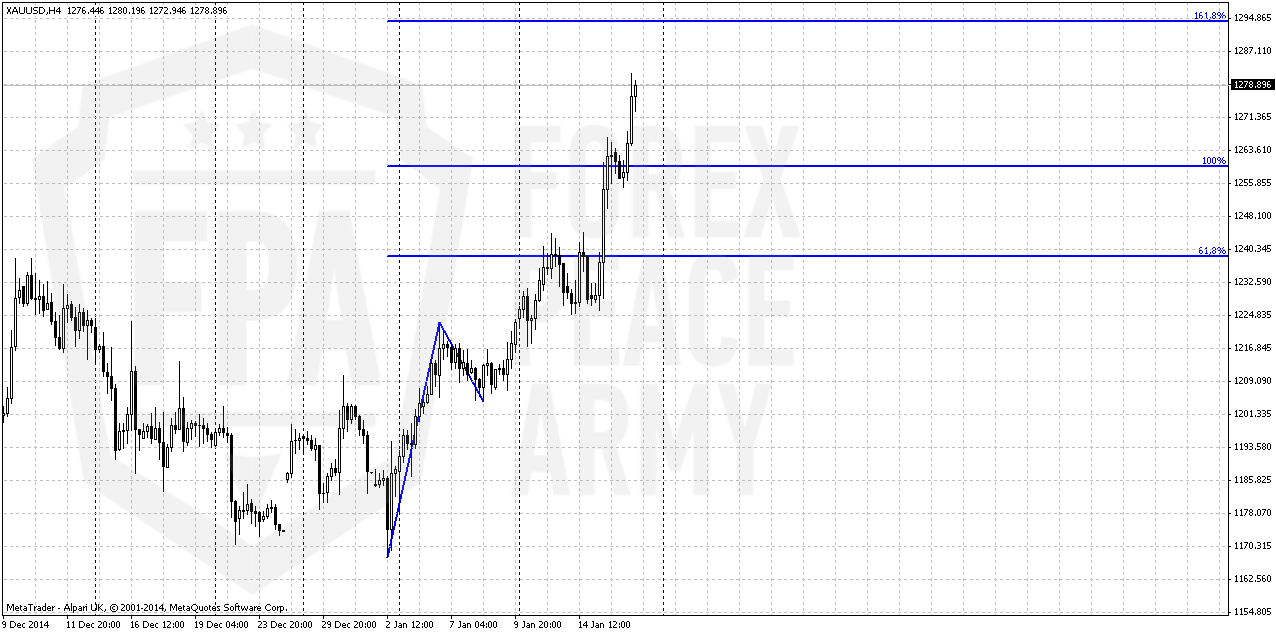
4-hour
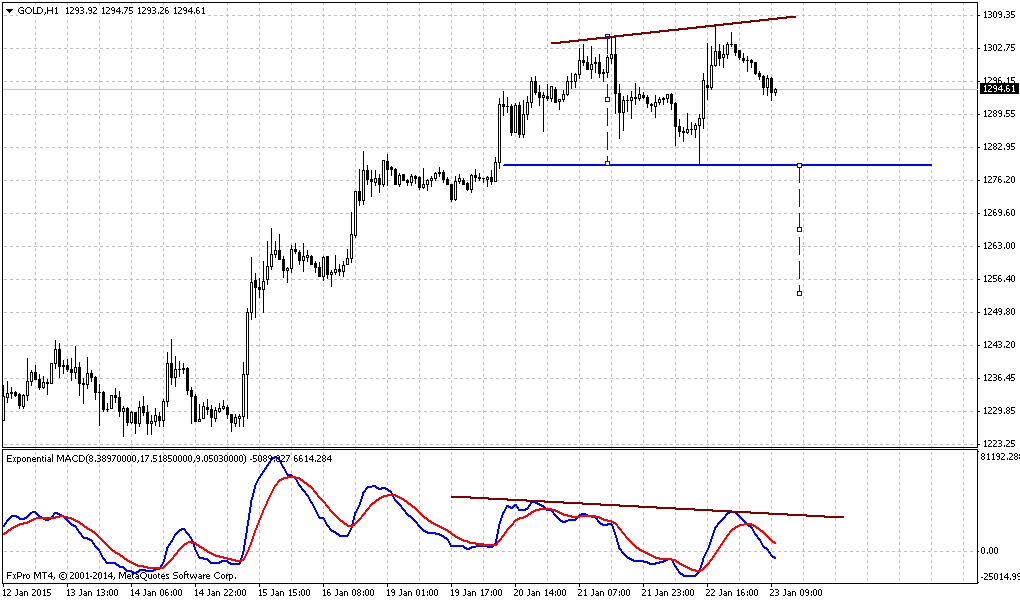
4-hour chart shows another minor AB-CD with 1.618 extension approximately in the same area. We do not have any reversal patterns here yet. It is interesting how market reacts on 0.618 target first, then on 1.0 target – now is turn of 1.618 probably.
Conclusion:
From technical point of view we has no reasons yet to abandon 1080$ target. Theoretical chances exist that market could reach it. But right now technical factors are not dominating ones. Taking into consideration the way how gold moves, CFTC data that shows different trend in positions we think that major factors are geopolitical and fundamental. They will come on surface probably when they will be totally utilized by institutional investors and become not as important as they stand now. We’ve described our opinion and view on this topic in current Forex weekly research. Shortly speaking we suspect that current action could be not just retracement and indicates global shifts in sentiment of investors who start to feel some tension and growing risk.
In short-term perspective we expect shy upside continuation in 1290 area and then retracement down. Most probable target of retracement is 1237 area where Yearly Pivot Point stands.
The technical portion of Sive's analysis owes a great deal to Joe DiNapoli's methods, and uses a number of Joe's proprietary indicators. Please note that Sive's analysis is his own view of the market and is not endorsed by Joe DiNapoli or any related companies.
Weekly Gold Tading Report prepared by Sive Morten exclusively for ForexPeaceArmy.com
Reuters reports, Gold rose to a four-month high on Friday and was set to increase 4.5 percent for the week, its biggest weekly gain since August 2013, as investors sought safety from volatility in wider markets after Switzerland unexpectedly abandoned a cap on the franc.
Gold's move higher came despite a dollar up 0.5 percent against a basket of major currencies, which would normally limit gains by the metal.
"The SNB announcement has added a bit of an extra juice to the gold story but from an interest rates and equity perspective it looks like there is a more solid foundation to its strength," Deutsche Bank analyst Michael Lewis said.
Global shares steadied after Thursday's volatility, while the yield on the benchmark 10-year U.S. Treasury remained near its lowest since May 2013. Low yields reduce the cost of holding non-interest bearing gold.
Dealers assumed that the SNB had moved with the knowledge that the European Central Bank would take the plunge into full scale quantitative easing at its policy meeting on Jan. 22.
We are not going to have a huge ramp-up in short-term interest rates from the Federal Reserve and the market is trying to price in the possibility of QE by the ECB," said Bart Melek, head of global commodity strategy for TD Securities in Toronto, referencing quantitative easing and the European Central Bank.
In a reflection of improving investor confidence, holdings of the SPDR Gold Trust , the world's largest gold-backed exchange-traded fund, rose 1.35 percent to 717.15 tonnes on Thursday.
Physical demand, however, suffered a setback with the higher prices putting off buyers in Asia. Premiums on the Shanghai Gold Exchange fell to $1 to $2 an ounce over the global benchmark, from about $3 to $4 in the previous session, indicating softer demand.
Recent CFTC data confirms structural changes in market sentiment. Open interest has started to grow and it’s increasing stands due growing of long speculative positions but not short. Recall that before New Year picture was opposite – shorts have grown faster and then they were closed massively right at the end of 2014.
Right now investors are returning back to market, but on opposite side. SPDR Fund also has shown solid growth of storages ~1.5%. This is not small growth. Average weekly change stands for 0.5-0.8% and only when something happens on market storage could change faster.
Here is detailed breakdown of speculative positions:
Open interest:
Also guys, I keep here previous information on rumors that have appeared around CME. Rumors tell that CME has adopted new trading rule that put more limitations on single day price changing on gold options and futures:
http://www.cmegroup.com/content/dam...ion/lookups/advisories/ser/files/SER-7258.pdf
It raises some questions. Most radical traders think that CME is preparing to unprecedented gold rally and tries to insure and protect itself in advance. Personally I’ve not studied this document with scrutiny yet, but probably I will have to do it soon. It will be great if you will take a look at it and share with your opinion on forum.
Technicals
Monthly
As New Year has started we’ve got some new inputs on monthly chart. Thus, we’ve got new yearly pivots. Most important thing here is shifting up of YPS1. In 2014 it was stand at 1020, while in 2015 it stands at 1082$. This is very close to our ultimate 1050 target and in fact coincides with 1.618 butterfly target on monthly chart.
Second important issue – previously we’ve got bearish grabber on monthly chart as result of December close, but right now it is totally overcome by recent January action.
Here we still have last big pattern in progress that is Volatility breakout (VOB). It suggests at least 0.618 AB-CD down. And this target is 1050$. This pattern could take shape of butterfly, if it will proceed to 1.618 target.
On recent week market has shown solid upside action. Market right now not just exceeds yearly pivot, but passed half way to Yearly Pivot resistance 1 @ 1342,50.
At the same time, returning back to discussion of recent NFP release, the major driving factor for Gold is inflation and particularly here US economy has problem. Wages again have contracted for 0.2%. Accompanied by positive NFP numbers increasing chances on sooner rate hiking will be negative combination for gold. That’s why currently we do not see reasons yet to cancel our 1050$ target. Analysts of different big banks also think that gold will remain under pressure in the first half of 2015 and announce close targets around 1000-1100$. Meantime we do not exclude current upside retracement. But this possible rally does not cancel yet chances on later downward turnover. Seasonal bullish trend will finish within 1 month or so. Then we will see how situation will start to change.
Still, we would suggest you to read our recent weekly research on Forex markets. If we will take into consideration geopolitical situation and risks that have appeared recently, it could happen that current upside action could become not just retracement but real reversal and changing in global sentiment and risk assessment. Because even technically we have reversal pattern at place on monthly chart – 1.27 Butterfly...Trend probably will turn bullish here by the end of January.
Weekly
One of our doubts that previously stand on weekly chart was lack of impulse character in upside action. In recent two weeks gold really has turned to acceleration. Right now market has passed through all monthly pivots and comes very close to weekly overbought and 1292 Fib resistance. So, here market has limited upside potential on coming week.
Last concern that we have here is no quite completed butterfly target. We have completion of AB=CD, but market has not touched 1.27 butterfly target. Currently very difficult to expect soon return down, taking into consideration fast upside action. Although we always point on risk of existing untouched targets, current situation could be different and it is possible that not quite completed important pattern and the way how market has turned up, very fast reversal could be a sign of structural changes in sentiment. We will see.. Still, on coming week most probable action is upside continuation and reaching 1292 resistance and then some retracement down.
Daily
Here we see all beauty of thrust up. Market has exceeded all reversal extensions and patterns that we had – initial 1.618 AB-CD, most recent AB-CD, minimum H&S target – also AB=CD based on the head. Our 3-Drive pattern has failed as market has passed through its completion point. Market moves deeply overbought area, although this is normal for commodities markets. They could stay overbought for long period. Pay attention that most recent CD leg is faster than AB. It means that not bad chances exist on further upside continuation after some retracement.
On coming week we mostly will be watch for Butterfly pattern. As we’ve said – market stands very close to weekly resistance, Butterfly has the same target – around 1291 area. So despite daily overbought gold could try to reach this area and only after that will start retracement down.
Anyway most probable destination of retracement will stand around 1238 support – this is Fib level, Yearly Pivot point, WPS1 and former top.
4-hour
4-hour chart shows another minor AB-CD with 1.618 extension approximately in the same area. We do not have any reversal patterns here yet. It is interesting how market reacts on 0.618 target first, then on 1.0 target – now is turn of 1.618 probably.
Conclusion:
From technical point of view we has no reasons yet to abandon 1080$ target. Theoretical chances exist that market could reach it. But right now technical factors are not dominating ones. Taking into consideration the way how gold moves, CFTC data that shows different trend in positions we think that major factors are geopolitical and fundamental. They will come on surface probably when they will be totally utilized by institutional investors and become not as important as they stand now. We’ve described our opinion and view on this topic in current Forex weekly research. Shortly speaking we suspect that current action could be not just retracement and indicates global shifts in sentiment of investors who start to feel some tension and growing risk.
In short-term perspective we expect shy upside continuation in 1290 area and then retracement down. Most probable target of retracement is 1237 area where Yearly Pivot Point stands.
The technical portion of Sive's analysis owes a great deal to Joe DiNapoli's methods, and uses a number of Joe's proprietary indicators. Please note that Sive's analysis is his own view of the market and is not endorsed by Joe DiNapoli or any related companies.