Sive Morten
Special Consultant to the FPA
- Messages
- 18,695
Fundamentals
Weekly Gold Tading Report prepared by Sive Morten exclusively for ForexPeaceArmy.com
Reuters reports, Gold fell as much as 1.3 percent on Friday as the dollar rose and markets digested the mixed implications of a European Central Bank plan to pump about one trillion euros into the euro zone's flagging economy.
The metal, often seen as a hedge against inflation, jumped more than 1 percent above $1,300 an ounce on Thursday after the ECB announcement.
But with the euro hitting an 11-year low against the dollar , gold prices pared some of those gains as investors focused on the impact of the stronger U.S. currency, which makes dollar-denominated assets more expensive for investors holding other currencies.
"Gold was completely dislocated from the dollar yesterday, meaning that euro-gold is the best performing commodity this year, helping dollar gold stay fairly stable around $1,300," Saxo Bank's Ole Hansen said.
"But that strength in the dollar is now proving too much."
Goldman Sachs in a report seen by Reuters on Friday raised its 2015 gold price forecast to $1,262 per ounce from $1,200.
Traders are likely to turn to Sunday's election in Greece and next week's Federal Open Market Committee policy meeting for clues on the wider economic environment and when U.S. interest rates might rise.
The Fed is expected to repeat that global risks have yet to throw the U.S. recovery or its rate-hike plans off track despite the growing number of central banks cutting rates and ramping up stimulus.
"People are coming to the conclusion that while the ECB is getting more expansionary, the Fed may be forced to be less restrictive because of the headwinds to inflation from the drop in oil prices, which can trigger some delay in interest rate hikes and would be positive for gold," Julius Baer analyst Carsten Menke said.
Recent CFTC data confirms structural changes in market sentiment. Open interest has started to grow very fast and its increasing stands due growing of long speculative positions but not short. Recall that before New Year picture was opposite – shorts have grown faster and then they were closed massively right at the end of 2014.
Right now investors are returning back to market, but on opposite side. SPDR Fund also has shown solid growth of storages.
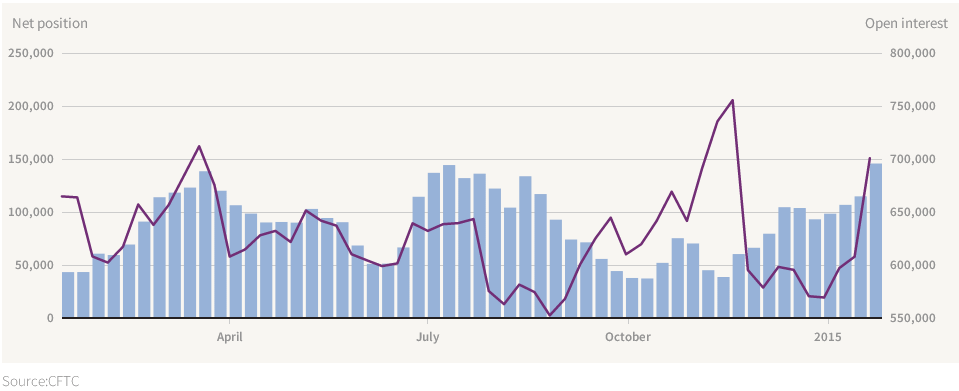
Here is detailed breakdown of speculative positions:
Open interest:
 Shorts:
 Longs:

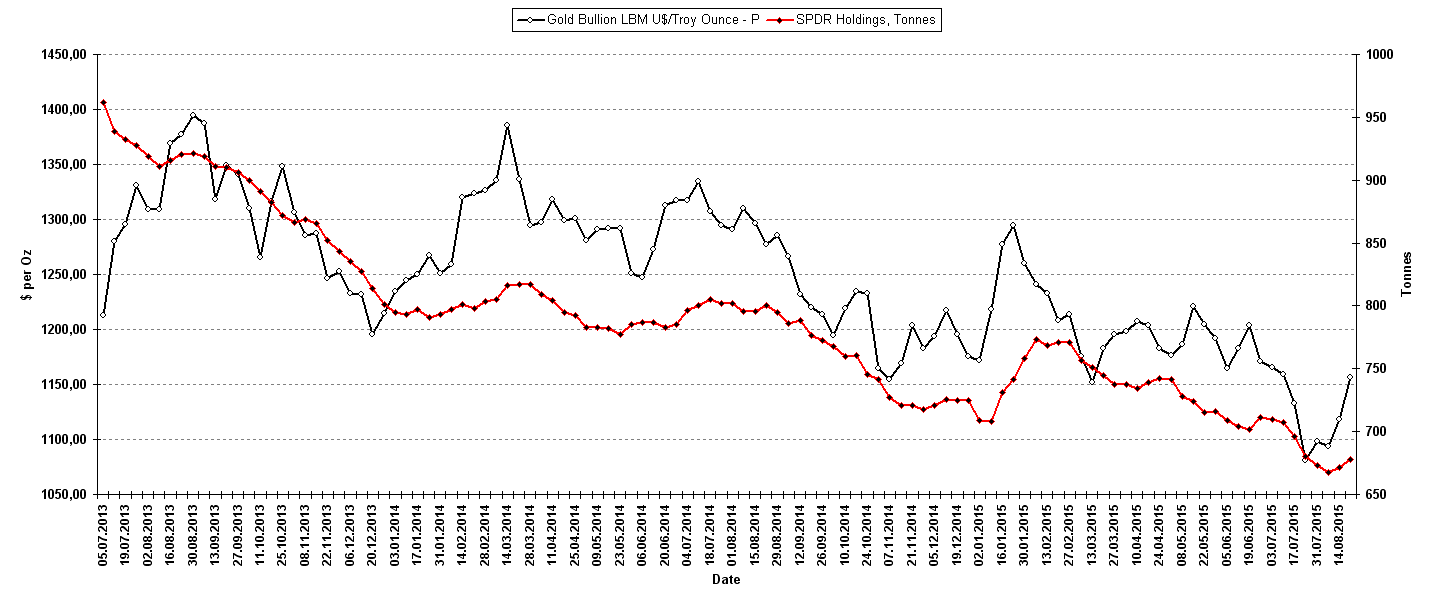
Finally, here is dynamic of SPDR Fund storages and gold price. Take a look that we have fast increasing of inflow in fund in recent 2 weeks. It creates bullish divergence with gold price. SPDR storages has formed reversal swing. So, accompanied by growth of net long position we could say, that gold dynamic is in fact new upside trend.
Technicals
Monthly
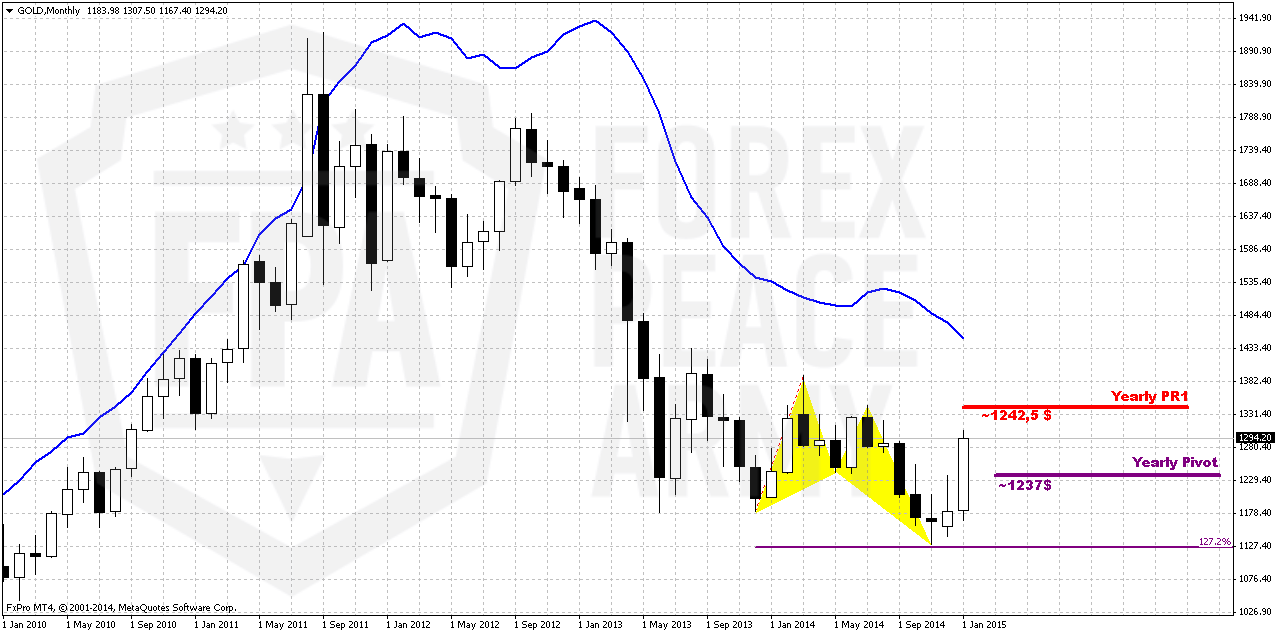
As New Year has started we’ve got some new inputs on monthly chart. Thus, we’ve got new yearly pivots.
Here we still have last big pattern in progress that is Volatility breakout (VOB). It suggests at least 0.618 AB-CD down. And this target is 1050$. This pattern could take shape of butterfly, if it will proceed to 1.618 target. Still, this is really big setup and current move down could be treated as BC leg. If this leg will exceed ~1433 area then we will need to adjust current AB-CD and we will get closer final destination point – may be no 1050, but 1080 or even 1100…
On recent week market has shown solid upside action. Market right now not just exceeds yearly pivot, but passed half way to Yearly Pivot resistance 1 @ 1342,50.
At the same time, returning back to discussion of recent NFP release, the major driving factor for Gold is inflation and particularly here US economy has problem. Wages again have contracted for 0.2%. Crude oil prices show decreasing. Accompanied by positive NFP numbers increasing chances on sooner rate hiking will be negative combination for gold. That’s why currently we do not see reasons yet to cancel our 1050$ target or at least possible big AB-CD down. Meantime we do not exclude current upside retracement. But this possible rally does not cancel yet chances on later downward turnover. The point is that lack of inflation, drop in oil and other commodities prices and applying of QE by other countries could let to US slightly postpone active phase of rate hiking. And this will be supportive for gold.
Still, we would suggest you to read our recent weekly research on Forex markets. If we will take into consideration geopolitical situation and risks that have appeared recently, it could happen that current upside action could become not just retracement but real reversal and changing in global sentiment and risk assessment. Because even technically we have reversal pattern at place on monthly chart – 1.27 Butterfly...Trend probably will turn bullish here by the end of January. Recent CFTC and SPDR data support this opinion.
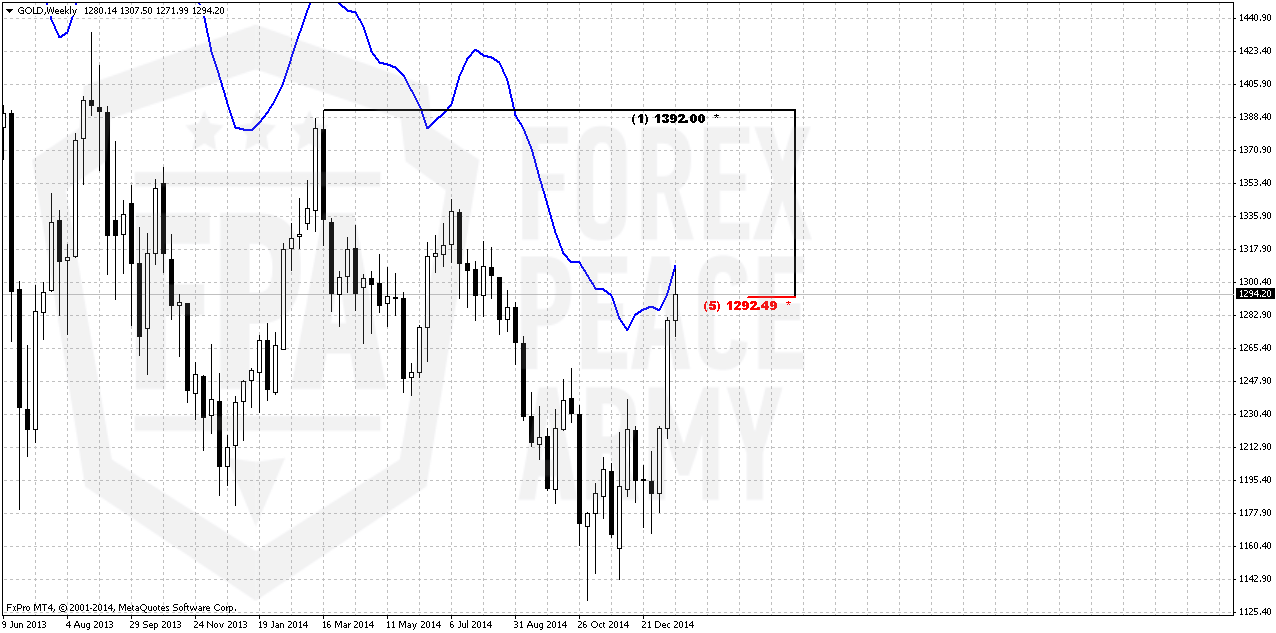
Weekly
One of our doubts that previously stand on weekly chart was lack of impulse character in upside action. In recent two weeks gold really has turned to acceleration. Right now market has passed through all monthly pivots and hit overbought at major Fib resistance. As we’ve said on previous week - here market has limited upside potential and looks like resistance holds market from further upside continuation.
In fact we’ve got DiNapoli bearish “Stretch” pattern that could be reason for short-term downward retracement.
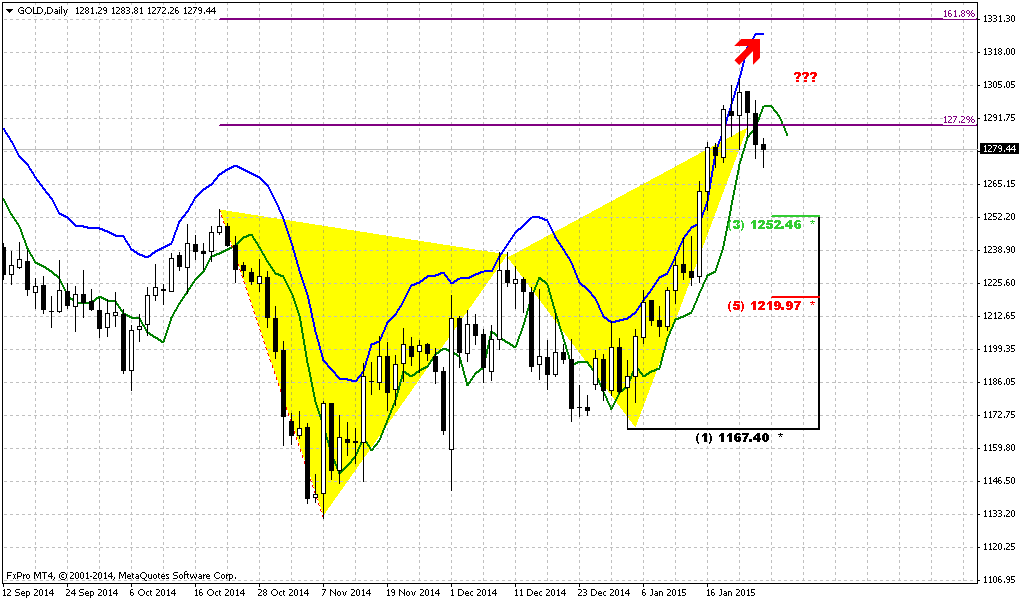
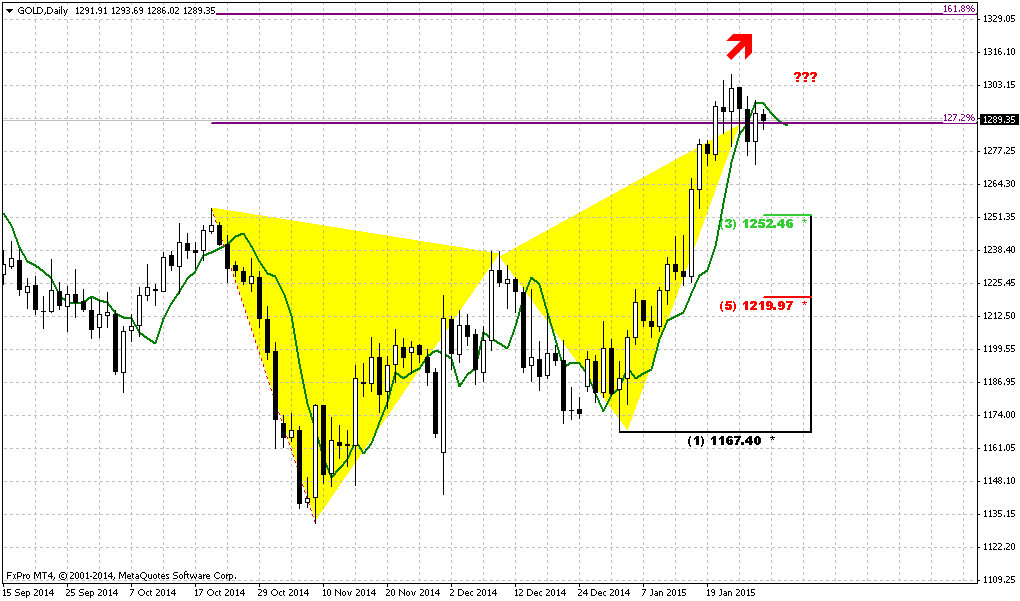
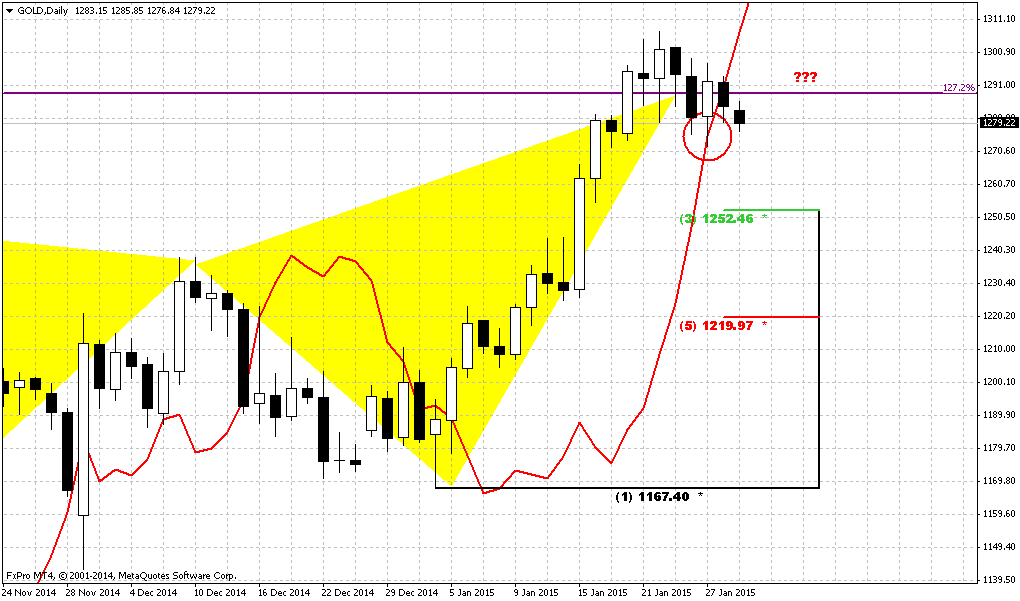
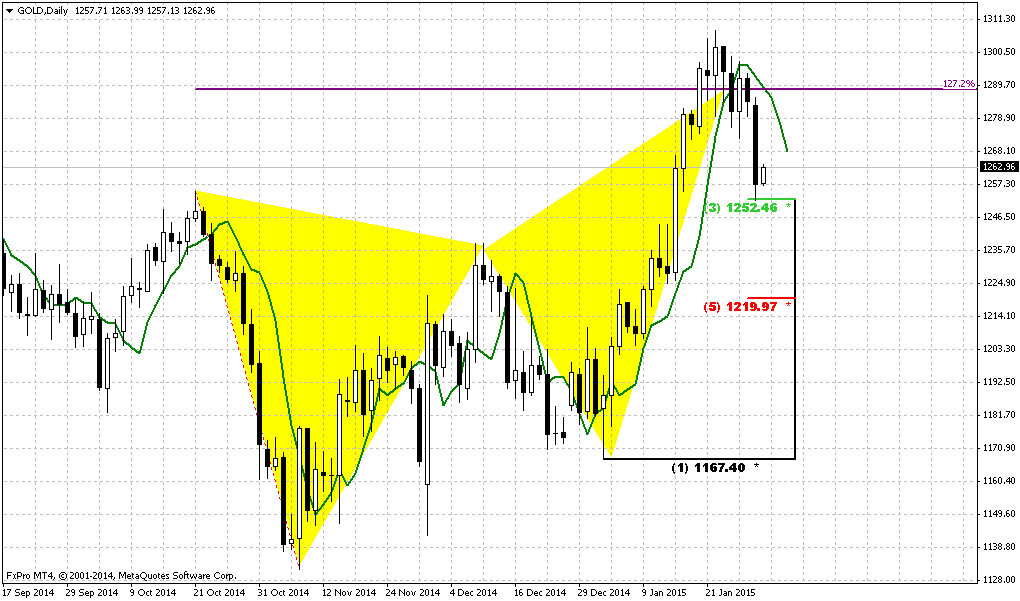
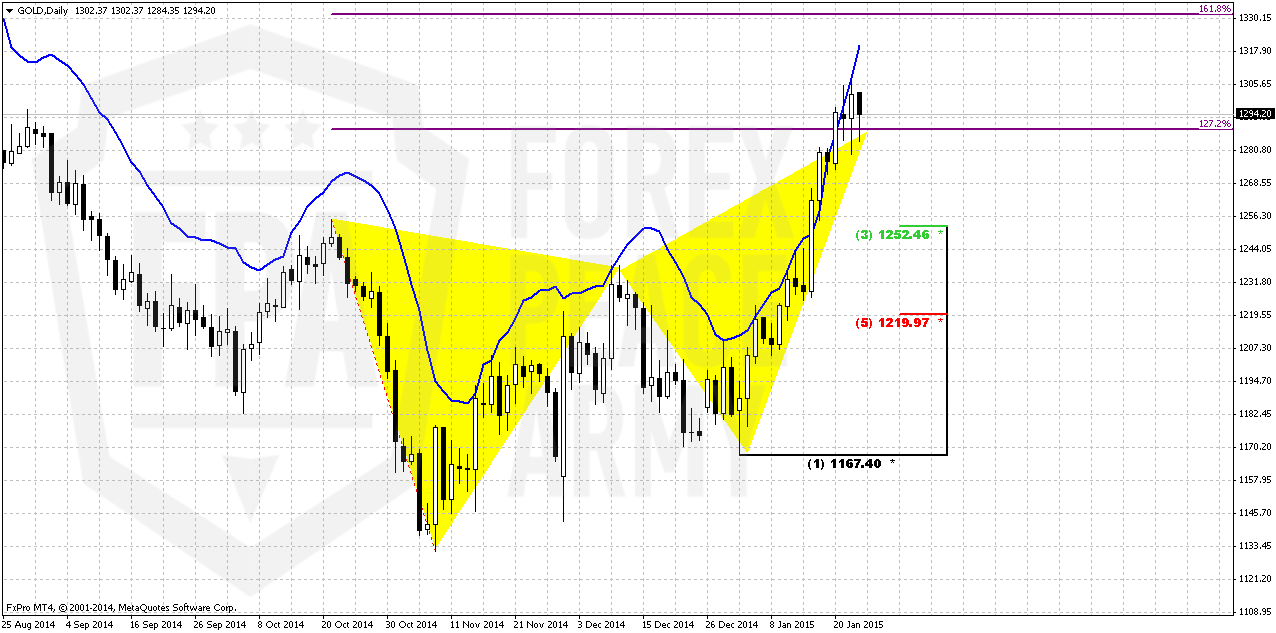
Daily
We still have this butterfly as central object of daily chart. This reversal pattern has been formed right at the same level as weekly Stretch. As we know, even minor 3/8 retracement will be enough to say that butterfly has worked. When you have such CFTC and SPDR data on the back – it is difficult to suggest deeper retracement. Besides, move to 1250 area is typical for the gold since it will be re-testing of broken highs and this is one of gold’s habits. After retracement upside action should continue to next cluster of targets – 1330-1340 area. It includes butterfly 1.618 extension, ultimate H&S 1.618 target and Yearly PR1.
Retracement to 1250 area could give us DiNapoli “B&B Buy” pattern. This would be right to the purpose.
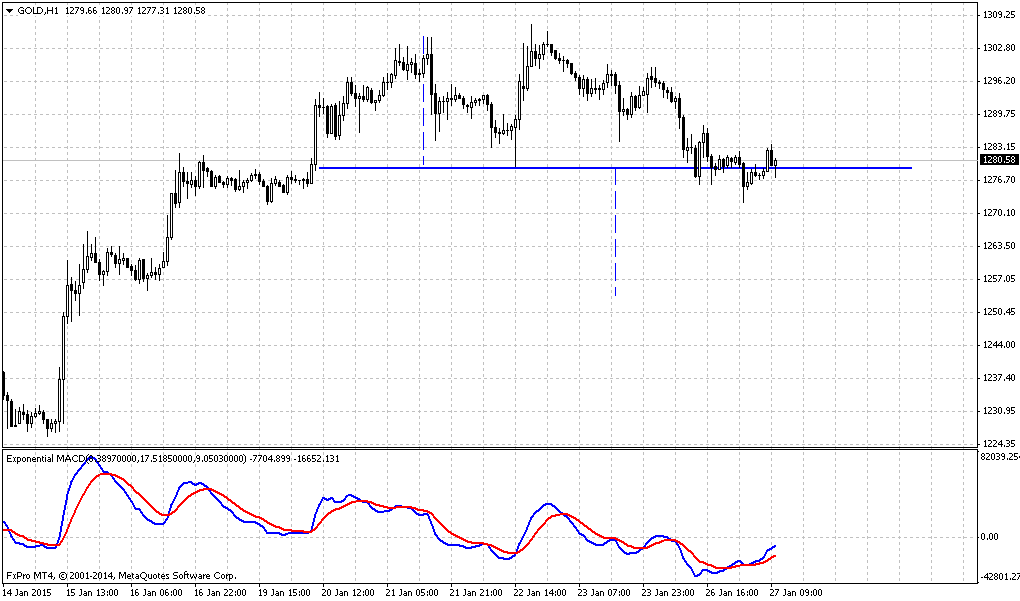
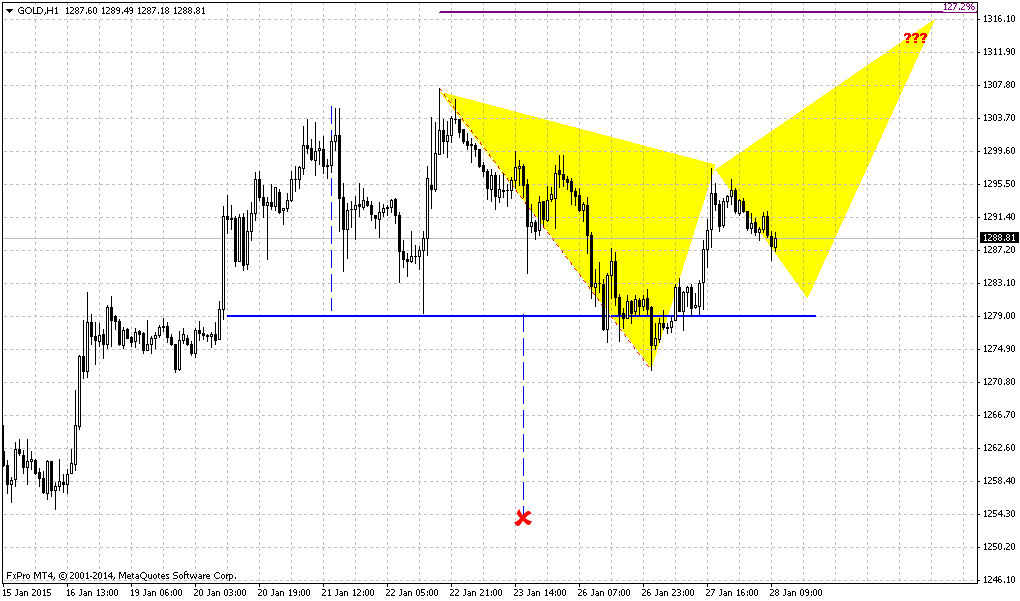
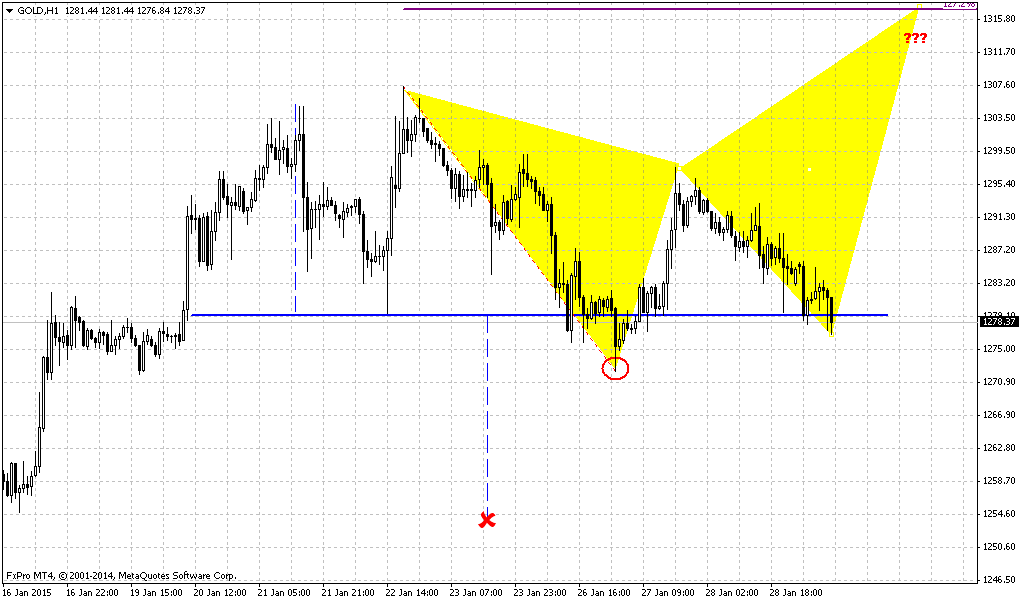
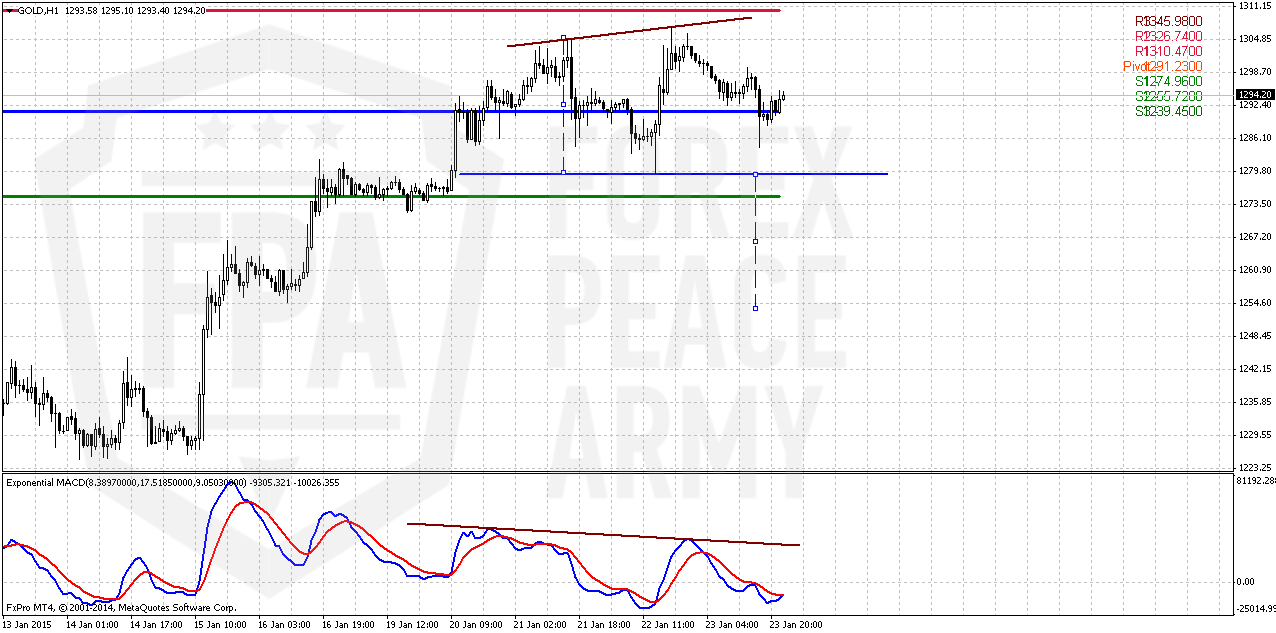
Hourly
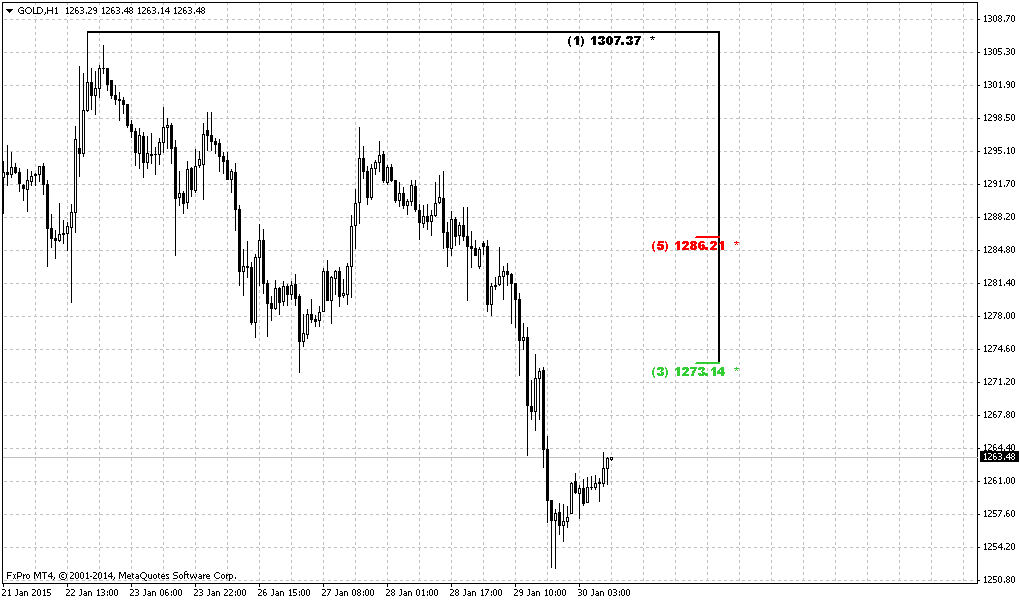
As we’ve said in our daily update, currently we see just one pattern that looks like reversal one. This is hint on Double Top on hourly chart. May be later we will see more. Greece election could bring surprises and if results of voting will slightly less radical gold could take short term bearish reaction that will trigger retracement down. Target of this pattern also points on 1250 level.
Still this Double Top shows not quite “correct” action on the slopes of the tops and it could happen that it will become the part of something bigger, say, left shoulder of H&S pattern…
Conclusion:
From technical point of view we have no reasons yet to abandon possible long-term downward AB-CD as VoB (Volatility breakout) development. Current upside action does not contradict to it and in fact could become “BC” leg of this pattern.
Taking into consideration the way how gold moves, CFTC data that shows different trend in positions we think that major factors are geopolitical and fundamental. They will come on surface probably when they will be totally utilized by institutional investors and become not as important as they stand now. We’ve described our opinion and view on this topic in current Forex weekly research. Shortly speaking we suspect that current action could be not just retracement and indicates global shifts in sentiment of investors who start to feel some tension and growing risk.
In short-term perspective it would be logical to suggest retracement down to 1250 area, but no clear reversal patterns have been formed yet on intraday charts.
The technical portion of Sive's analysis owes a great deal to Joe DiNapoli's methods, and uses a number of Joe's proprietary indicators. Please note that Sive's analysis is his own view of the market and is not endorsed by Joe DiNapoli or any related companies.
Weekly Gold Tading Report prepared by Sive Morten exclusively for ForexPeaceArmy.com
Reuters reports, Gold fell as much as 1.3 percent on Friday as the dollar rose and markets digested the mixed implications of a European Central Bank plan to pump about one trillion euros into the euro zone's flagging economy.
The metal, often seen as a hedge against inflation, jumped more than 1 percent above $1,300 an ounce on Thursday after the ECB announcement.
But with the euro hitting an 11-year low against the dollar , gold prices pared some of those gains as investors focused on the impact of the stronger U.S. currency, which makes dollar-denominated assets more expensive for investors holding other currencies.
"Gold was completely dislocated from the dollar yesterday, meaning that euro-gold is the best performing commodity this year, helping dollar gold stay fairly stable around $1,300," Saxo Bank's Ole Hansen said.
"But that strength in the dollar is now proving too much."
Goldman Sachs in a report seen by Reuters on Friday raised its 2015 gold price forecast to $1,262 per ounce from $1,200.
Traders are likely to turn to Sunday's election in Greece and next week's Federal Open Market Committee policy meeting for clues on the wider economic environment and when U.S. interest rates might rise.
The Fed is expected to repeat that global risks have yet to throw the U.S. recovery or its rate-hike plans off track despite the growing number of central banks cutting rates and ramping up stimulus.
"People are coming to the conclusion that while the ECB is getting more expansionary, the Fed may be forced to be less restrictive because of the headwinds to inflation from the drop in oil prices, which can trigger some delay in interest rate hikes and would be positive for gold," Julius Baer analyst Carsten Menke said.
Recent CFTC data confirms structural changes in market sentiment. Open interest has started to grow very fast and its increasing stands due growing of long speculative positions but not short. Recall that before New Year picture was opposite – shorts have grown faster and then they were closed massively right at the end of 2014.
Right now investors are returning back to market, but on opposite side. SPDR Fund also has shown solid growth of storages.
Here is detailed breakdown of speculative positions:
Open interest:
Finally, here is dynamic of SPDR Fund storages and gold price. Take a look that we have fast increasing of inflow in fund in recent 2 weeks. It creates bullish divergence with gold price. SPDR storages has formed reversal swing. So, accompanied by growth of net long position we could say, that gold dynamic is in fact new upside trend.
Technicals
Monthly
As New Year has started we’ve got some new inputs on monthly chart. Thus, we’ve got new yearly pivots.
Here we still have last big pattern in progress that is Volatility breakout (VOB). It suggests at least 0.618 AB-CD down. And this target is 1050$. This pattern could take shape of butterfly, if it will proceed to 1.618 target. Still, this is really big setup and current move down could be treated as BC leg. If this leg will exceed ~1433 area then we will need to adjust current AB-CD and we will get closer final destination point – may be no 1050, but 1080 or even 1100…
On recent week market has shown solid upside action. Market right now not just exceeds yearly pivot, but passed half way to Yearly Pivot resistance 1 @ 1342,50.
At the same time, returning back to discussion of recent NFP release, the major driving factor for Gold is inflation and particularly here US economy has problem. Wages again have contracted for 0.2%. Crude oil prices show decreasing. Accompanied by positive NFP numbers increasing chances on sooner rate hiking will be negative combination for gold. That’s why currently we do not see reasons yet to cancel our 1050$ target or at least possible big AB-CD down. Meantime we do not exclude current upside retracement. But this possible rally does not cancel yet chances on later downward turnover. The point is that lack of inflation, drop in oil and other commodities prices and applying of QE by other countries could let to US slightly postpone active phase of rate hiking. And this will be supportive for gold.
Still, we would suggest you to read our recent weekly research on Forex markets. If we will take into consideration geopolitical situation and risks that have appeared recently, it could happen that current upside action could become not just retracement but real reversal and changing in global sentiment and risk assessment. Because even technically we have reversal pattern at place on monthly chart – 1.27 Butterfly...Trend probably will turn bullish here by the end of January. Recent CFTC and SPDR data support this opinion.
Weekly
One of our doubts that previously stand on weekly chart was lack of impulse character in upside action. In recent two weeks gold really has turned to acceleration. Right now market has passed through all monthly pivots and hit overbought at major Fib resistance. As we’ve said on previous week - here market has limited upside potential and looks like resistance holds market from further upside continuation.
In fact we’ve got DiNapoli bearish “Stretch” pattern that could be reason for short-term downward retracement.
Daily
We still have this butterfly as central object of daily chart. This reversal pattern has been formed right at the same level as weekly Stretch. As we know, even minor 3/8 retracement will be enough to say that butterfly has worked. When you have such CFTC and SPDR data on the back – it is difficult to suggest deeper retracement. Besides, move to 1250 area is typical for the gold since it will be re-testing of broken highs and this is one of gold’s habits. After retracement upside action should continue to next cluster of targets – 1330-1340 area. It includes butterfly 1.618 extension, ultimate H&S 1.618 target and Yearly PR1.
Retracement to 1250 area could give us DiNapoli “B&B Buy” pattern. This would be right to the purpose.
Hourly
As we’ve said in our daily update, currently we see just one pattern that looks like reversal one. This is hint on Double Top on hourly chart. May be later we will see more. Greece election could bring surprises and if results of voting will slightly less radical gold could take short term bearish reaction that will trigger retracement down. Target of this pattern also points on 1250 level.
Still this Double Top shows not quite “correct” action on the slopes of the tops and it could happen that it will become the part of something bigger, say, left shoulder of H&S pattern…
Conclusion:
From technical point of view we have no reasons yet to abandon possible long-term downward AB-CD as VoB (Volatility breakout) development. Current upside action does not contradict to it and in fact could become “BC” leg of this pattern.
Taking into consideration the way how gold moves, CFTC data that shows different trend in positions we think that major factors are geopolitical and fundamental. They will come on surface probably when they will be totally utilized by institutional investors and become not as important as they stand now. We’ve described our opinion and view on this topic in current Forex weekly research. Shortly speaking we suspect that current action could be not just retracement and indicates global shifts in sentiment of investors who start to feel some tension and growing risk.
In short-term perspective it would be logical to suggest retracement down to 1250 area, but no clear reversal patterns have been formed yet on intraday charts.
The technical portion of Sive's analysis owes a great deal to Joe DiNapoli's methods, and uses a number of Joe's proprietary indicators. Please note that Sive's analysis is his own view of the market and is not endorsed by Joe DiNapoli or any related companies.