Sive Morten
Special Consultant to the FPA
- Messages
- 18,760
Fundamentals
Gold rose to a two-month high on Friday, posting its fifth consecutive weekly gain as a global flight from emerging-market assets and declines in equities increased bullion's safe-haven appeal. Volatility in the currency market led by the plummeting Argentina peso and Turkish lira prompted investors to buy gold, traders said. The yen surged to a seven-week high against the dollar, while the Swiss franc climbed to a five-week peak against the euro as investors sought refuge in safe-haven assets after a sell-off in emerging market currencies. A second consecutive day of sharp losses in U.S. equities also lifted gold. The S&P 500 index fell almost 2 percent.
However, gold investment demand remains weak, with the world's largest gold-backed exchange-traded fund SPDR Gold Shares posting a 5.4-tonne outflow on Thursday. Last week, it logged its first weekly inflow since early November. "It is questionable whether the price rise will be sustainable given that six tons were withdrawn from the gold ETFs yesterday," said Eugen Weinberg, head of commodity research at Commerzbank. "The latest development is more likely to have been driven by speculation," Weinberg said.
ASIAN GOLD PREMIUMS DOWN
Investors, however, are still wary of a market that took its biggest tumble in more than 30 years in 2013. Chinese demand eased, with premiums on the Shanghai Gold Exchange dropping to $10 an ounce from $12 the previous day. China in 2013 took over from India as the world's leading consumer of gold jewellery, data from metals consultancy Thomson Reuters GFMS showed. Gold premiums in India fell more than 30 percent on Friday from earlier this week on speculation over a possible easing of restrictions on bullion imports.
Another moment here is a seasonal bearish trend that gold will enter in mid February.
Recent CFTC data shows shy increase in net long position and Open Interest. But changes are too small to treat it seriously. Changes are more look like some ordinary fluctuations.

Monthly
January has started with upward action. There is just 1 week till the end of the month and market has shown upward action again. As a result this could lead to appearing of monthly bullish engulfing pattern. Trend holds bearish. Appearing of 1361 Yearly PP could get special meaning from possible retracement point of view. It could become possible nearest upside target. Yearly PR1 is also very significant. We know that gold likes to re-test previously broken lows and consolidations. 1540 area is monthly overbought, YPR1 and low border of broken long-term rectangle. As market was strongly oversold, why it can’t reach overbought? This is very typical action for any market.
As another application of significantly oversold we’ve suggested retracement up. Thus, we’ve made an assumption of possible deeper upward retracement that could take a shape of AB=CD, and invalidation for this setup is previous lows around 1170s. In fact current move up could be the last chance for possible upward bounce, if, say, market will show something like double bottom. Currently price action is very suitable for that – W&R of first bottom. This action in general is very typical for double bottoms and fake breakout could be the first sign of possible retracement up. Bearish market has no other reasons to stop right here, since there is no support right now – it has passed through 3/8 support, it’s not at oversold. Currently we should keep a close eye on move up.
At the same time fundamental data, seasonal trend, physical demand and CFTC recent data do not quite support upward action, at least right now. May be a bit later situation will change, but market will enter seasonal bearish trend in February and it will be even more difficult to continue move higher.

Weekly
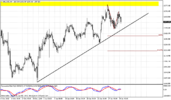
Trend has shifted bullish here. Upward action couldn’t get solid momentum yet, but on every week we see move down first, reversal and close at new highs by the end of the week. Take a look at long lower shadows of candles since move up has started. Price’s move is very gradual. Initially we’ve thought that this could become butterfly “buy” pattern, but it also could be “222” Buy, since if we’ve suggested that AB=CD has been completed and W&R really has happened, this could be double bottom. Also take a look, we have solid bullish divergence with MACD. By treating valleys as AB=CD pattern we’ll see that minor extension stands almost right at Yearly Pivot Point, and 1.618 extension stands slightly higher than Yearly PR1. This is really interesting agreement. Weekly chart points that we should search possibility for long entry. Odds suggest that after AB=CD completion market usually shows at minimum 3/8 retracement, and on the weekly chart this will be not small move. This, of cause, makes sense only if W&R of 1180 lows really has happened. If we will be wrong with this suggestion then we will get the trap that we’ve discussed previously. But on previous week we’ve got another moment that should add some more confidence with upward continuation – price has closed above MPR1.

Daily
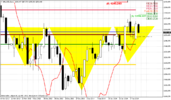
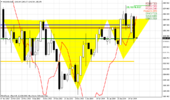
As usual, guys, if something is too obvious on the market – be ready for troubles. Here we’ve got it again – H&S is really obvious here and some unexpected shifting has followed. Instead of forming right shoulder market now is doing an attempt to go higher. But hardly market will pass too far. Slightly higher daily K-resistance and WPR1 stands. Now the major question is – whether we will get right shoulder finally or not, or we should treat recent consolidation as right shoulder. At my opinion if this really would be H&S, recent consolidation is too small to treat it as shoulder. Some bigger retracement down should come to keep the harmony of the pattern.

4-hour
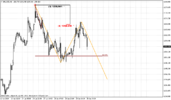
Here market has passed through minor AB=CD 0.618 extension. Next target stands right around WPR1 and daily K-resistance. We have some kind daily Agreement at K-resistance. Market is not at overbought, so it has chances to proceed slightly higher. Since daily resistance is rather solid, some bounce should happen out from there and very probable that it could become a starting point of right shoulder. If market will pass through it as it does not exist we will have to review our opinion.

Conclusion:
Market is still working on possible solid reversal pattern on daily chart. Thus, it looks like major events will follow a bit later. But right now we already can see interesting agreement between possible upward targets and Yearly Pivots in long term. At the same time there is some contradiction between recent fundamental data and technical picture. And soon probably it will be clear whether market really will show significant upward action or, this is just speculator’s game.
In shorter-term perspective market is approaching very strong resistance. Normally market should respect it by some meaningful retracement. From daily chart standpoint – all things stand the same – we wait bounce down for long entry, while in shorter-term situation the moment for searching possibility for scalp short trade should come somewhere around 1280 area.
The technical portion of Sive's analysis owes a great deal to Joe DiNapoli's methods, and uses a number of Joe's proprietary indicators. Please note that Sive's analysis is his own view of the market and is not endorsed by Joe DiNapoli or any related companies.
Gold rose to a two-month high on Friday, posting its fifth consecutive weekly gain as a global flight from emerging-market assets and declines in equities increased bullion's safe-haven appeal. Volatility in the currency market led by the plummeting Argentina peso and Turkish lira prompted investors to buy gold, traders said. The yen surged to a seven-week high against the dollar, while the Swiss franc climbed to a five-week peak against the euro as investors sought refuge in safe-haven assets after a sell-off in emerging market currencies. A second consecutive day of sharp losses in U.S. equities also lifted gold. The S&P 500 index fell almost 2 percent.
However, gold investment demand remains weak, with the world's largest gold-backed exchange-traded fund SPDR Gold Shares posting a 5.4-tonne outflow on Thursday. Last week, it logged its first weekly inflow since early November. "It is questionable whether the price rise will be sustainable given that six tons were withdrawn from the gold ETFs yesterday," said Eugen Weinberg, head of commodity research at Commerzbank. "The latest development is more likely to have been driven by speculation," Weinberg said.
ASIAN GOLD PREMIUMS DOWN
Investors, however, are still wary of a market that took its biggest tumble in more than 30 years in 2013. Chinese demand eased, with premiums on the Shanghai Gold Exchange dropping to $10 an ounce from $12 the previous day. China in 2013 took over from India as the world's leading consumer of gold jewellery, data from metals consultancy Thomson Reuters GFMS showed. Gold premiums in India fell more than 30 percent on Friday from earlier this week on speculation over a possible easing of restrictions on bullion imports.
Another moment here is a seasonal bearish trend that gold will enter in mid February.
Recent CFTC data shows shy increase in net long position and Open Interest. But changes are too small to treat it seriously. Changes are more look like some ordinary fluctuations.

Monthly
January has started with upward action. There is just 1 week till the end of the month and market has shown upward action again. As a result this could lead to appearing of monthly bullish engulfing pattern. Trend holds bearish. Appearing of 1361 Yearly PP could get special meaning from possible retracement point of view. It could become possible nearest upside target. Yearly PR1 is also very significant. We know that gold likes to re-test previously broken lows and consolidations. 1540 area is monthly overbought, YPR1 and low border of broken long-term rectangle. As market was strongly oversold, why it can’t reach overbought? This is very typical action for any market.
As another application of significantly oversold we’ve suggested retracement up. Thus, we’ve made an assumption of possible deeper upward retracement that could take a shape of AB=CD, and invalidation for this setup is previous lows around 1170s. In fact current move up could be the last chance for possible upward bounce, if, say, market will show something like double bottom. Currently price action is very suitable for that – W&R of first bottom. This action in general is very typical for double bottoms and fake breakout could be the first sign of possible retracement up. Bearish market has no other reasons to stop right here, since there is no support right now – it has passed through 3/8 support, it’s not at oversold. Currently we should keep a close eye on move up.
At the same time fundamental data, seasonal trend, physical demand and CFTC recent data do not quite support upward action, at least right now. May be a bit later situation will change, but market will enter seasonal bearish trend in February and it will be even more difficult to continue move higher.

Weekly
Trend has shifted bullish here. Upward action couldn’t get solid momentum yet, but on every week we see move down first, reversal and close at new highs by the end of the week. Take a look at long lower shadows of candles since move up has started. Price’s move is very gradual. Initially we’ve thought that this could become butterfly “buy” pattern, but it also could be “222” Buy, since if we’ve suggested that AB=CD has been completed and W&R really has happened, this could be double bottom. Also take a look, we have solid bullish divergence with MACD. By treating valleys as AB=CD pattern we’ll see that minor extension stands almost right at Yearly Pivot Point, and 1.618 extension stands slightly higher than Yearly PR1. This is really interesting agreement. Weekly chart points that we should search possibility for long entry. Odds suggest that after AB=CD completion market usually shows at minimum 3/8 retracement, and on the weekly chart this will be not small move. This, of cause, makes sense only if W&R of 1180 lows really has happened. If we will be wrong with this suggestion then we will get the trap that we’ve discussed previously. But on previous week we’ve got another moment that should add some more confidence with upward continuation – price has closed above MPR1.

Daily
As usual, guys, if something is too obvious on the market – be ready for troubles. Here we’ve got it again – H&S is really obvious here and some unexpected shifting has followed. Instead of forming right shoulder market now is doing an attempt to go higher. But hardly market will pass too far. Slightly higher daily K-resistance and WPR1 stands. Now the major question is – whether we will get right shoulder finally or not, or we should treat recent consolidation as right shoulder. At my opinion if this really would be H&S, recent consolidation is too small to treat it as shoulder. Some bigger retracement down should come to keep the harmony of the pattern.

4-hour
Here market has passed through minor AB=CD 0.618 extension. Next target stands right around WPR1 and daily K-resistance. We have some kind daily Agreement at K-resistance. Market is not at overbought, so it has chances to proceed slightly higher. Since daily resistance is rather solid, some bounce should happen out from there and very probable that it could become a starting point of right shoulder. If market will pass through it as it does not exist we will have to review our opinion.

Conclusion:
Market is still working on possible solid reversal pattern on daily chart. Thus, it looks like major events will follow a bit later. But right now we already can see interesting agreement between possible upward targets and Yearly Pivots in long term. At the same time there is some contradiction between recent fundamental data and technical picture. And soon probably it will be clear whether market really will show significant upward action or, this is just speculator’s game.
In shorter-term perspective market is approaching very strong resistance. Normally market should respect it by some meaningful retracement. From daily chart standpoint – all things stand the same – we wait bounce down for long entry, while in shorter-term situation the moment for searching possibility for scalp short trade should come somewhere around 1280 area.
The technical portion of Sive's analysis owes a great deal to Joe DiNapoli's methods, and uses a number of Joe's proprietary indicators. Please note that Sive's analysis is his own view of the market and is not endorsed by Joe DiNapoli or any related companies.
