Sive Morten
Special Consultant to the FPA
- Messages
- 18,699
Fundamentals
As Reuters reports, Gold edged up on Friday, gaining support from mixed European shares, but remained vulnerable after strong U.S. jobs data lifted the dollar, denting gold's investment appeal. U.S. employment growth jumped in June and the jobless rate closed in on a six-year low, providing evidence of economic growth heading into the second half of the year. The data was published a day earlier than usual due to the July 4 Independence Day holiday, which will curb volumes trading throughout the session. The data stoked speculation the U.S. Federal Reserve could hike interest rates earlier than expected.
"At the moment it seems middle of next year (for the Fed to start raising rates) but if the first quarter, as some suggest, becomes consensus then we are going to see gold below $1,300," Societe Generale analyst Robin Bhar said. Spot gold was down 21 cents to $1,319.49 an ounce at 1750 GMT. It fell 1.2 percent to a one-week low of $1,309.64 after the U.S. nonfarm payrolls release on Thursday, but managed to claw back losses as the market expects more macro signs on the strength of the global economy, traders said.
"Gold did well to hold above $1,310 after the good employment numbers, but it remains somewhat of a concern that there seems to be a wall of selling every time we try a convincing push above $1,330," MKS Group said in a note. "Overall, it feels like the shorts might be gaining momentum over the longs but think we will remain in consolidation mode $1,310-$1,330 for the next couple of sessions as this week's data sinks in."
The dollar rose 0.1 percent against a basket of main currencies, holding just below a one-week peak, while European shares were mixed as investors took the opportunity to lock in profits after the biggest week of gains since March. A stronger U.S. currency makes dollar-denominated assets like gold more expensive for foreign investors.
But gold still looked set to post its fifth straight weekly gain, although a small one, as tensions in the Middle East and Ukraine supported prices at the start of the week.
In other news, gold producers will return to net hedging for the first time since 2011 this year, GFMS analysts at Thomson Reuters said on Friday, after Polyus Gold this week announced a two-year program to sell gold forward.Monthly
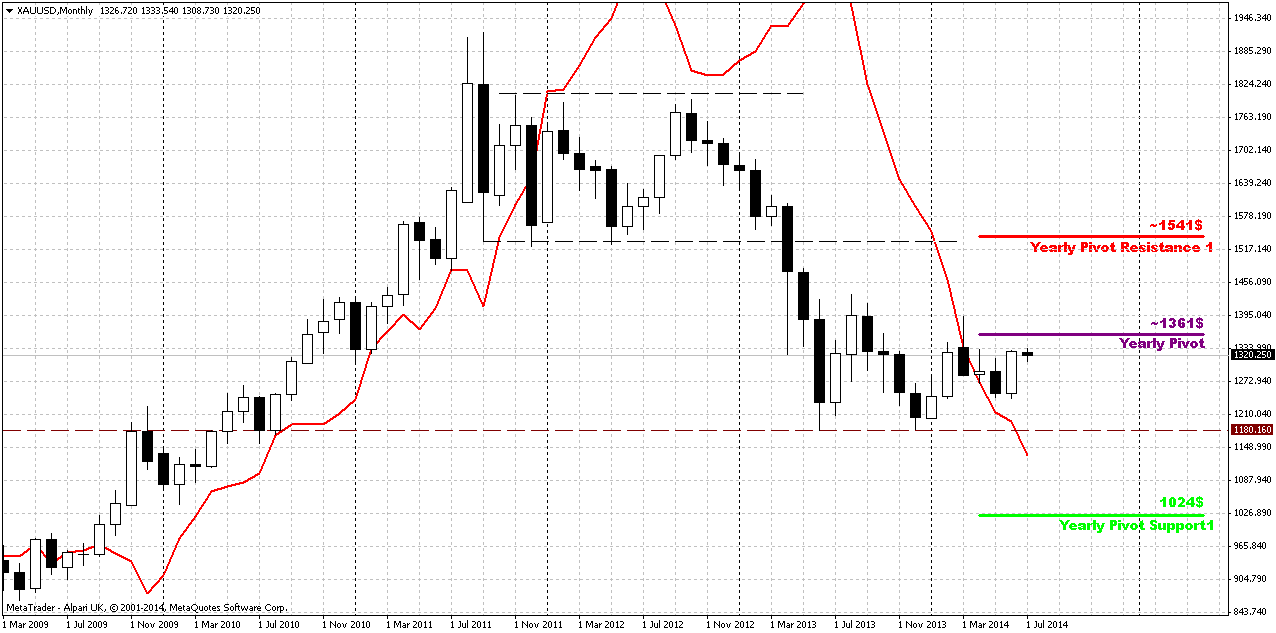
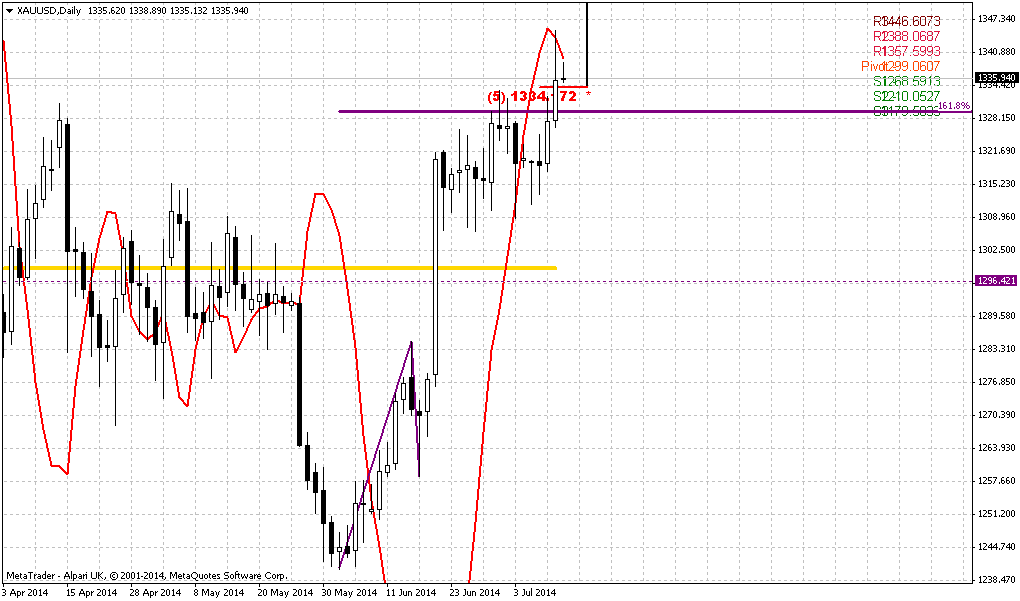
May right at the end has shown solid plunge down. It could mean that bearish grabber that was formed 2 months earlier has started to work. Also we’ve discussed possible bearish dynamic pressure here. At the same time our reversal level here becomes farer and farer. Even if price will reach 1350 area – it will not change big picture. Situation could change only if market will move above 1400 area.
Grabber pattern and pressure is so important right now, because they provide direction for long-term perspective. But June, and especially recent week has blocked gradual downward action and current nice white candle slightly breaks the bearish harmony of recent action. Major concern right now stands around this candle. What is it – real reversal or just fake emotional short-term splash that will end as fast as it has started? That is what we would like to know as well and that is what we will need to find out. As we have mentioned on previous week, CFTC data suggests possible upward continuation. On recent week this move was supported by new long positions but traders’ comments suggest shyer view on upside perspectives.
Speaking on greater picture, grabber has appeared right at Yearly Pivot Point – this is not best combination for bulls and could indicate reaction of the gold on Yearly pivot. Otherwords it could be a confirmation of bearish sentiment for the whole year. Grabber potentially strong pattern that could lead price back at least to 1180 lows again.
If we even will get any deeper retracement up - hardly it will change long-term picture. At the same time, Yearly Pivot stands at 1360 and it possibly could be re-tested during current retracement. Currently there are 3 major driving factors on gold - some unexpected geopolitical tensions, inflation and seasonal trend, i.e. spot demand. But only first one could support gold in short-term perspective. At the same time this support is unstable. CFTC as SPDR data is too choppy yet and need to become more gradual and stable to prove us with demand growth on spot gold market.
Hence, it is very difficult to take bet yet on long-term upward reversal on gold market. Even more, US fundamental data and seasonal trend now makes pressure impact on gold. Minor solace may be could come from CFTC data that shows that market is tied from constant decreasing. When net positions will reach extremely low levels – something could happen. May be this will coincide with end of seasonal bearish trend in late August, or even accompanied by some fundamental events. All these moments suggest that we should be focused still on tactical trading on daily chart, because there are too many uncertainty and “if-if” on monthly.
Weekly
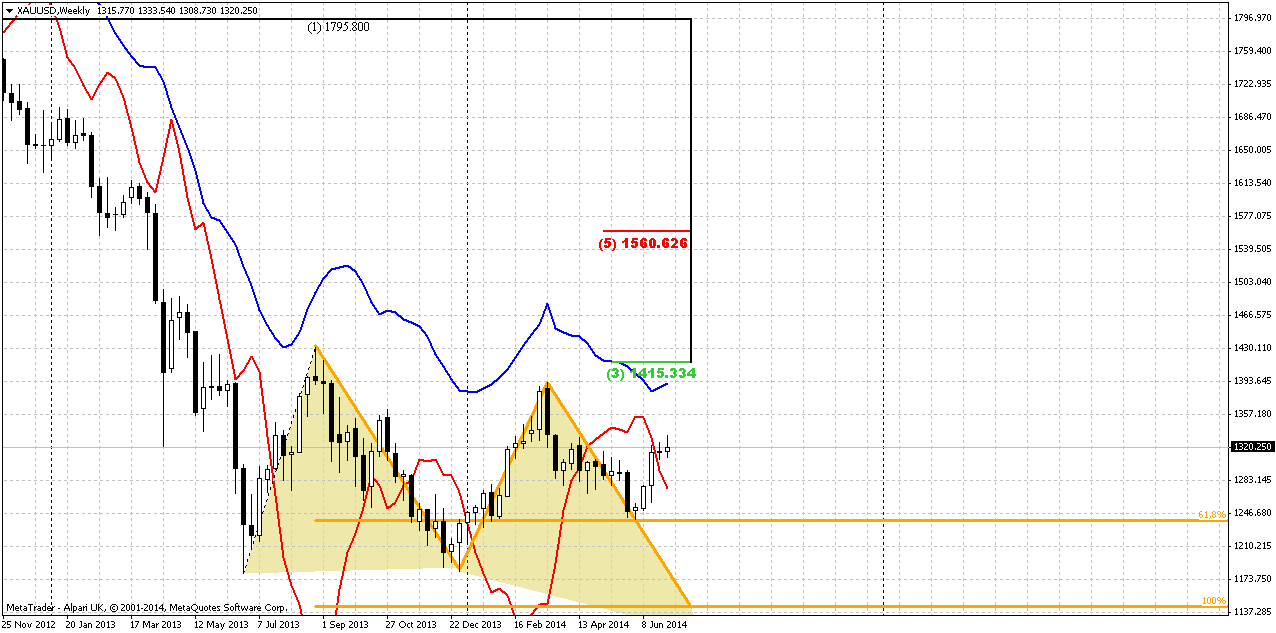
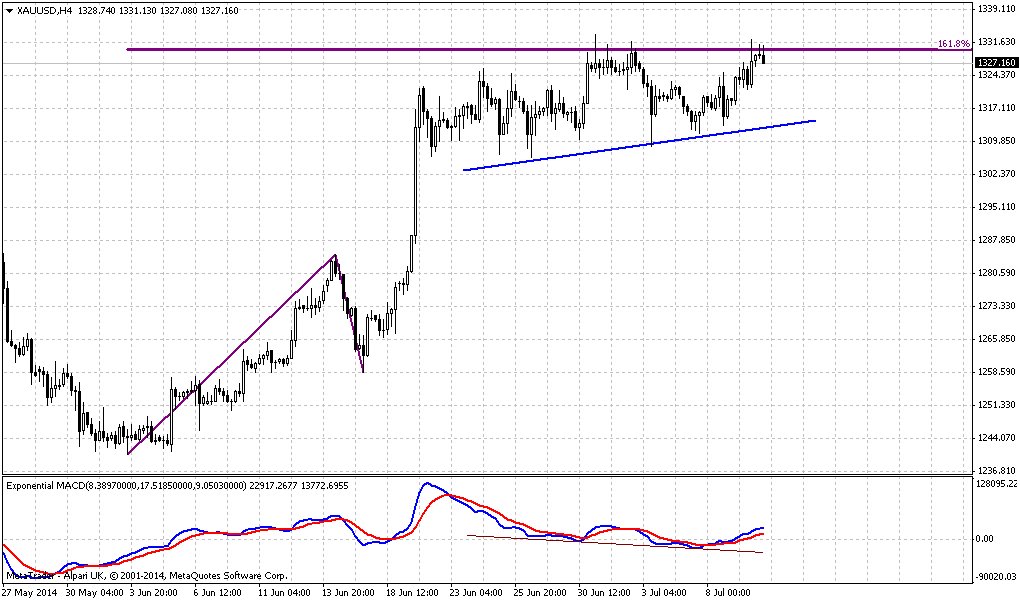
Recent week has very tight range and becomes a clone of week before. Trend has turned bullish. Weekly chart shows us the reason of bounce up on previous week. Yes, fundamentally this could be Iraq turmoil, but technically this is reaching of minor 0.618 extension of AB=CD pattern and daily butterfly “Buy”. Usually reaching of minor target does not suggest deep retracement. If market is really bearish it should continue move down soon and 1335 level – 5/8 Fib resistance will become the last edge. Retracement above 5/8 level will be too deep for minor bounce after reaching just minor AB=CD target. This will not be ordinary for bearish market and recent action shows that market really has difficulties to break through this resistance by far. Also traders tell that as soon as market reaches this area – buying volume starts to decline significantly.
By taking farer look, if move down will continue – market could form AB=CD down to 1140$ area, because monthly grabber suggests taking out of previous lows and next nearest target below it is precisely AB=CD objective point.
And finally, guys, here could be even butterfly Buy pattern. It has even lower target – 1110$. At the same time, this area around 1000-1100$ will become an area of big demand. This is the breakeven cost of gold mining. Price will not be able to hold below this level for long period, otherwise it will be just unprofitable to mine gold…
In fact, 1335 resistance will be very significant for us. If market will exceed it and continue move higher, this could vanish our bearish suggestions as about AB=CD as about butterfly. Currently they are still possible, at least theoretically, because recent price action does not let us to rely and hope on their appearing. And we should not file away it yet, despite how small chances on their appearing are. But move above 1335 will force us to turn on bullish side in short-term perspective.
Daily
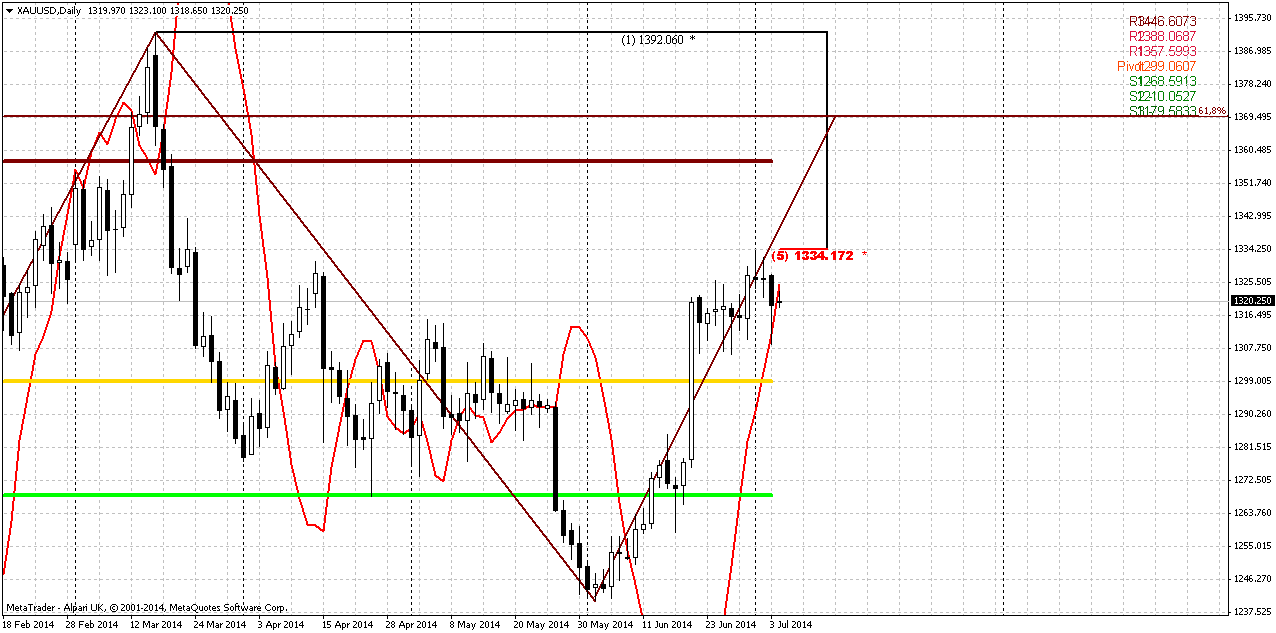
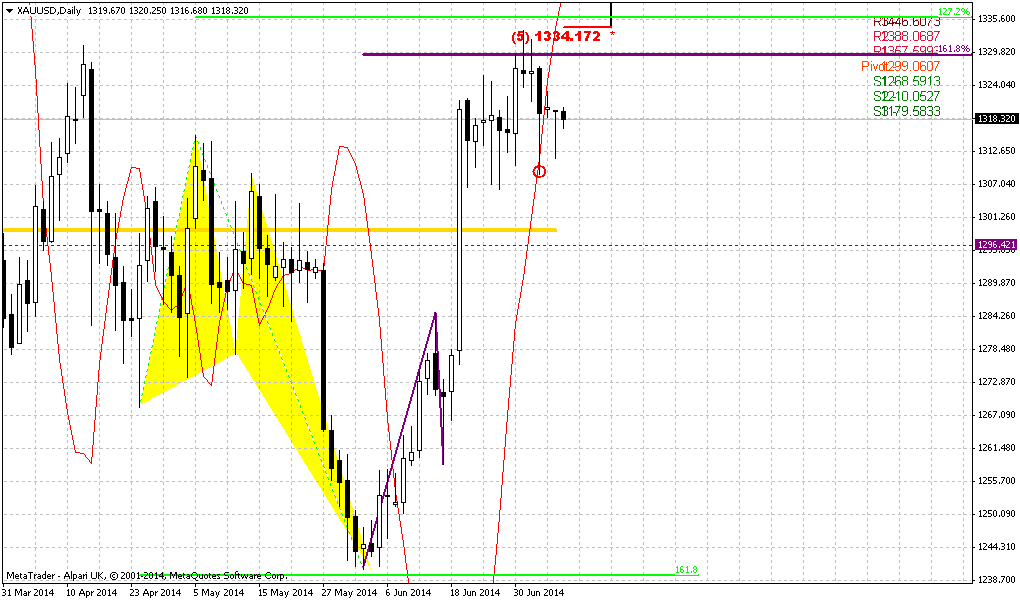
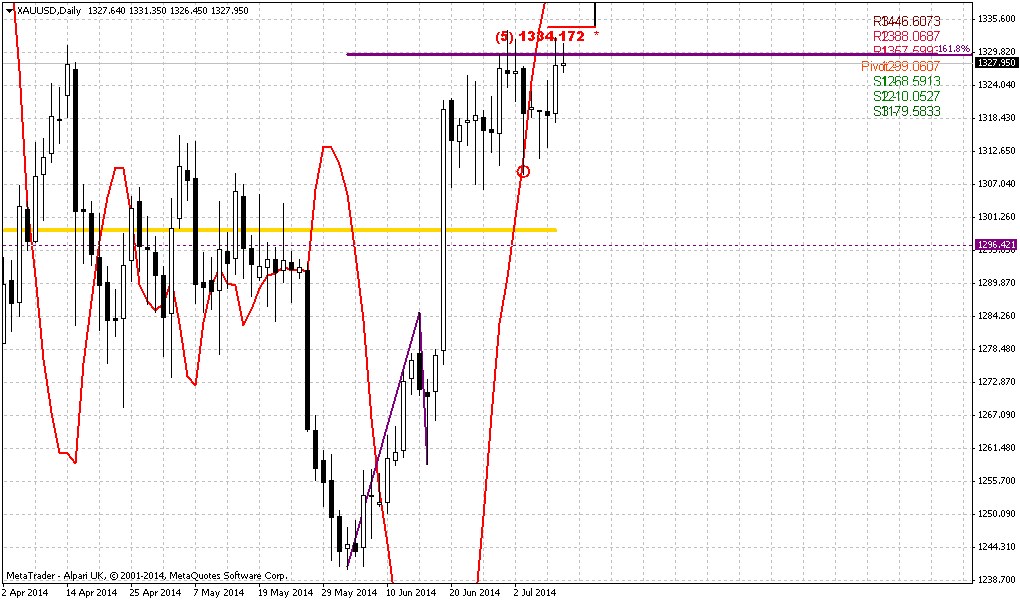
On previous week we draw Fib extension that could explain why many analysts tell about 1370 area. Indeed, this is minor 0.618 extension of upward AB=CD action and Yearly Pivot area as well. But on coming week this level stands beyond daily overbought. On recent week market has stand rather tight and built and energy, so any breakout could become really furious. Our major concern was about retracement – will it happen or not.
In general, if it will happen, retracement should reach 1295-1300 area. When market passes through some solid resistance without any respect – it usually has habit to re-test broken area by returning to it from opposite side. And this was really solid area – MPR1 and daily K-area. Also, guys, this will be ~50% level of long white candle.
At the same time market has formed bullish stop grabber that suggests opposite action and move at least above 1334 top. This makes situation complex, since initially we thought that market could form H&S pattern. And now here we have the same contradiction as between EUR and CHF in our FX Research. Yes, we could suggest any exit from current situation – either grabber’s failure or move up and retracement after that. But all these thoughts are just gambling, since daily chart does not give us clear signs. It means that we need to wait and get more clarity. Taking into consideration opinion of other analysts – many of them talk about high probability of retracement, since they see some bullish exhausting as long as market stands around 1335. Also they point on fact that market has failed to break through this resistance twice by now. And finally, market has formed reversal swing. Usually retracement is deep after that. These moments point on possible grabber’s failure, but who knows how it will be in reality…
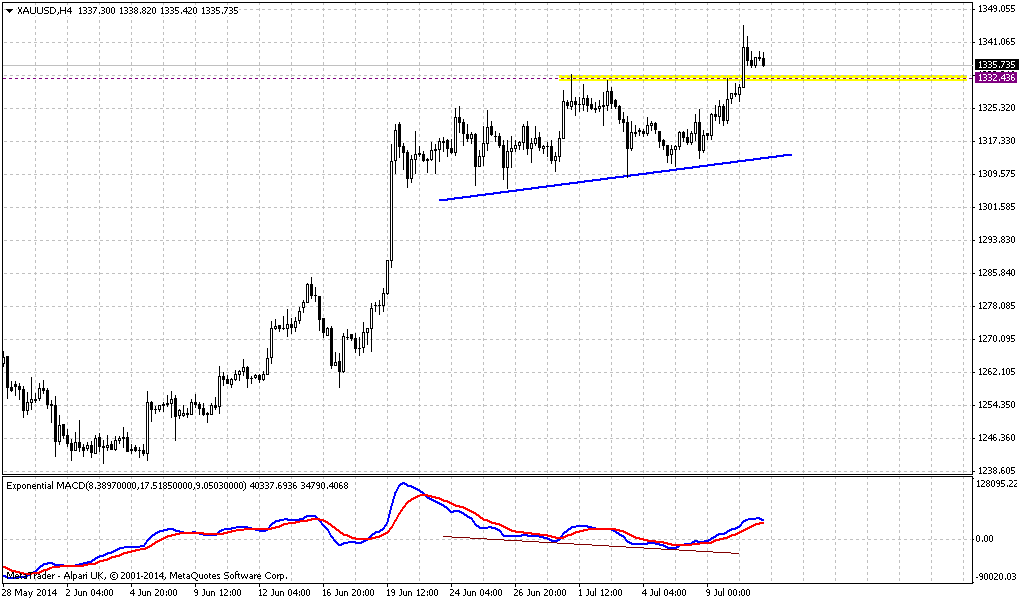
4-hour
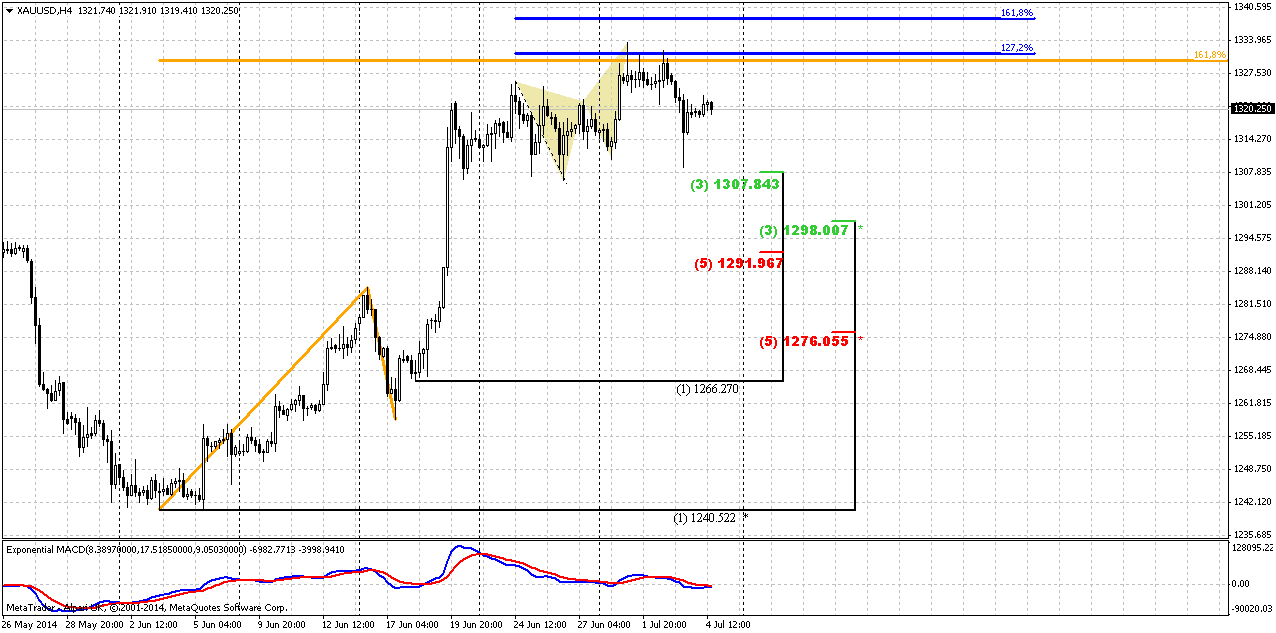
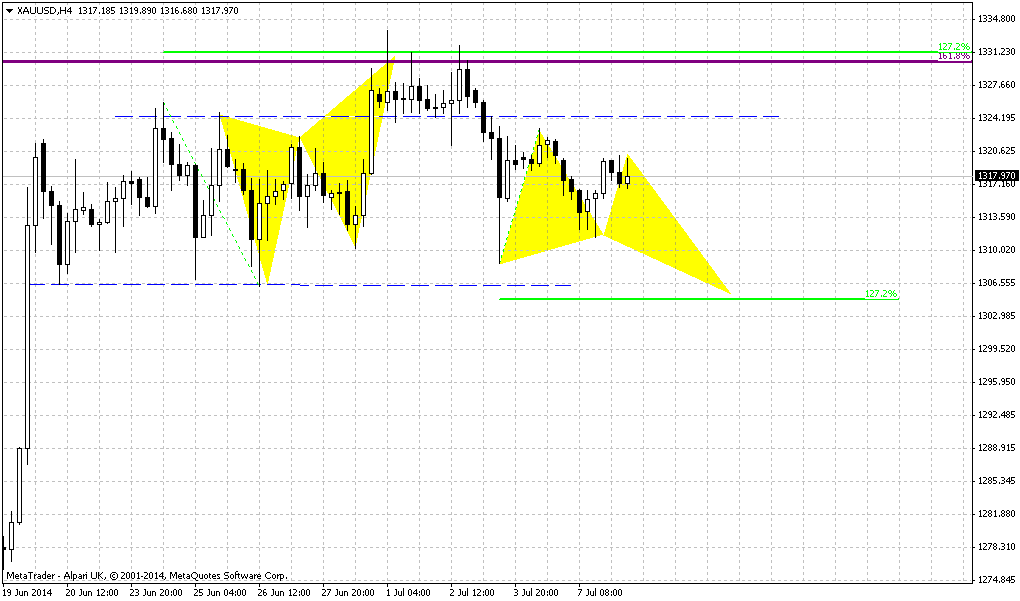
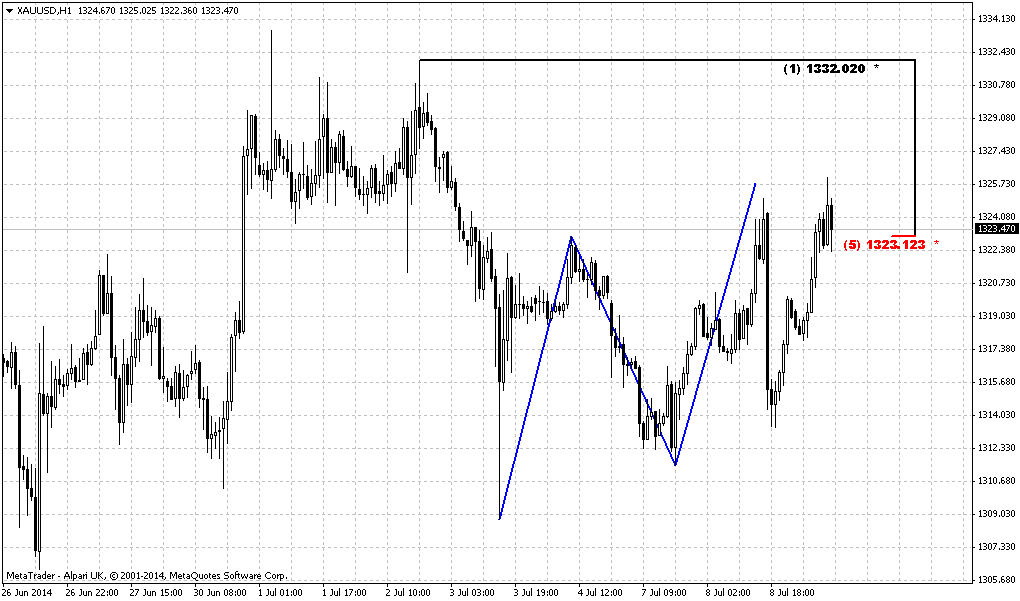
Here we see that solid part of our H&S pattern has been formed already, but daily bullish grabber makes situation complex. We probably should continue to watch for H&S, mostly due reasons that we point above. At the same time, we see only one possible way how market could complete grabber. For example, it could continue move to 1.618 extension of butterfly. This looks a bit curious, since recent move down after 1.27 target seems too deep to treat it as just retracement. It means that we probably should watch for couple of moments – process of appearing of H&S pattern, and right shoulder in particular, and second – 1307 low. If market will take it out grabber will fail.
Conclusion:
Market has to breakout either 1400 to change long-term situation significantly. Although we have some supportive impact from geopolitical turmoil and recent CFTC data but analysts still point on speculative character of current upward action and lack of support from institutional investors. This makes very difficult to make any forecasts of strength and timing of current upward action.
In short-term 1295 retracement is still possible, but market could start it differently. Now we have a bit contradictive patterns. H&S pattern starts to form already, but recently we’ve got bullish grabber. We will get solution anyway, but looks like in the beginning of the week we will monitor as H&S as low of the grabber.
The technical portion of Sive's analysis owes a great deal to Joe DiNapoli's methods, and uses a number of Joe's proprietary indicators. Please note that Sive's analysis is his own view of the market and is not endorsed by Joe DiNapoli or any related companies.
As Reuters reports, Gold edged up on Friday, gaining support from mixed European shares, but remained vulnerable after strong U.S. jobs data lifted the dollar, denting gold's investment appeal. U.S. employment growth jumped in June and the jobless rate closed in on a six-year low, providing evidence of economic growth heading into the second half of the year. The data was published a day earlier than usual due to the July 4 Independence Day holiday, which will curb volumes trading throughout the session. The data stoked speculation the U.S. Federal Reserve could hike interest rates earlier than expected.
"At the moment it seems middle of next year (for the Fed to start raising rates) but if the first quarter, as some suggest, becomes consensus then we are going to see gold below $1,300," Societe Generale analyst Robin Bhar said. Spot gold was down 21 cents to $1,319.49 an ounce at 1750 GMT. It fell 1.2 percent to a one-week low of $1,309.64 after the U.S. nonfarm payrolls release on Thursday, but managed to claw back losses as the market expects more macro signs on the strength of the global economy, traders said.
"Gold did well to hold above $1,310 after the good employment numbers, but it remains somewhat of a concern that there seems to be a wall of selling every time we try a convincing push above $1,330," MKS Group said in a note. "Overall, it feels like the shorts might be gaining momentum over the longs but think we will remain in consolidation mode $1,310-$1,330 for the next couple of sessions as this week's data sinks in."
The dollar rose 0.1 percent against a basket of main currencies, holding just below a one-week peak, while European shares were mixed as investors took the opportunity to lock in profits after the biggest week of gains since March. A stronger U.S. currency makes dollar-denominated assets like gold more expensive for foreign investors.
But gold still looked set to post its fifth straight weekly gain, although a small one, as tensions in the Middle East and Ukraine supported prices at the start of the week.
In other news, gold producers will return to net hedging for the first time since 2011 this year, GFMS analysts at Thomson Reuters said on Friday, after Polyus Gold this week announced a two-year program to sell gold forward.Monthly
May right at the end has shown solid plunge down. It could mean that bearish grabber that was formed 2 months earlier has started to work. Also we’ve discussed possible bearish dynamic pressure here. At the same time our reversal level here becomes farer and farer. Even if price will reach 1350 area – it will not change big picture. Situation could change only if market will move above 1400 area.
Grabber pattern and pressure is so important right now, because they provide direction for long-term perspective. But June, and especially recent week has blocked gradual downward action and current nice white candle slightly breaks the bearish harmony of recent action. Major concern right now stands around this candle. What is it – real reversal or just fake emotional short-term splash that will end as fast as it has started? That is what we would like to know as well and that is what we will need to find out. As we have mentioned on previous week, CFTC data suggests possible upward continuation. On recent week this move was supported by new long positions but traders’ comments suggest shyer view on upside perspectives.
Speaking on greater picture, grabber has appeared right at Yearly Pivot Point – this is not best combination for bulls and could indicate reaction of the gold on Yearly pivot. Otherwords it could be a confirmation of bearish sentiment for the whole year. Grabber potentially strong pattern that could lead price back at least to 1180 lows again.
If we even will get any deeper retracement up - hardly it will change long-term picture. At the same time, Yearly Pivot stands at 1360 and it possibly could be re-tested during current retracement. Currently there are 3 major driving factors on gold - some unexpected geopolitical tensions, inflation and seasonal trend, i.e. spot demand. But only first one could support gold in short-term perspective. At the same time this support is unstable. CFTC as SPDR data is too choppy yet and need to become more gradual and stable to prove us with demand growth on spot gold market.
Hence, it is very difficult to take bet yet on long-term upward reversal on gold market. Even more, US fundamental data and seasonal trend now makes pressure impact on gold. Minor solace may be could come from CFTC data that shows that market is tied from constant decreasing. When net positions will reach extremely low levels – something could happen. May be this will coincide with end of seasonal bearish trend in late August, or even accompanied by some fundamental events. All these moments suggest that we should be focused still on tactical trading on daily chart, because there are too many uncertainty and “if-if” on monthly.
Weekly
Recent week has very tight range and becomes a clone of week before. Trend has turned bullish. Weekly chart shows us the reason of bounce up on previous week. Yes, fundamentally this could be Iraq turmoil, but technically this is reaching of minor 0.618 extension of AB=CD pattern and daily butterfly “Buy”. Usually reaching of minor target does not suggest deep retracement. If market is really bearish it should continue move down soon and 1335 level – 5/8 Fib resistance will become the last edge. Retracement above 5/8 level will be too deep for minor bounce after reaching just minor AB=CD target. This will not be ordinary for bearish market and recent action shows that market really has difficulties to break through this resistance by far. Also traders tell that as soon as market reaches this area – buying volume starts to decline significantly.
By taking farer look, if move down will continue – market could form AB=CD down to 1140$ area, because monthly grabber suggests taking out of previous lows and next nearest target below it is precisely AB=CD objective point.
And finally, guys, here could be even butterfly Buy pattern. It has even lower target – 1110$. At the same time, this area around 1000-1100$ will become an area of big demand. This is the breakeven cost of gold mining. Price will not be able to hold below this level for long period, otherwise it will be just unprofitable to mine gold…
In fact, 1335 resistance will be very significant for us. If market will exceed it and continue move higher, this could vanish our bearish suggestions as about AB=CD as about butterfly. Currently they are still possible, at least theoretically, because recent price action does not let us to rely and hope on their appearing. And we should not file away it yet, despite how small chances on their appearing are. But move above 1335 will force us to turn on bullish side in short-term perspective.
Daily
On previous week we draw Fib extension that could explain why many analysts tell about 1370 area. Indeed, this is minor 0.618 extension of upward AB=CD action and Yearly Pivot area as well. But on coming week this level stands beyond daily overbought. On recent week market has stand rather tight and built and energy, so any breakout could become really furious. Our major concern was about retracement – will it happen or not.
In general, if it will happen, retracement should reach 1295-1300 area. When market passes through some solid resistance without any respect – it usually has habit to re-test broken area by returning to it from opposite side. And this was really solid area – MPR1 and daily K-area. Also, guys, this will be ~50% level of long white candle.
At the same time market has formed bullish stop grabber that suggests opposite action and move at least above 1334 top. This makes situation complex, since initially we thought that market could form H&S pattern. And now here we have the same contradiction as between EUR and CHF in our FX Research. Yes, we could suggest any exit from current situation – either grabber’s failure or move up and retracement after that. But all these thoughts are just gambling, since daily chart does not give us clear signs. It means that we need to wait and get more clarity. Taking into consideration opinion of other analysts – many of them talk about high probability of retracement, since they see some bullish exhausting as long as market stands around 1335. Also they point on fact that market has failed to break through this resistance twice by now. And finally, market has formed reversal swing. Usually retracement is deep after that. These moments point on possible grabber’s failure, but who knows how it will be in reality…
4-hour
Here we see that solid part of our H&S pattern has been formed already, but daily bullish grabber makes situation complex. We probably should continue to watch for H&S, mostly due reasons that we point above. At the same time, we see only one possible way how market could complete grabber. For example, it could continue move to 1.618 extension of butterfly. This looks a bit curious, since recent move down after 1.27 target seems too deep to treat it as just retracement. It means that we probably should watch for couple of moments – process of appearing of H&S pattern, and right shoulder in particular, and second – 1307 low. If market will take it out grabber will fail.
Conclusion:
Market has to breakout either 1400 to change long-term situation significantly. Although we have some supportive impact from geopolitical turmoil and recent CFTC data but analysts still point on speculative character of current upward action and lack of support from institutional investors. This makes very difficult to make any forecasts of strength and timing of current upward action.
In short-term 1295 retracement is still possible, but market could start it differently. Now we have a bit contradictive patterns. H&S pattern starts to form already, but recently we’ve got bullish grabber. We will get solution anyway, but looks like in the beginning of the week we will monitor as H&S as low of the grabber.
The technical portion of Sive's analysis owes a great deal to Joe DiNapoli's methods, and uses a number of Joe's proprietary indicators. Please note that Sive's analysis is his own view of the market and is not endorsed by Joe DiNapoli or any related companies.


")