Sive Morten
Special Consultant to the FPA
- Messages
- 18,699
Fundamentals
Weekly Gold Tading Report prepared by Sive Morten exclusively for ForexPeaceArmy.com
Reuters reports Gold fell to a five-year low on Friday, pressured by a strong dollar and expectations for a U.S. rate hike this year, and as China bought less than expected over the past six years.
Platinum fell below the key $1,000-an-ounce level for the first time in more than six years while palladium extended losses to hit its lowest since November 2012.
China's gold reserves were up 57 percent at the end of June, from the last time it adjusted its reserve figures more than six years ago, the central bank said. Despite the tonnage increase, gold now accounts for 1.65 percent of China's total forex reserves, against 1.8 percent in June 2009.
The reduced ratio suggested China will increase its bullion purchases, but the market focused elsewhere, traders said.
"The market's saying China's been buying gold but they bought a lot less than what they should have," said Phillip Streible, senior commodities broker for RJO Futures in Chicago.
Spot gold dropped 1.1 percent to its lowest since April 2010 at $1,130.70 an ounce and was last down 1 percent at $1,133.13. It was on track for a 2.6 percent weekly fall, the biggest since early March.
Spot platinum fell 1.4 percent to $991 an ounce, the lowest since February 2009.
"If the low figure is correct then that is actually very bullish because there is plenty of scope for continued buying for many years to come," said Ross Norman, chief executive of bullion brokerage Sharps Pixley in London, referring to China's gold reserves.
"The weakness we are seeing is related to the strength of the U.S. dollar," said Norbert Ruecker, head of commodity research at Julius Baer.
"Gold is finding a lot of headwinds from multiple sources: we have seen the Greek risk fade and the focus return to the U.S. and Janet Yellen," Saxo Bank Senior Manager Ole Hansen said.
Gold's 3 percent fall so far this year has failed to spur demand in top consumers in Asia with domestic prices in No. 2 market India remaining at a discount to global spot prices.
Recent CFTC data again shows increase in open interest but at this time growth was not as strong as previously. Speculative long positions slightly have contracted while shorts mostly stand the same. It will be interesting to look at CFTC next week and how data will change after Friday sell-off. It seems that changes should be significant in favor of bears.
SPDR fund has lost another 15 tonnes in storages. This is big fall for just one week. Now its storages stands at ~696 tonnes. So gold price drop was confirmed by real sell-off on the market.
That’s being said sentiment data mostly supports further downward action on gold market.
Here is detailed breakdown of speculative positions:
Open interest:
 Shorts:
 Longs:
 Summary:
Technicals
Monthly
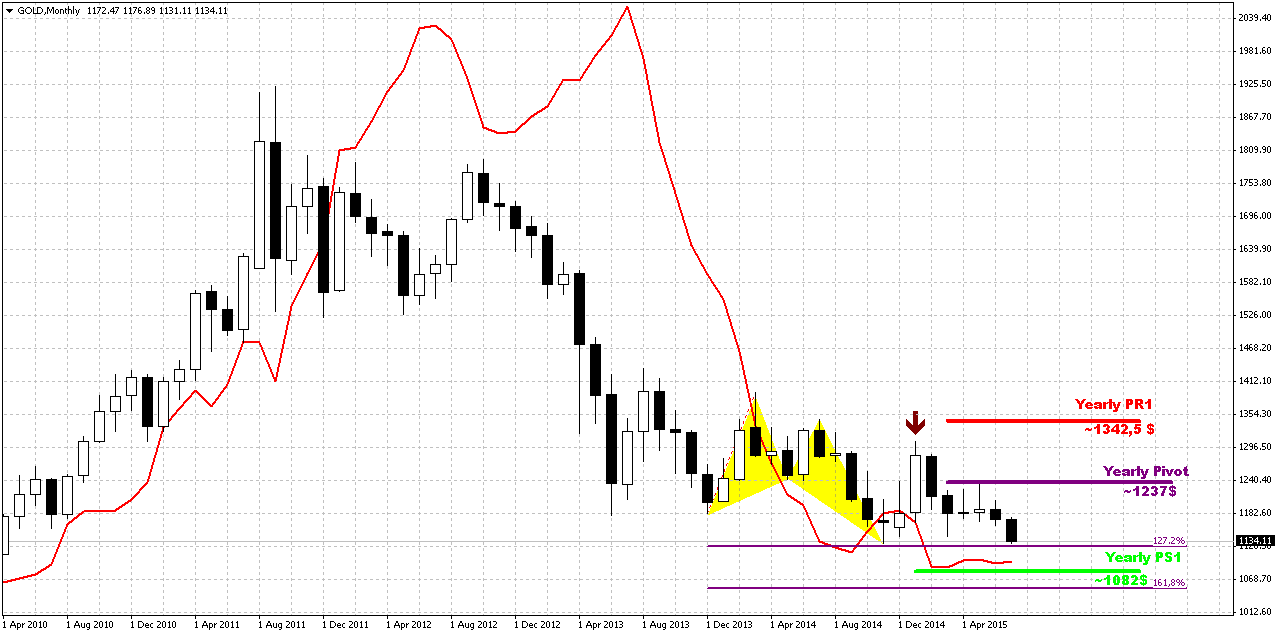
Last week shows some bearish activity and market finally has made visible motion according to our pattern. 1130 level has not been broken yet, but taking into consideration how close market stands – this is just the question of time. If even we will not get real breakout – W&R should happen with high probability.
In general gold stands rather flat on monthly chart within 4 months in a row. Currently bearish dynamic pressure becomes very clear on this chart and market finally has started action according to it. As bearish dynamic pressure as VOB pattern are still valid.
On long-term horizon we still have last big pattern in progress that is Volatility breakout (VOB). It suggests at least 0.618 AB-CD down. And this target is 1050$. At the same time we need 1130 breakout to start clearly speak on 1050 target.
But what action market should show to break huge bearish patterns on monthly? Dynamic pressure is a tendency of lower highs within bullish trend. Hence, to break it, market should show higher high. I’ve marked it with arrow. It means that market should take out 1308 top to break this pattern and make investors doubt on bearish perspectives of gold market in long term. Early bell of changing situation could be moving above YPP.
Overall picture still remains mostly bearish. In the beginning of the year market showed solid upside action. Gold was able to exceed yearly pivot, passed half way to Yearly Pivot resistance 1 but right now has reversed down and closed below YPP. From technical point of view this is bearish sign. This could be very significant moment and next logical destination will be yearly pivot support 1 around 1083$.
Fundamentally, gold mostly is hostage of dollar value and US economical data (mostly inflation) in nearest perspective. Approximately the same was announced by Fed in forecast on inflation and had become a reason of dovish approach to rate hiking. Despite that Yellen has given clear hints on rate hike this year, many investors treat this approach as dovish, since investors previously expected double rate hike till the end of the year. Also Fed every time tells about worrying sings on employment and structure of job market and weak inflation that barely has reached 2%.
If we will take into consideration geopolitical situation and risks that have appeared recently, it could happen that situation will change, but unfortunately the geopolitics is sphere where we can’t do much and this sphere stands beyond of our control.
That’s being said, as gold has passed through 1200 and until it stands below 1308 top, our long-term next destination point is previous lows at 1130, but if gold will return to 1130 for second time – this is temporal destination and we should prepare for further downward action. Particularly this action we have right now.
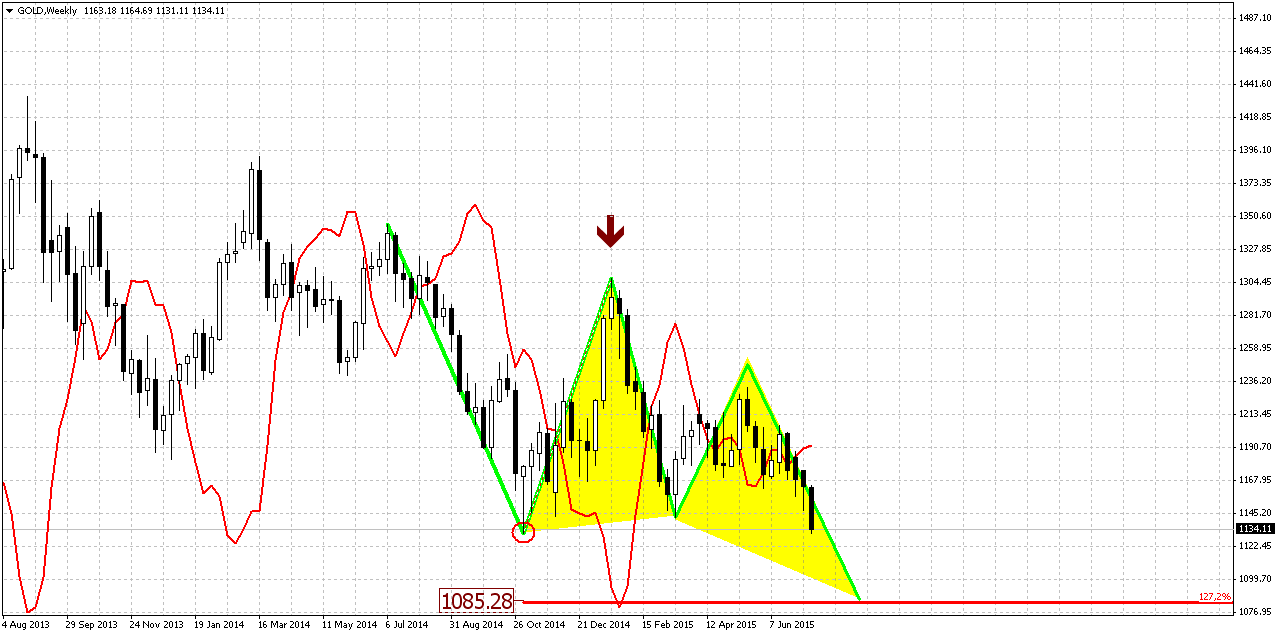
Weekly
Trend is bearish here. Since April trend mostly holds bullish (by MACD), but price action is not, gold can’t start upside action. This could be the sign of market’s weakness. Finally gold has shown some acceleration and dropped down recently. Multiple bearish grabbers have led price right to 1130 key level.
Market is not at oversold right now and, in fact, has no other supports except major 1130 lows. Here market forms multiple patterns and all of them have targets below 1130 level.
Our major one is still big butterfly. Speaking on targets, we have three different patterns that point on the same level. They are butterfly “buy”, AB=CD and the part of this AB-CD that takes “222” Sell shape (smaller most recent AB-CD).
Thus, all these patterns point at the same destination around 1080$. This level is special, because it coincides with YPS1. Acceleration probably should happen after 1130 breakout.
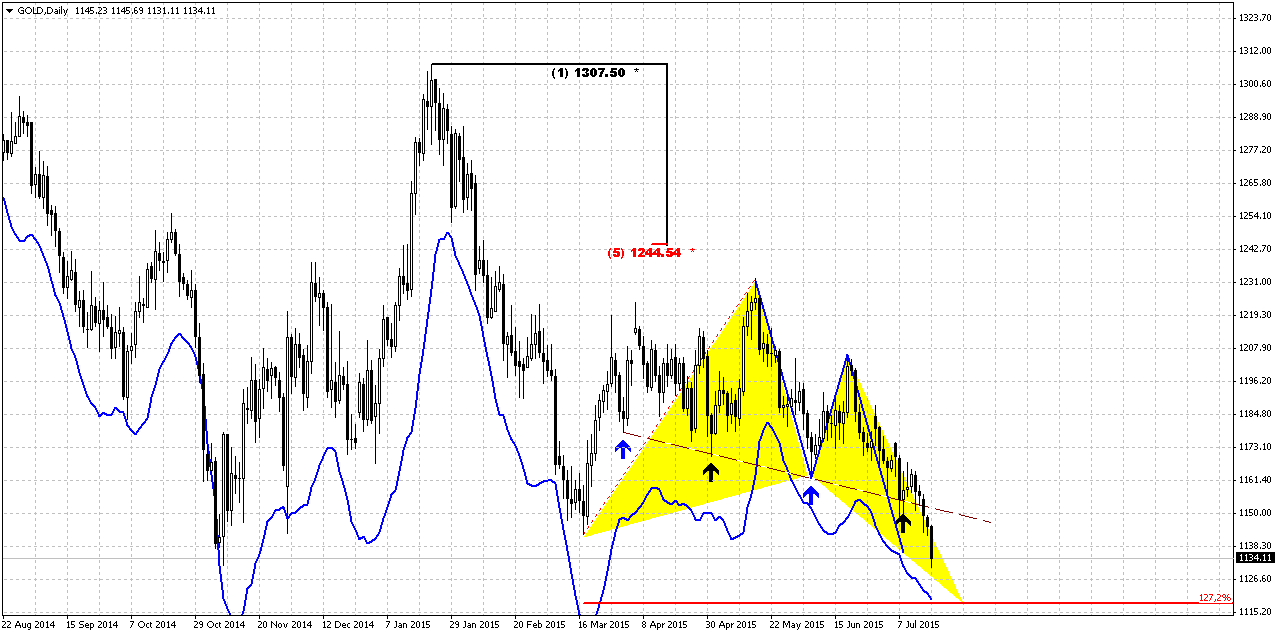
Daily
Trend is bearish on daily chart. Here we need to take in consideration couple of moments. First of all – take a look market is not at oversold and only support that it has here is former 1130 lows. Gold market has interesting feature, or better to say, couple ones. If market approaches to some important level, and 1130 lows are no doubts important one, it is almost never leaves it untouched. Other words speaking, gold as a rule clear out stops around important levels. Second feature, that is on as well-known as first one is “spurious retracement”. When gold comes close to important level it starts some retracement that looks like reversal and creates visibility of upside reversal. Investors turn on bull side, but later gold returns back, clear out stops as new traders who have stepped in just recently and stops below major level.
Now take a look at the chart. We could get the same situation right now. At the first glance market has completed downward AB=CD here and some retracement could happen. At the same time we have weekly targets and daily butterfly. AB=CD has finished right at 1130 level. So gold could start some upside retracement, but be careful – later it will return back with high probability. Following gold’s habit again – most probable target of this upside retracement could be broken trend line.
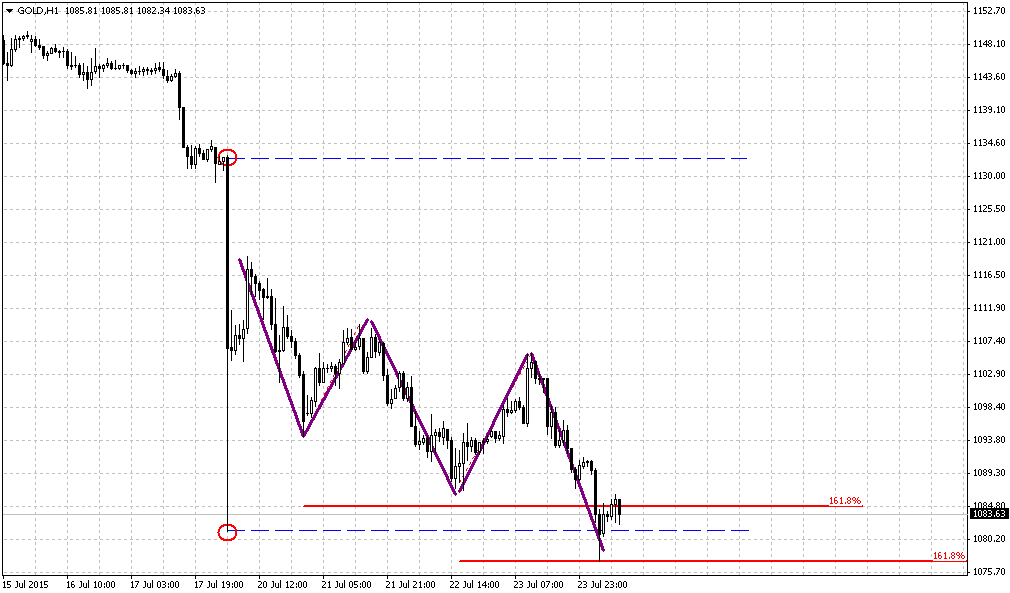
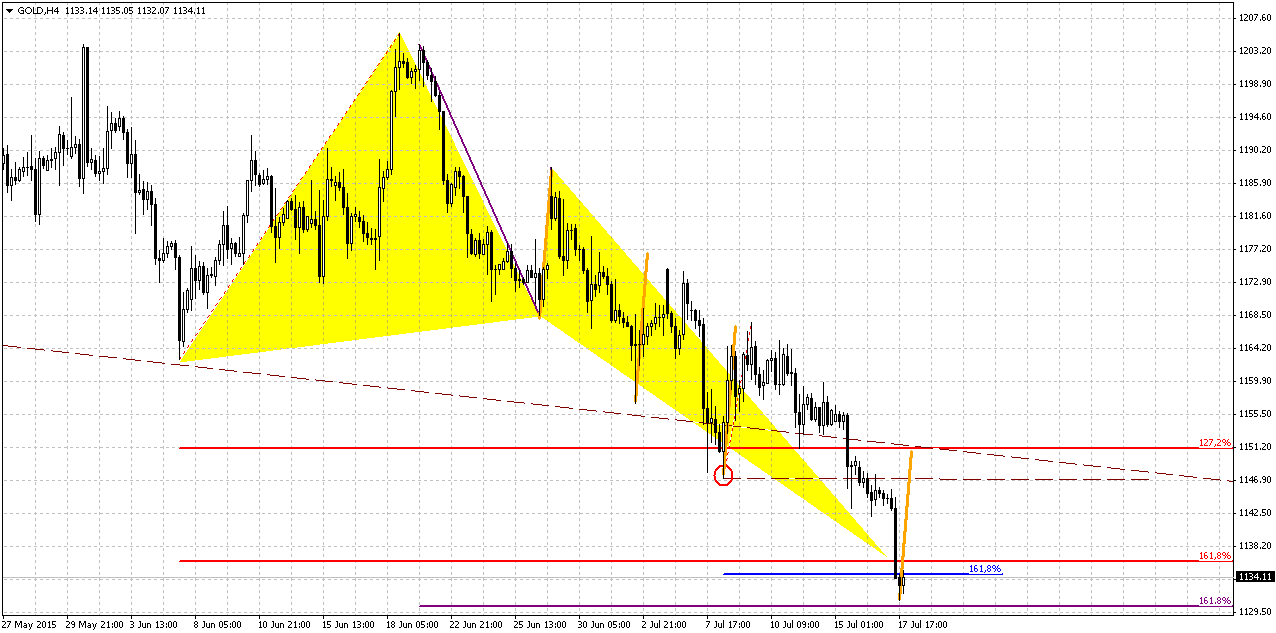
4-hour
On intraday chart market also has completed multiple patterns – two butterflies, and 1.618 AB=CD pattern. Chances on upside retracement look nice, but there is one unpleasant moment for the bulls – bearish acceleration on Friday. When market shows this kind of action right to 1.618 butterfly target – it significantly increases of butterfly failure. All in all situation is very thrilling and any motion around yearly key level will be important. Still, if retracement will finally happen, applying here harmonic swing, we could estimate that target of the bounce probably will be around 1145-1150 level – and coincides with broken lows and trend line.
Conclusion:
Long-term picture remains bearish and major patterns stand mostly intact. Our long-term target still stands at 1050-1080 area.
On short-term charts market stands at thrilling moment near yearly 1130 lows. Any fluctuation could become fatal. We suggest that gold could try to show upside retracement to 1145 area but this is just pause in downside action and a bit postpone breakout of 1130 lows.
The technical portion of Sive's analysis owes a great deal to Joe DiNapoli's methods, and uses a number of Joe's proprietary indicators. Please note that Sive's analysis is his own view of the market and is not endorsed by Joe DiNapoli or any related companies.
Weekly Gold Tading Report prepared by Sive Morten exclusively for ForexPeaceArmy.com
Reuters reports Gold fell to a five-year low on Friday, pressured by a strong dollar and expectations for a U.S. rate hike this year, and as China bought less than expected over the past six years.
Platinum fell below the key $1,000-an-ounce level for the first time in more than six years while palladium extended losses to hit its lowest since November 2012.
China's gold reserves were up 57 percent at the end of June, from the last time it adjusted its reserve figures more than six years ago, the central bank said. Despite the tonnage increase, gold now accounts for 1.65 percent of China's total forex reserves, against 1.8 percent in June 2009.
The reduced ratio suggested China will increase its bullion purchases, but the market focused elsewhere, traders said.
"The market's saying China's been buying gold but they bought a lot less than what they should have," said Phillip Streible, senior commodities broker for RJO Futures in Chicago.
Spot gold dropped 1.1 percent to its lowest since April 2010 at $1,130.70 an ounce and was last down 1 percent at $1,133.13. It was on track for a 2.6 percent weekly fall, the biggest since early March.
Spot platinum fell 1.4 percent to $991 an ounce, the lowest since February 2009.
"If the low figure is correct then that is actually very bullish because there is plenty of scope for continued buying for many years to come," said Ross Norman, chief executive of bullion brokerage Sharps Pixley in London, referring to China's gold reserves.
"The weakness we are seeing is related to the strength of the U.S. dollar," said Norbert Ruecker, head of commodity research at Julius Baer.
"Gold is finding a lot of headwinds from multiple sources: we have seen the Greek risk fade and the focus return to the U.S. and Janet Yellen," Saxo Bank Senior Manager Ole Hansen said.
Gold's 3 percent fall so far this year has failed to spur demand in top consumers in Asia with domestic prices in No. 2 market India remaining at a discount to global spot prices.
Recent CFTC data again shows increase in open interest but at this time growth was not as strong as previously. Speculative long positions slightly have contracted while shorts mostly stand the same. It will be interesting to look at CFTC next week and how data will change after Friday sell-off. It seems that changes should be significant in favor of bears.
SPDR fund has lost another 15 tonnes in storages. This is big fall for just one week. Now its storages stands at ~696 tonnes. So gold price drop was confirmed by real sell-off on the market.
That’s being said sentiment data mostly supports further downward action on gold market.
Here is detailed breakdown of speculative positions:
Open interest:
Technicals
Monthly
Last week shows some bearish activity and market finally has made visible motion according to our pattern. 1130 level has not been broken yet, but taking into consideration how close market stands – this is just the question of time. If even we will not get real breakout – W&R should happen with high probability.
In general gold stands rather flat on monthly chart within 4 months in a row. Currently bearish dynamic pressure becomes very clear on this chart and market finally has started action according to it. As bearish dynamic pressure as VOB pattern are still valid.
On long-term horizon we still have last big pattern in progress that is Volatility breakout (VOB). It suggests at least 0.618 AB-CD down. And this target is 1050$. At the same time we need 1130 breakout to start clearly speak on 1050 target.
But what action market should show to break huge bearish patterns on monthly? Dynamic pressure is a tendency of lower highs within bullish trend. Hence, to break it, market should show higher high. I’ve marked it with arrow. It means that market should take out 1308 top to break this pattern and make investors doubt on bearish perspectives of gold market in long term. Early bell of changing situation could be moving above YPP.
Overall picture still remains mostly bearish. In the beginning of the year market showed solid upside action. Gold was able to exceed yearly pivot, passed half way to Yearly Pivot resistance 1 but right now has reversed down and closed below YPP. From technical point of view this is bearish sign. This could be very significant moment and next logical destination will be yearly pivot support 1 around 1083$.
Fundamentally, gold mostly is hostage of dollar value and US economical data (mostly inflation) in nearest perspective. Approximately the same was announced by Fed in forecast on inflation and had become a reason of dovish approach to rate hiking. Despite that Yellen has given clear hints on rate hike this year, many investors treat this approach as dovish, since investors previously expected double rate hike till the end of the year. Also Fed every time tells about worrying sings on employment and structure of job market and weak inflation that barely has reached 2%.
If we will take into consideration geopolitical situation and risks that have appeared recently, it could happen that situation will change, but unfortunately the geopolitics is sphere where we can’t do much and this sphere stands beyond of our control.
That’s being said, as gold has passed through 1200 and until it stands below 1308 top, our long-term next destination point is previous lows at 1130, but if gold will return to 1130 for second time – this is temporal destination and we should prepare for further downward action. Particularly this action we have right now.
Weekly
Trend is bearish here. Since April trend mostly holds bullish (by MACD), but price action is not, gold can’t start upside action. This could be the sign of market’s weakness. Finally gold has shown some acceleration and dropped down recently. Multiple bearish grabbers have led price right to 1130 key level.
Market is not at oversold right now and, in fact, has no other supports except major 1130 lows. Here market forms multiple patterns and all of them have targets below 1130 level.
Our major one is still big butterfly. Speaking on targets, we have three different patterns that point on the same level. They are butterfly “buy”, AB=CD and the part of this AB-CD that takes “222” Sell shape (smaller most recent AB-CD).
Thus, all these patterns point at the same destination around 1080$. This level is special, because it coincides with YPS1. Acceleration probably should happen after 1130 breakout.
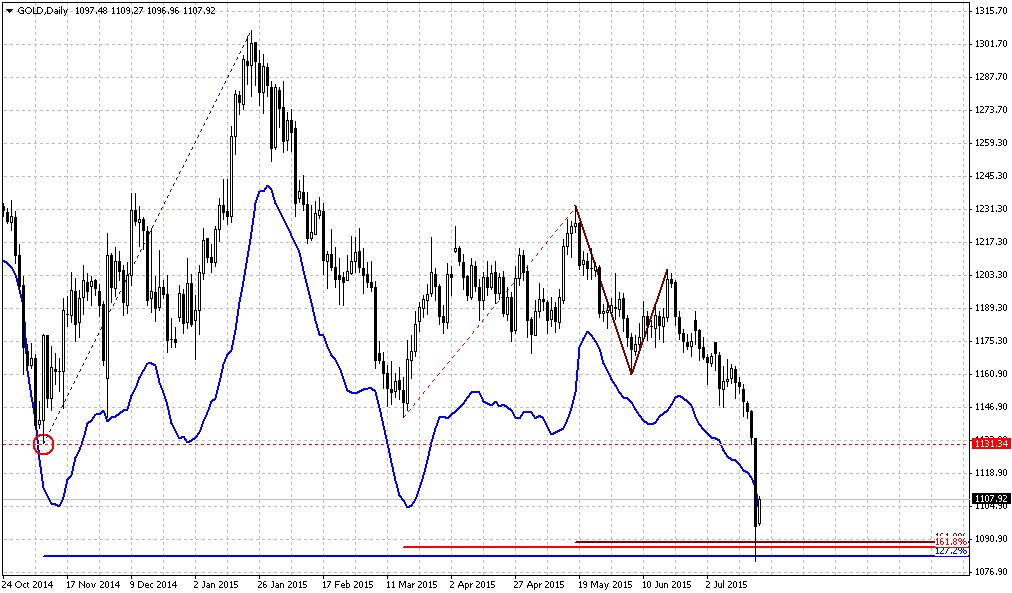
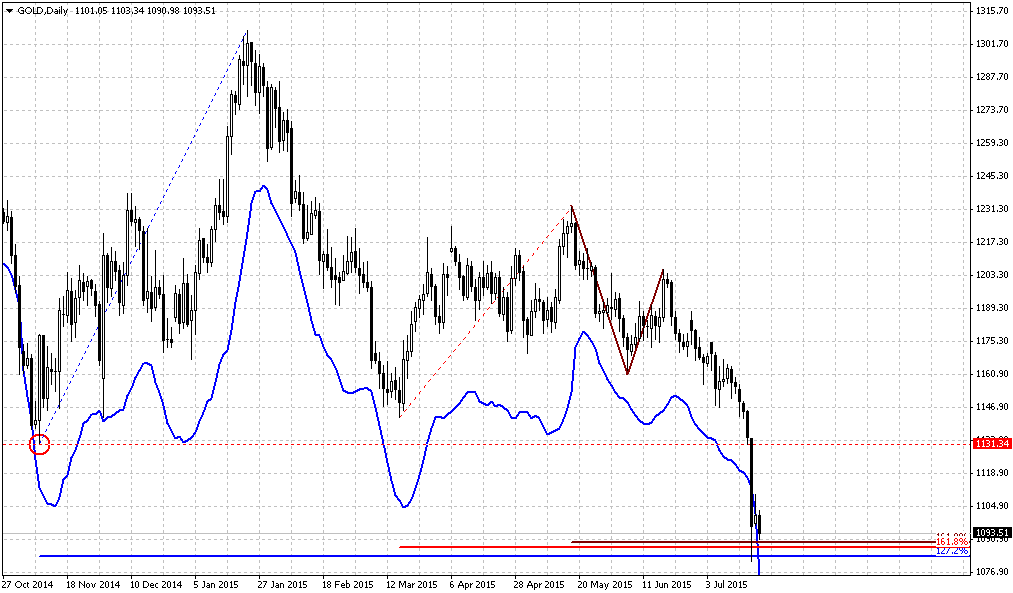
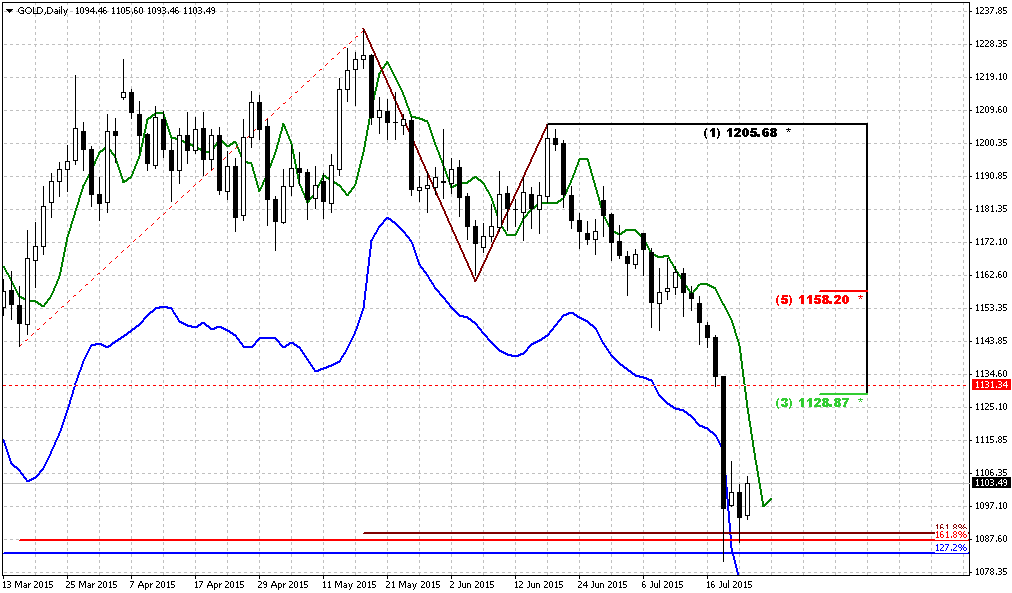
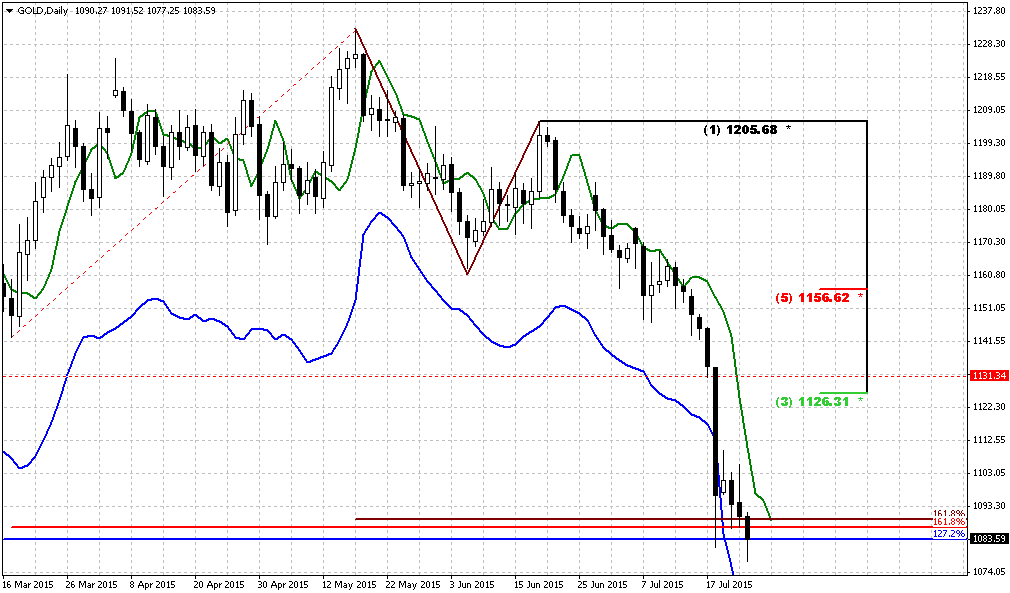
Daily
Trend is bearish on daily chart. Here we need to take in consideration couple of moments. First of all – take a look market is not at oversold and only support that it has here is former 1130 lows. Gold market has interesting feature, or better to say, couple ones. If market approaches to some important level, and 1130 lows are no doubts important one, it is almost never leaves it untouched. Other words speaking, gold as a rule clear out stops around important levels. Second feature, that is on as well-known as first one is “spurious retracement”. When gold comes close to important level it starts some retracement that looks like reversal and creates visibility of upside reversal. Investors turn on bull side, but later gold returns back, clear out stops as new traders who have stepped in just recently and stops below major level.
Now take a look at the chart. We could get the same situation right now. At the first glance market has completed downward AB=CD here and some retracement could happen. At the same time we have weekly targets and daily butterfly. AB=CD has finished right at 1130 level. So gold could start some upside retracement, but be careful – later it will return back with high probability. Following gold’s habit again – most probable target of this upside retracement could be broken trend line.
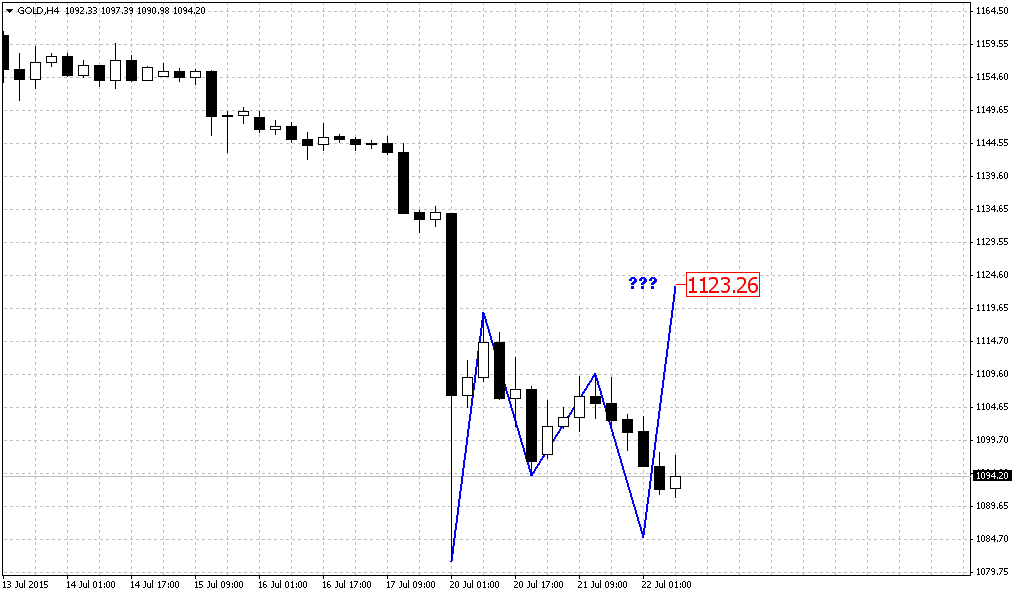
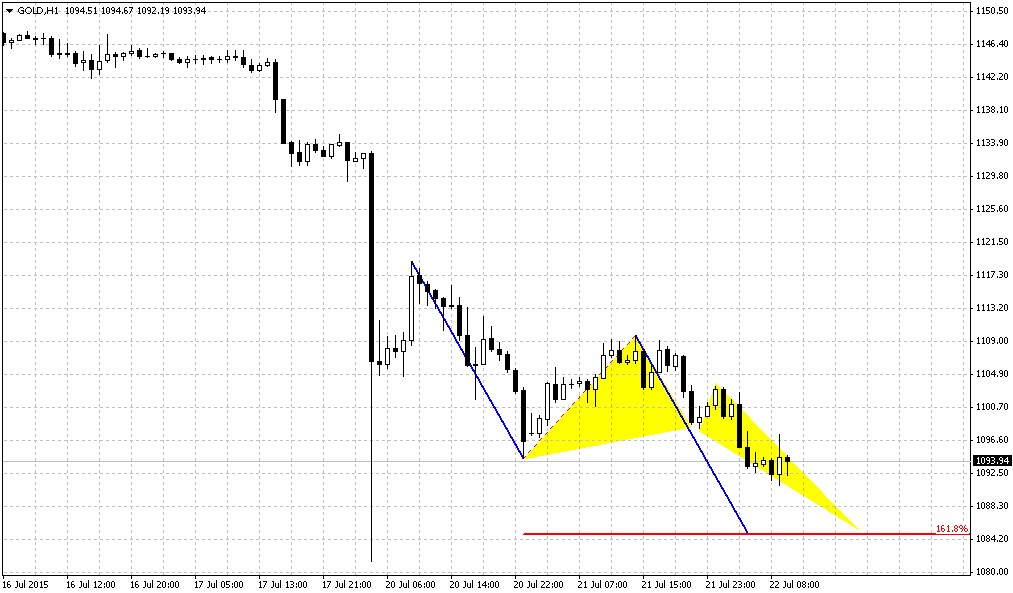
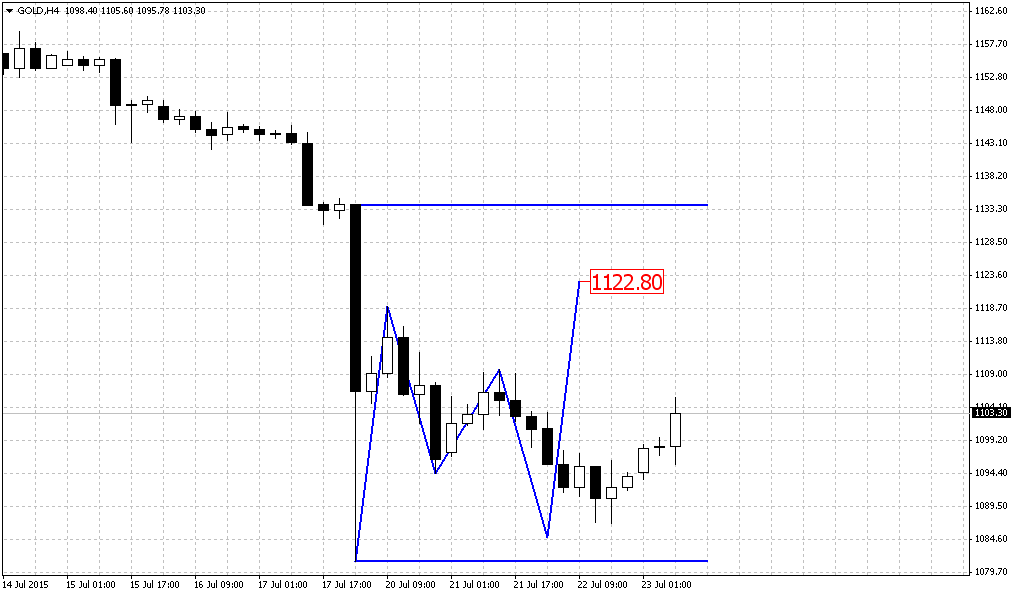
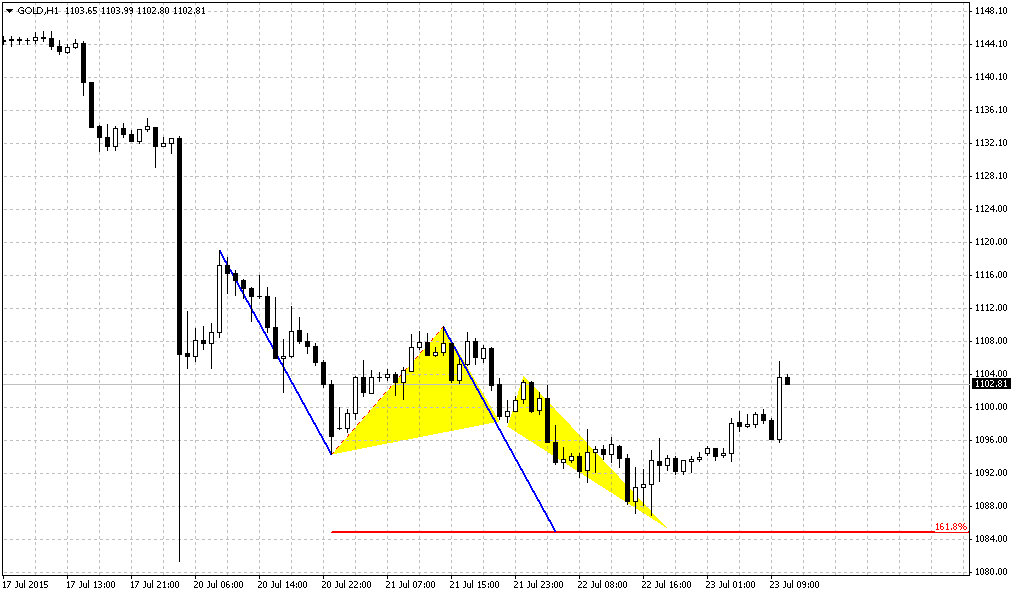
4-hour
On intraday chart market also has completed multiple patterns – two butterflies, and 1.618 AB=CD pattern. Chances on upside retracement look nice, but there is one unpleasant moment for the bulls – bearish acceleration on Friday. When market shows this kind of action right to 1.618 butterfly target – it significantly increases of butterfly failure. All in all situation is very thrilling and any motion around yearly key level will be important. Still, if retracement will finally happen, applying here harmonic swing, we could estimate that target of the bounce probably will be around 1145-1150 level – and coincides with broken lows and trend line.
Conclusion:
Long-term picture remains bearish and major patterns stand mostly intact. Our long-term target still stands at 1050-1080 area.
On short-term charts market stands at thrilling moment near yearly 1130 lows. Any fluctuation could become fatal. We suggest that gold could try to show upside retracement to 1145 area but this is just pause in downside action and a bit postpone breakout of 1130 lows.
The technical portion of Sive's analysis owes a great deal to Joe DiNapoli's methods, and uses a number of Joe's proprietary indicators. Please note that Sive's analysis is his own view of the market and is not endorsed by Joe DiNapoli or any related companies.