Sive Morten
Special Consultant to the FPA
- Messages
- 18,673
Fundamentals
Weekly Gold Tading Report prepared by Sive Morten exclusively for ForexPeaceArmy.com
Reuters reports Gold turned higher after sliding more than 1 percent to its lowest since early 2010 on Friday, as the dollar fell from its highs and U.S. stocks extended losses, but the precious metal was on track to see the biggest weekly decline since March.
"We had an excessive slide in the equity markets. We saw the dollar give up some of its earlier gains," said David Meger, director of metals trading for High Ridge Futures in Chicago, explaining reasons for the late-day bounce.
Prices have been under pressure since tumbling more than 3 percent in Asian trading hours on Monday in their biggest one-day drop in nearly two years, a selloff accompanied by heavy trading volumes in New York and Shanghai.
Gold has been hurt this year by expectations that the Federal Reserve is on track to raise interest rates for the first time in nearly a decade, boosting the opportunity cost of holding non-yielding bullion while lifting the dollar.
The Fed will hold its next meeting July 28-29.
"In the short term, investor sentiment is what actually moves prices," Capital Economics analyst Simona Gambarini said. "It's now likely that the Fed will hike rates this year, most likely in September ... (and) investors are already showing that in their positioning. They're becoming more bearish on gold."
The U.S. dollar pared gains against a basket of major currencies, while the euro fell on downbeat German and euro zone data. U.S. stocks extended losses late in the day.
As gold prices slumped this week, holdings of the world's biggest gold-backed exchange-traded fund, the SPDR Gold Trust , fell for a sixth day on Thursday to 684.6 tonnes, the lowest since September 2008. The fund is on track for its biggest weekly outflow since early May.
Physical demand in Asia remained lackluster amid modest premiums in top gold consumers India and China.
Gold is expected to struggle for the rest of this year, though platinum is expected to fight back, a Reuters poll showed on Friday.
What does gold have in common with iron ore and coal? All three are travelling down the same road of structural oversupply, softer demand growth and severe cost-cutting by their producers.
While exciting for gold watchers, Monday's mini flash crash, which sent the most-active U.S. gold futures contract to a five-year low of $1,088 an ounce in thin early Asian trade, is largely irrelevant, unless viewed against a wider backdrop.
The broad picture for gold is that since the spot price reached its peak of $1,920.30 an ounce in September 2011, demand has dropped as supply has risen.
More than anything else this simple dynamic explains why gold has now given up about half the gains of the decade long rally between 2001 and 2011.
Figures from Thomson Reuters GFMS show that in 2011 there was an overall deficit of 154.1 tonnes in the gold market, which fell to a deficit of 77.9 tonnes in 2012, then rose to a surplus of 248.7 tonnes in 2013 and 358.1 tonnes last year.
While not entirely to blame for the rising surplus in the market, mine supply has been on an upward trend, from 2,845.9 tonnes in 2011 to 3,129.4 tonnes last year, according to GFMS data.
Mine supply is now projected to start declining, to 3,124.7 tonnes this year, 3,057 tonnes in 2016 and 2,970.3 in 2017.
This largely reflects the closure of higher-cost operations and the scaling back of exploration expenditure in response to low prices, which curtails new projects.
GFMS uses a robust methodology and has a strong track record, but like all forecasters, it has to assume other factors remain equal, and this is why forecasting is generally fraught with risk.
COST CUTS LEAD TO LOWER PRICE
The main risk, from a supply perspective, is that miners are able to manage costs in such a way as to lower the industry's cost curve, allowing the price to fall in the absence of a demand-driven rally.
This is why gold may be experiencing a similar dynamic as iron ore and coal, even if it's not quite as far down the same road.
What we've seen in iron ore and coal is that the most common response by mining companies to falling prices for their commodities is to increase volumes and cut costs.
The thinking is that by lowering unit costs the company will be able to weather the period of low prices.
What has happened in practice is markets that were already oversupplied became more so, and the reductions in the industry cost curve simply allowed prices to fall by a similar amount.
Spot thermal coal at Australia's Newcastle port , a regional benchmark, has lost more than half its value since 2011, while spot iron ore has fared even worse, fetching just over a quarter of what it did at its record high in early 2011.
While gold has also fallen by almost 50 percent, the miners have been cushioned by fatter margins and it is only more recently that costs will have moved to the top of the list of concerns.
Like their iron ore and coal counterparts, gold mining executives probably thought for a long time that prices couldn't get any worse and that a demand-led recovery was just around the corner.
But in the absence of rising demand, gold miners will seek to cut costs, a process they have already started and will likely try to accelerate.
The all-in cost of producing gold dropped 23 percent to $1,331 an ounce in the year to March 2014, according to data from Citigroup.
If that sounds like an impressive decline, consider the latest announcements from some of the top gold mining companies.
Newmont Mining Corp's all-in sustaining cost for gold was $849 an ounce in the first quarter of this year, down from $1,034 for the same quarter last year.
Barrick Gold Corp had an all-in sustaining cost of $864 an ounce last year, lower than the $890-$920 the company had forecast.
Australia's Newcrest Mining had all-in costs of A$946 ($700) an ounce in the first quarter, down from A$963 for the same period in 2014.
These aren't unusual results and show that miners can, and will, cut costs before they trim output.
These are also figures for all-in sustaining costs, defined by the Minerals Council of Australia as designed to reflect the
"full marginal cost of gold mining", including ongoing capital expenditure, indirect costs and overheads.
While not viable in the long-term, certain costs within all-in sustaining costs can be discounted, thus allowing companies to continue production even if the operation is loss-making.
What iron ore and coal have shown is that this process can run for far longer than most analysts thought possible, and that miners can weather extreme amounts of financial pain before taking the last step in a painful process, namely shutting down.
There may well be reasons why gold prices will stop declining and rally from this point, but the cost of mine supply isn't likely to be one of them.
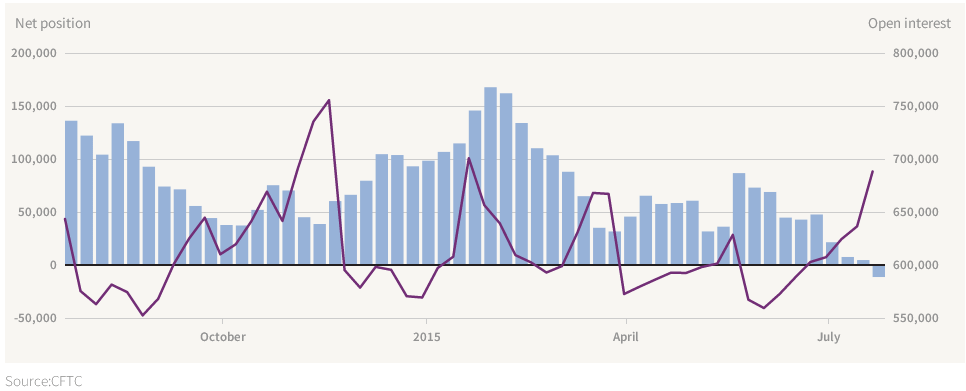
Last week we have very bright CFTC data. Net gold position turns bearish for the first time within recent 5 years, or even longer. SPDR storages have fallen to 680 tonnes – huge drop for just one week. COT report shows classical clear picture of bears’ domination – strong open interest growth with simultaneous drop in long positions. At the same time long-to-shorts stands around 50/50 and has huge potential for further increase in short positions. Thus, sentiment data mostly supports bearish trend – gold is dropping on solid volumes.
Here is detailed breakdown of speculative positions:
Open interest:
 Shorts:
 Longs:
 Summary:
Technicals
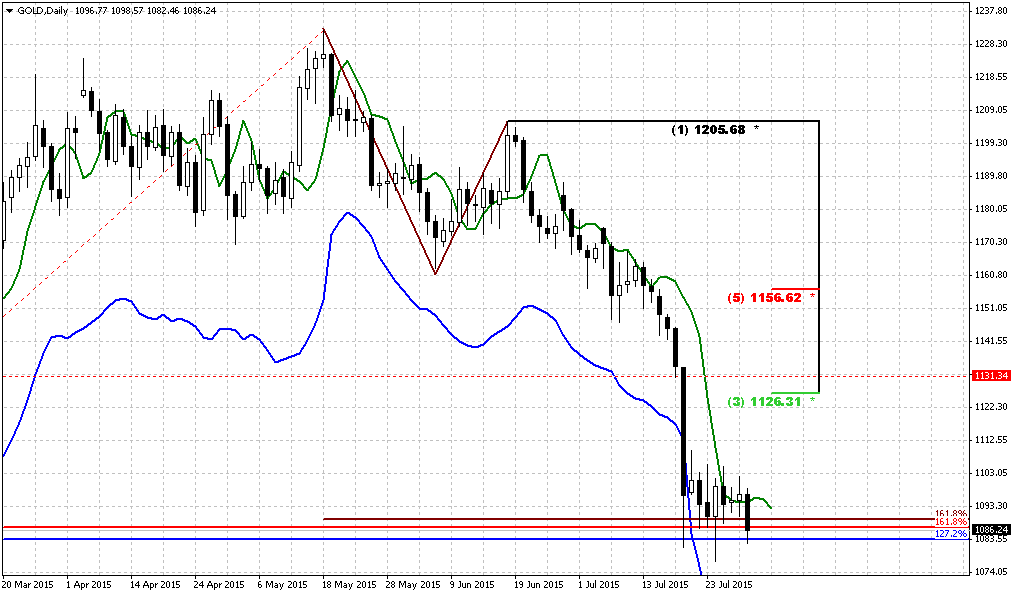
Monthly
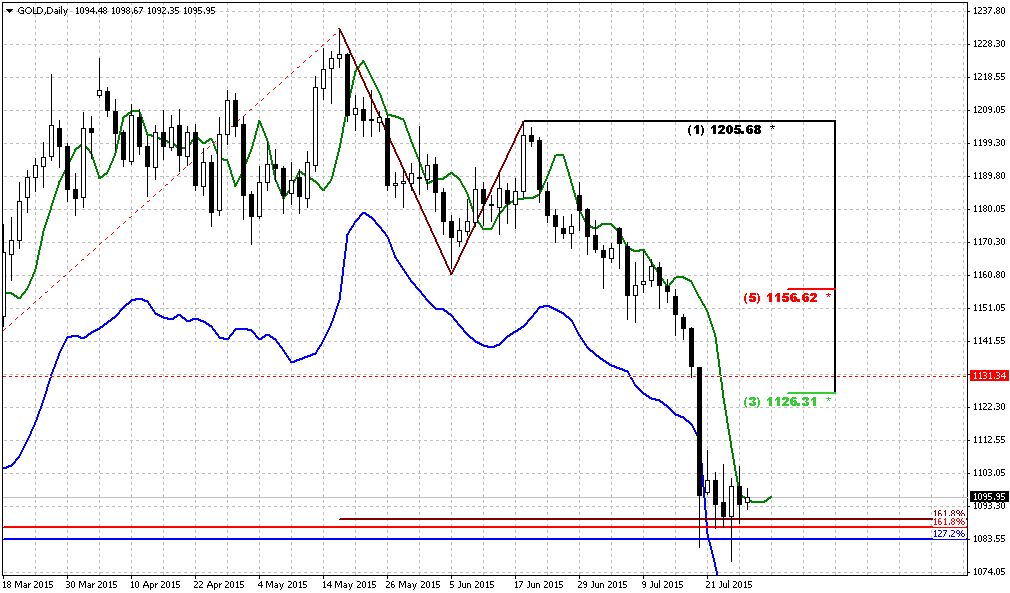
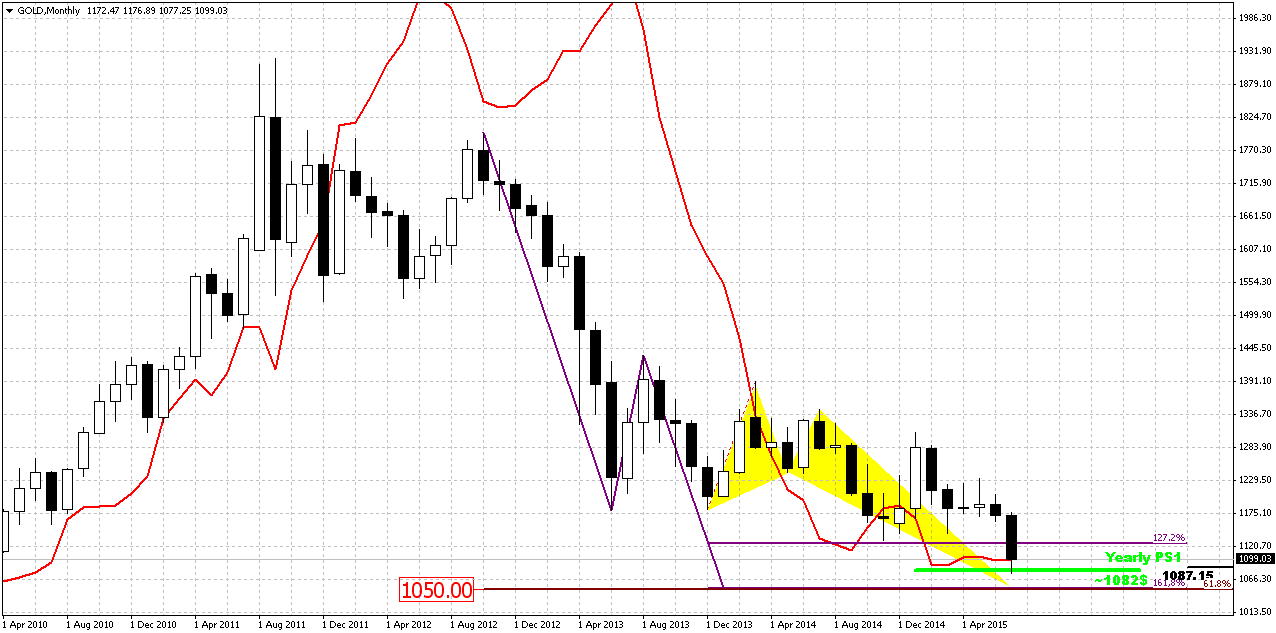
In last two weeks market shows outstanding bearish action and finally has completed one of our long-term targets – 1080. So currently we could say that monthly bearish dynamic pressure pattern has hit its minimal target. It does not mean that market can’t go down further, it just means that if market suddenly will turn up – dynamic pressure should be treated as “completed”.
So, now we have just one long-term pattern in progress that has not achieved it’s target yet. This is VOB pattern. It suggests at least 0.618 AB-CD down. And this target is 1050$. Taking into consideration CFTC data and the fact that 1050 is just 30 bucks lower, it seems that hardly it will be problem for market to reach it.
We also have got completed pivot points framework target. Again it has confirmed its reliability. Once we’ve said that in the beginning of the year market showed solid upside action. Gold was able to exceed yearly pivot, passed half way to Yearly Pivot resistance 1 but right now has reversed down and closed below YPP. From technical point of view this is bearish sign and market has hit next destination point of this analysis –yearly pivot support 1 around 1083$.
Above we’ve placed article concerning relation between gold price and mine companies and it uncover myths about possible gold drop. Many analysts tell that gold can’t drop below 1000 $ since it is middle mining expenses of gold. But text above shed some lights on this question and tells that it is not quite so and gold could drop even to 800 or even lower before this relation of price and extraction costs will impact market. Thus, although our next target stands at 1050$, our mind should be open to any scenario and even to possible further drop of gold price. May be this will not happen, but if our analysis will give us clear signs and patterns that this should happen, we should not be stubborn and ignore this scenario.
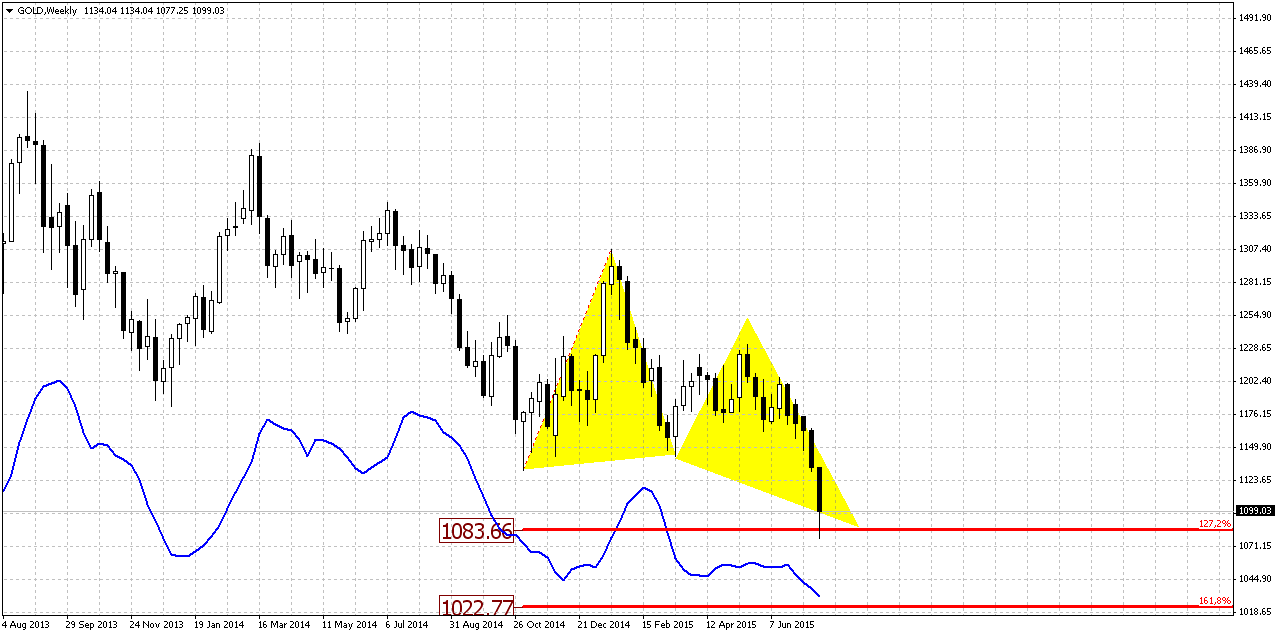
Weekly
Trend is bearish here. Weekly setup has worked at 100%. Market has hit 1080 target. Still this is just first destination of butterfly – 1.27 extension. As we see acceleration right this level, there are big chances that market will go to next one – 1.618 around 1025 area.
At the same time, as market right now stands at strong support, chances on short-term upside bounce still exist.
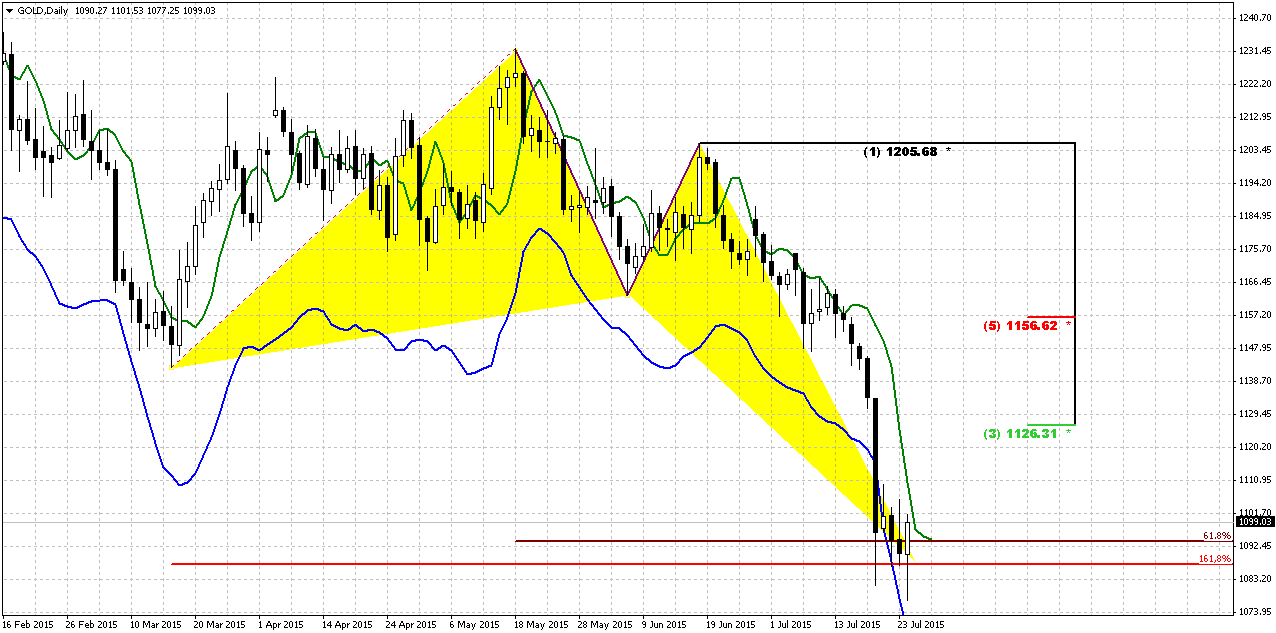
Daily
Trend is bearish on daily chart. This picture is most useful for short-term trading. It shows that gold also stands at oversold, butterfly and inner AB-CD 1.618 targets. So, as a result we have impressive gathering of supports of different kind. Since gold mostly stands tight in recent four sessions, thoughts that we’ve discussed are still the same. As we haven’t got any significant breakout lower – chances on upside technical bounce exist. There will not be any fundamental background with it, it will be mostly technical issue.
We expect that gold could re-test previously broken important 1130 lows. As a result we could get some DiNapoli directional pattern and preferably it would be B&B “Sell”. So, short-term conclusion – it is too early to go short, since market at strong support and oversold. Scalp traders could thing about going long as soon as we will get bullish reversal patterns on intraday charts, but with very close target – 1126-1130.
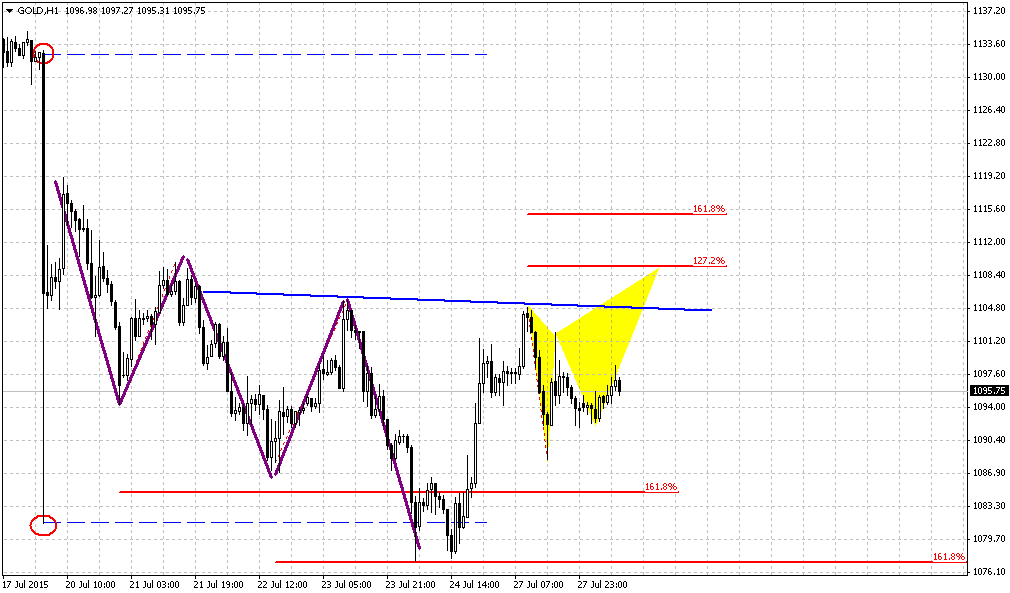
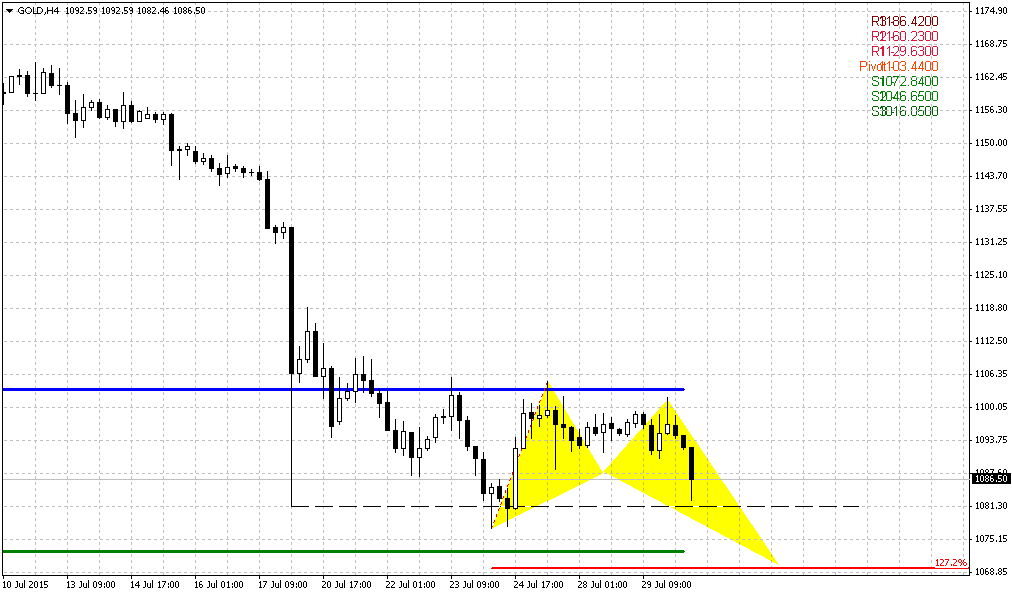
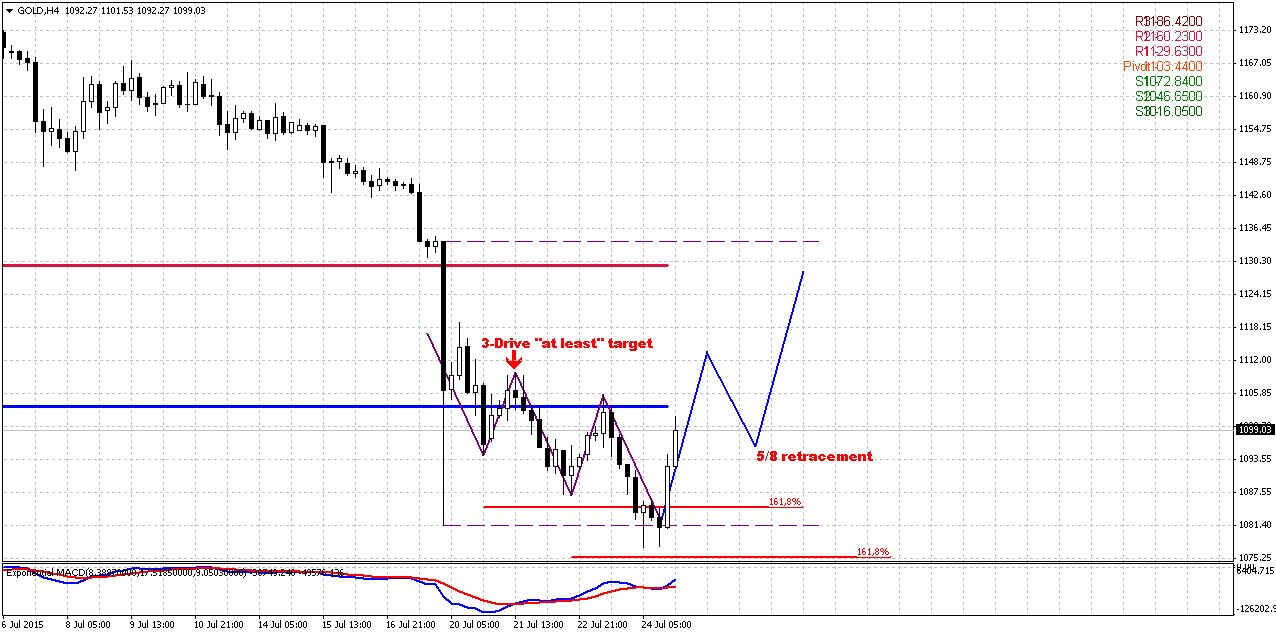
4-hour
Here guys, we would like to show you one of possible scenarios how upside retracement could happen. Actually, we already have reversal pattern that is 1.618 3-Drive “Buy” and it is already stands in progress. Those who were able to recognize it in time are good guys, others – don’t be upset, but do not join 3-Drive either, wait for retracement.
So, if 3-Drive leads market to the target, then 2nd drive should be taken out. This, in turn will lead to appearing of so-called upside reversal swing. Odds suggest that after any reversal swing deep retracement should happen, since bearish momentum is still strong here. So, market should show 5/8 retracement, may be of AB=CD shape. This will be our primary moment for taking long position (if of cause you trade on intraday charts). After that market could form AB=CD upside continuation that should lead price to our 1126-1130 area. Also we have nice MACD bullish divergence right at daily strong (!) support.
Also it is interesting that the top of huge black candle coincides with 1130 lows. Whatever re-testing will happen – action will stay inside black candle and this is good for bearish continuation. This is in fact our major expectation (B&B on daily, remember?).
Conclusion:
Long-term picture remains bearish and we do not see any serious headwinds for further downward continuation. 1050 is probably nearest perspective that we could imagine, because gold really could drop even lower.
On short-term charts market stands at strong support that could launch short-term technical bounce to 1130 area. Daily traders should watch daily bearish setups such as B&B “Sell”, while scalpers could also think about taking long position with the same target 1126-1130.
The technical portion of Sive's analysis owes a great deal to Joe DiNapoli's methods, and uses a number of Joe's proprietary indicators. Please note that Sive's analysis is his own view of the market and is not endorsed by Joe DiNapoli or any related companies.
Weekly Gold Tading Report prepared by Sive Morten exclusively for ForexPeaceArmy.com
Reuters reports Gold turned higher after sliding more than 1 percent to its lowest since early 2010 on Friday, as the dollar fell from its highs and U.S. stocks extended losses, but the precious metal was on track to see the biggest weekly decline since March.
"We had an excessive slide in the equity markets. We saw the dollar give up some of its earlier gains," said David Meger, director of metals trading for High Ridge Futures in Chicago, explaining reasons for the late-day bounce.
Prices have been under pressure since tumbling more than 3 percent in Asian trading hours on Monday in their biggest one-day drop in nearly two years, a selloff accompanied by heavy trading volumes in New York and Shanghai.
Gold has been hurt this year by expectations that the Federal Reserve is on track to raise interest rates for the first time in nearly a decade, boosting the opportunity cost of holding non-yielding bullion while lifting the dollar.
The Fed will hold its next meeting July 28-29.
"In the short term, investor sentiment is what actually moves prices," Capital Economics analyst Simona Gambarini said. "It's now likely that the Fed will hike rates this year, most likely in September ... (and) investors are already showing that in their positioning. They're becoming more bearish on gold."
The U.S. dollar pared gains against a basket of major currencies, while the euro fell on downbeat German and euro zone data. U.S. stocks extended losses late in the day.
As gold prices slumped this week, holdings of the world's biggest gold-backed exchange-traded fund, the SPDR Gold Trust , fell for a sixth day on Thursday to 684.6 tonnes, the lowest since September 2008. The fund is on track for its biggest weekly outflow since early May.
Physical demand in Asia remained lackluster amid modest premiums in top gold consumers India and China.
Gold is expected to struggle for the rest of this year, though platinum is expected to fight back, a Reuters poll showed on Friday.
What does gold have in common with iron ore and coal? All three are travelling down the same road of structural oversupply, softer demand growth and severe cost-cutting by their producers.
While exciting for gold watchers, Monday's mini flash crash, which sent the most-active U.S. gold futures contract to a five-year low of $1,088 an ounce in thin early Asian trade, is largely irrelevant, unless viewed against a wider backdrop.
The broad picture for gold is that since the spot price reached its peak of $1,920.30 an ounce in September 2011, demand has dropped as supply has risen.
More than anything else this simple dynamic explains why gold has now given up about half the gains of the decade long rally between 2001 and 2011.
Figures from Thomson Reuters GFMS show that in 2011 there was an overall deficit of 154.1 tonnes in the gold market, which fell to a deficit of 77.9 tonnes in 2012, then rose to a surplus of 248.7 tonnes in 2013 and 358.1 tonnes last year.
While not entirely to blame for the rising surplus in the market, mine supply has been on an upward trend, from 2,845.9 tonnes in 2011 to 3,129.4 tonnes last year, according to GFMS data.
Mine supply is now projected to start declining, to 3,124.7 tonnes this year, 3,057 tonnes in 2016 and 2,970.3 in 2017.
This largely reflects the closure of higher-cost operations and the scaling back of exploration expenditure in response to low prices, which curtails new projects.
GFMS uses a robust methodology and has a strong track record, but like all forecasters, it has to assume other factors remain equal, and this is why forecasting is generally fraught with risk.
COST CUTS LEAD TO LOWER PRICE
The main risk, from a supply perspective, is that miners are able to manage costs in such a way as to lower the industry's cost curve, allowing the price to fall in the absence of a demand-driven rally.
This is why gold may be experiencing a similar dynamic as iron ore and coal, even if it's not quite as far down the same road.
What we've seen in iron ore and coal is that the most common response by mining companies to falling prices for their commodities is to increase volumes and cut costs.
The thinking is that by lowering unit costs the company will be able to weather the period of low prices.
What has happened in practice is markets that were already oversupplied became more so, and the reductions in the industry cost curve simply allowed prices to fall by a similar amount.
Spot thermal coal at Australia's Newcastle port , a regional benchmark, has lost more than half its value since 2011, while spot iron ore has fared even worse, fetching just over a quarter of what it did at its record high in early 2011.
While gold has also fallen by almost 50 percent, the miners have been cushioned by fatter margins and it is only more recently that costs will have moved to the top of the list of concerns.
Like their iron ore and coal counterparts, gold mining executives probably thought for a long time that prices couldn't get any worse and that a demand-led recovery was just around the corner.
But in the absence of rising demand, gold miners will seek to cut costs, a process they have already started and will likely try to accelerate.
The all-in cost of producing gold dropped 23 percent to $1,331 an ounce in the year to March 2014, according to data from Citigroup.
If that sounds like an impressive decline, consider the latest announcements from some of the top gold mining companies.
Newmont Mining Corp's all-in sustaining cost for gold was $849 an ounce in the first quarter of this year, down from $1,034 for the same quarter last year.
Barrick Gold Corp had an all-in sustaining cost of $864 an ounce last year, lower than the $890-$920 the company had forecast.
Australia's Newcrest Mining had all-in costs of A$946 ($700) an ounce in the first quarter, down from A$963 for the same period in 2014.
These aren't unusual results and show that miners can, and will, cut costs before they trim output.
These are also figures for all-in sustaining costs, defined by the Minerals Council of Australia as designed to reflect the
"full marginal cost of gold mining", including ongoing capital expenditure, indirect costs and overheads.
While not viable in the long-term, certain costs within all-in sustaining costs can be discounted, thus allowing companies to continue production even if the operation is loss-making.
What iron ore and coal have shown is that this process can run for far longer than most analysts thought possible, and that miners can weather extreme amounts of financial pain before taking the last step in a painful process, namely shutting down.
There may well be reasons why gold prices will stop declining and rally from this point, but the cost of mine supply isn't likely to be one of them.
Last week we have very bright CFTC data. Net gold position turns bearish for the first time within recent 5 years, or even longer. SPDR storages have fallen to 680 tonnes – huge drop for just one week. COT report shows classical clear picture of bears’ domination – strong open interest growth with simultaneous drop in long positions. At the same time long-to-shorts stands around 50/50 and has huge potential for further increase in short positions. Thus, sentiment data mostly supports bearish trend – gold is dropping on solid volumes.
Here is detailed breakdown of speculative positions:
Open interest:
Technicals
Monthly
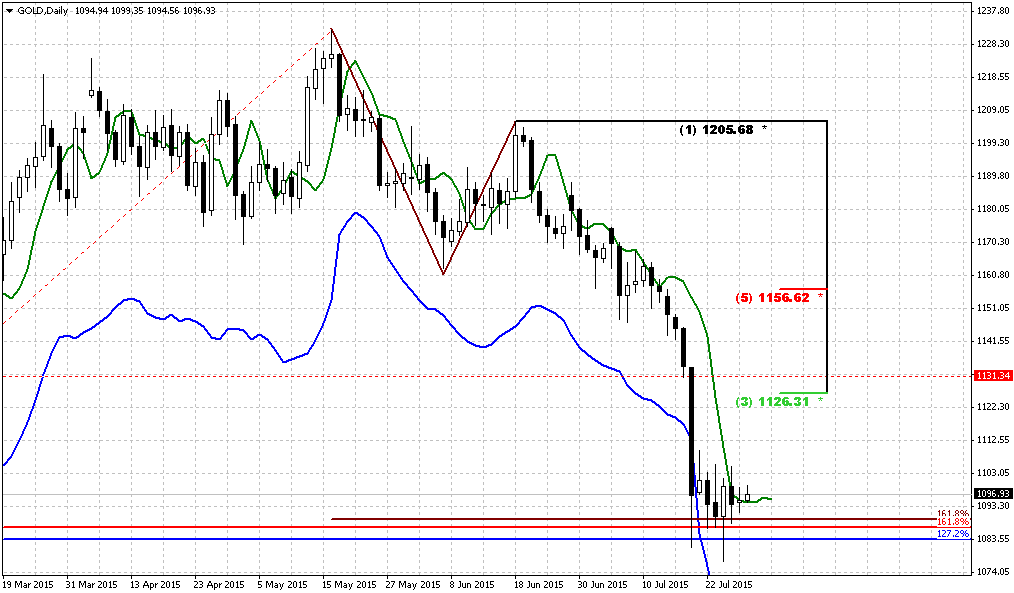
In last two weeks market shows outstanding bearish action and finally has completed one of our long-term targets – 1080. So currently we could say that monthly bearish dynamic pressure pattern has hit its minimal target. It does not mean that market can’t go down further, it just means that if market suddenly will turn up – dynamic pressure should be treated as “completed”.
So, now we have just one long-term pattern in progress that has not achieved it’s target yet. This is VOB pattern. It suggests at least 0.618 AB-CD down. And this target is 1050$. Taking into consideration CFTC data and the fact that 1050 is just 30 bucks lower, it seems that hardly it will be problem for market to reach it.
We also have got completed pivot points framework target. Again it has confirmed its reliability. Once we’ve said that in the beginning of the year market showed solid upside action. Gold was able to exceed yearly pivot, passed half way to Yearly Pivot resistance 1 but right now has reversed down and closed below YPP. From technical point of view this is bearish sign and market has hit next destination point of this analysis –yearly pivot support 1 around 1083$.
Above we’ve placed article concerning relation between gold price and mine companies and it uncover myths about possible gold drop. Many analysts tell that gold can’t drop below 1000 $ since it is middle mining expenses of gold. But text above shed some lights on this question and tells that it is not quite so and gold could drop even to 800 or even lower before this relation of price and extraction costs will impact market. Thus, although our next target stands at 1050$, our mind should be open to any scenario and even to possible further drop of gold price. May be this will not happen, but if our analysis will give us clear signs and patterns that this should happen, we should not be stubborn and ignore this scenario.
Weekly
Trend is bearish here. Weekly setup has worked at 100%. Market has hit 1080 target. Still this is just first destination of butterfly – 1.27 extension. As we see acceleration right this level, there are big chances that market will go to next one – 1.618 around 1025 area.
At the same time, as market right now stands at strong support, chances on short-term upside bounce still exist.
Daily
Trend is bearish on daily chart. This picture is most useful for short-term trading. It shows that gold also stands at oversold, butterfly and inner AB-CD 1.618 targets. So, as a result we have impressive gathering of supports of different kind. Since gold mostly stands tight in recent four sessions, thoughts that we’ve discussed are still the same. As we haven’t got any significant breakout lower – chances on upside technical bounce exist. There will not be any fundamental background with it, it will be mostly technical issue.
We expect that gold could re-test previously broken important 1130 lows. As a result we could get some DiNapoli directional pattern and preferably it would be B&B “Sell”. So, short-term conclusion – it is too early to go short, since market at strong support and oversold. Scalp traders could thing about going long as soon as we will get bullish reversal patterns on intraday charts, but with very close target – 1126-1130.
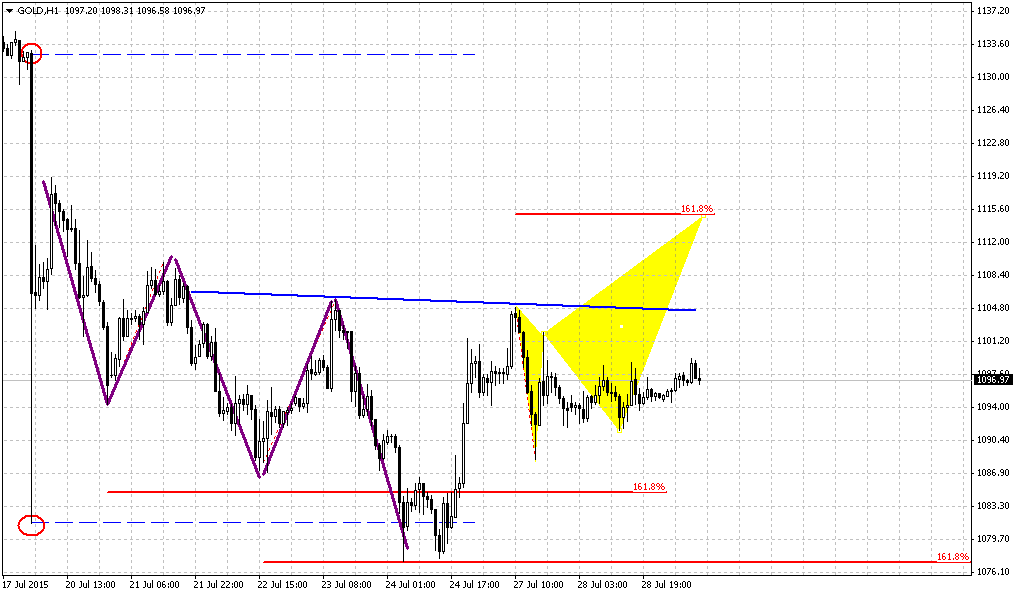
4-hour
Here guys, we would like to show you one of possible scenarios how upside retracement could happen. Actually, we already have reversal pattern that is 1.618 3-Drive “Buy” and it is already stands in progress. Those who were able to recognize it in time are good guys, others – don’t be upset, but do not join 3-Drive either, wait for retracement.
So, if 3-Drive leads market to the target, then 2nd drive should be taken out. This, in turn will lead to appearing of so-called upside reversal swing. Odds suggest that after any reversal swing deep retracement should happen, since bearish momentum is still strong here. So, market should show 5/8 retracement, may be of AB=CD shape. This will be our primary moment for taking long position (if of cause you trade on intraday charts). After that market could form AB=CD upside continuation that should lead price to our 1126-1130 area. Also we have nice MACD bullish divergence right at daily strong (!) support.
Also it is interesting that the top of huge black candle coincides with 1130 lows. Whatever re-testing will happen – action will stay inside black candle and this is good for bearish continuation. This is in fact our major expectation (B&B on daily, remember?).
Conclusion:
Long-term picture remains bearish and we do not see any serious headwinds for further downward continuation. 1050 is probably nearest perspective that we could imagine, because gold really could drop even lower.
On short-term charts market stands at strong support that could launch short-term technical bounce to 1130 area. Daily traders should watch daily bearish setups such as B&B “Sell”, while scalpers could also think about taking long position with the same target 1126-1130.
The technical portion of Sive's analysis owes a great deal to Joe DiNapoli's methods, and uses a number of Joe's proprietary indicators. Please note that Sive's analysis is his own view of the market and is not endorsed by Joe DiNapoli or any related companies.