Sive Morten
Special Consultant to the FPA
- Messages
- 18,673
As Reuters reports, Gold rose on Friday, rebounding from the previous session's drop to a one-month low, as heightened tensions between Russia and the West over Ukraine prompted speculators to buy back their bearish bets ahead of the weekend. For the week, however, bullion posted a near 1-percent drop, its second consecutive weekly decline, as encouraging recent U.S. economic indicators lessened the metal's safe-haven appeal.
Gold prices climbed as Russia said the United States was trying to influence international opinion through unfounded insinuations and anti-Russian rhetoric over the crisis in Ukraine, while the Pentagon said the transfer of rocket systems from Russia to Ukrainian separatists appeared to be imminent.
"With the news flow coming out Russia and Ukraine and you don't know what's going to happen in Iraq, traders are buying gold as they don't want to get too exposed to geopolitical risks going into the weekend," said Robert Haworth, senior investment strategist at U.S. Bank Wealth Management's Private Client Reserve.
Weaker U.S. equities dragged by bellwether online retailer Amazon also lifted gold prices. The market awaited the release of July U.S. non-farm payrolls and the Federal Open Market Committee meeting, both scheduled for next week. Gold was down 0.7 percent this week, extending the previous week's 2 percent fall, mostly on speculation that an improving employment sector in the United States could signal an early rate increase by the Federal Reserve.
As a gauge of investor sentiment, holdings of the SPDR Gold Trust, the world's largest gold-backed exchange-traded fund, fell 3.6 tonnes on Thursday - the biggest one-day drop in more than a month.
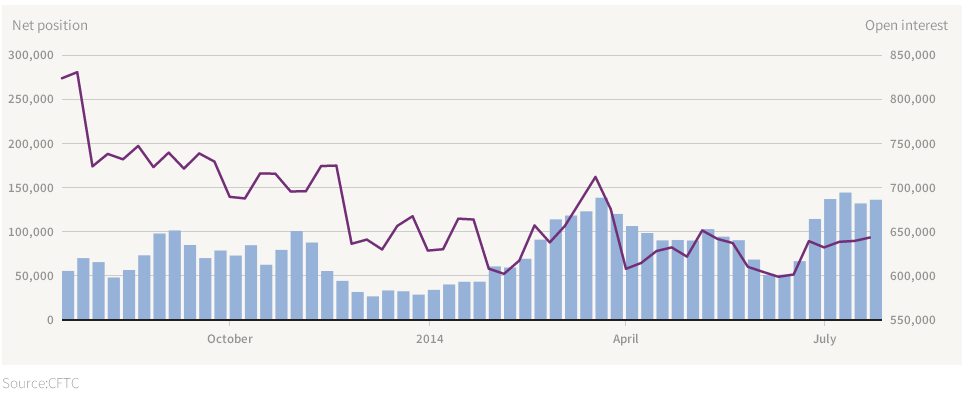 Well recent CFTC data shows nothing really new and significant. As OI as Net position stand flat at the FOMC meeting eve.
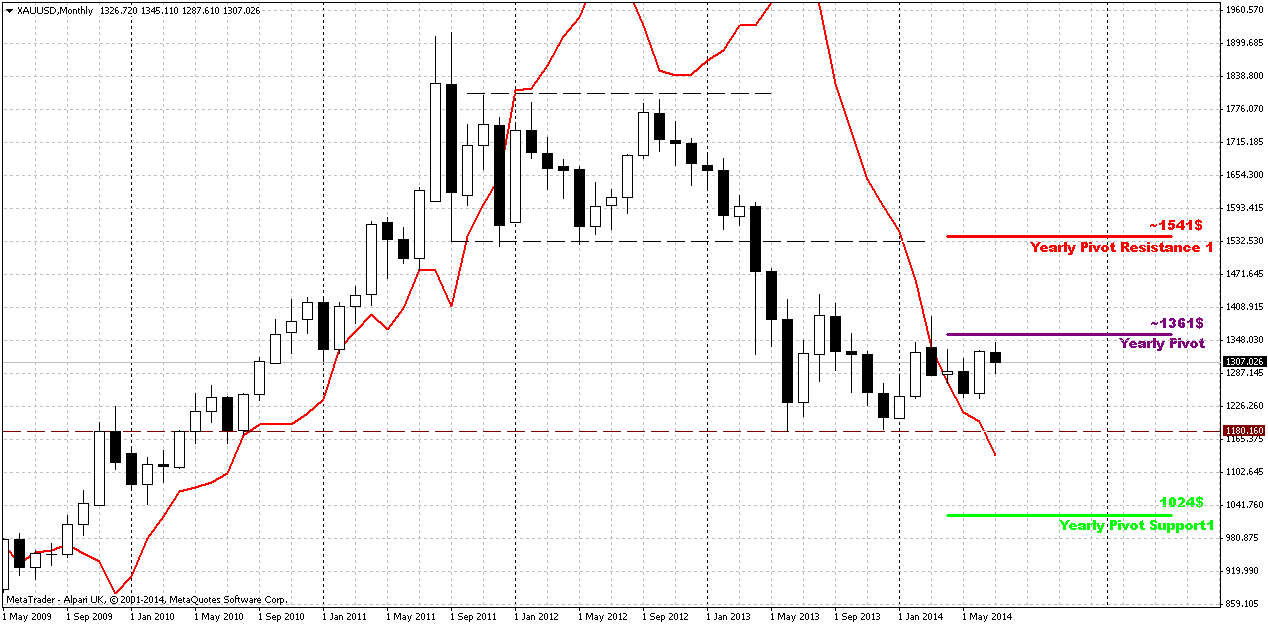
Monthly
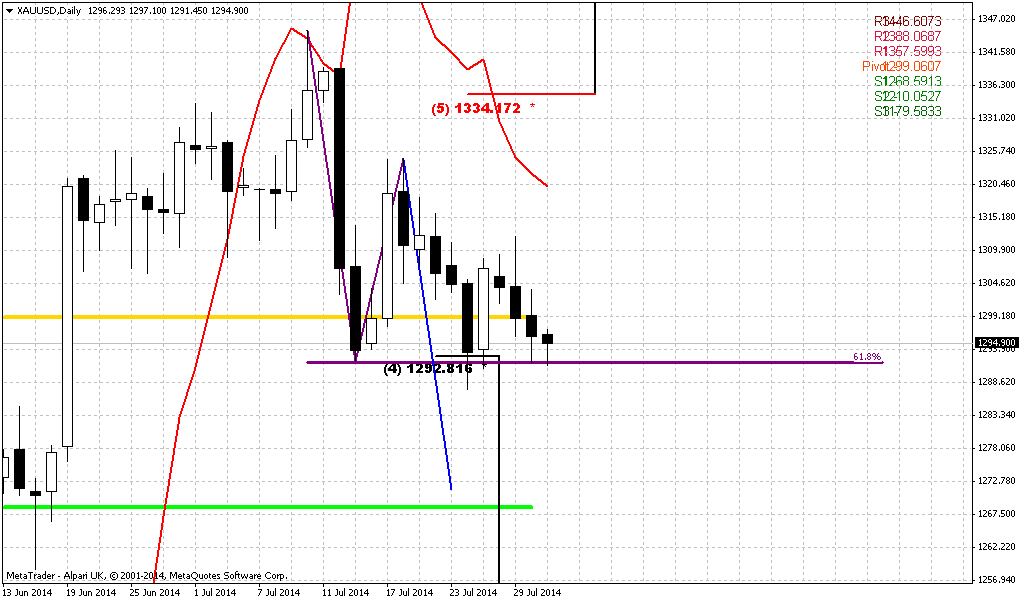
Recent market mostly shows flat action, long term picture changes slowly. Despite solid upward action our bearish grabber is still valid and price should pass solid distance to change situation drastically. Situation could change only if market will move above 1400 area.
Right now gold stands under pressure of perpsectives of USD strength – good economy data first, that right now is confirmed by US companies earning reports, expectations on Fed more hawkish assessement of perspectives and finally, week physical demand – all these moments prevent gold appreciation. The only factor that could support gold somehow is gepolitical tensions. Previously we have turmoil in Iraq and Ukraine, now Israel and Palestine added.
Grabber pattern is important, but June, and especially July has blocked gradual downward action and white candles break the bearish harmony of recent action. Next upside important level is 1360 – Yearly pivot point. If market will move above it (not neccesary it will happen in July) – this could be an indication that gold will continue move higher and this really could become a breaking moment on gold market. Otherwise, grabber will be valid and potentially could lead price back at least to 1180 lows again.
That’s being said, situation on the monthly chart does not suggest yet taking long-term positions on gold, since everything could change on coming week. Still, fundamental picture is moderately bearish in long-term. Possible sanctions from EU and US could hurt their own economies (especially EU). Many analysts already have started to talk about it. It means that economies will start to loose upside pace and inflation will remain anemic. In such situations investors mostly invest in interest-bear assets, such as bonds. Inflation also will be depressed and this is negative sign for gold.
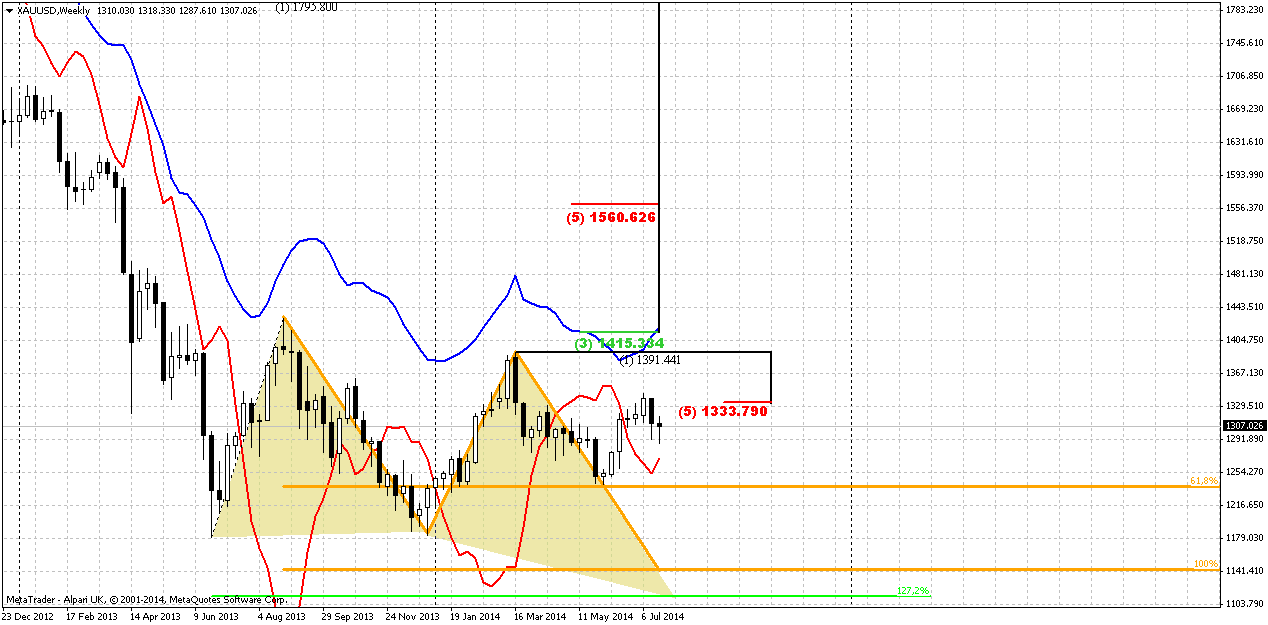
Weekly
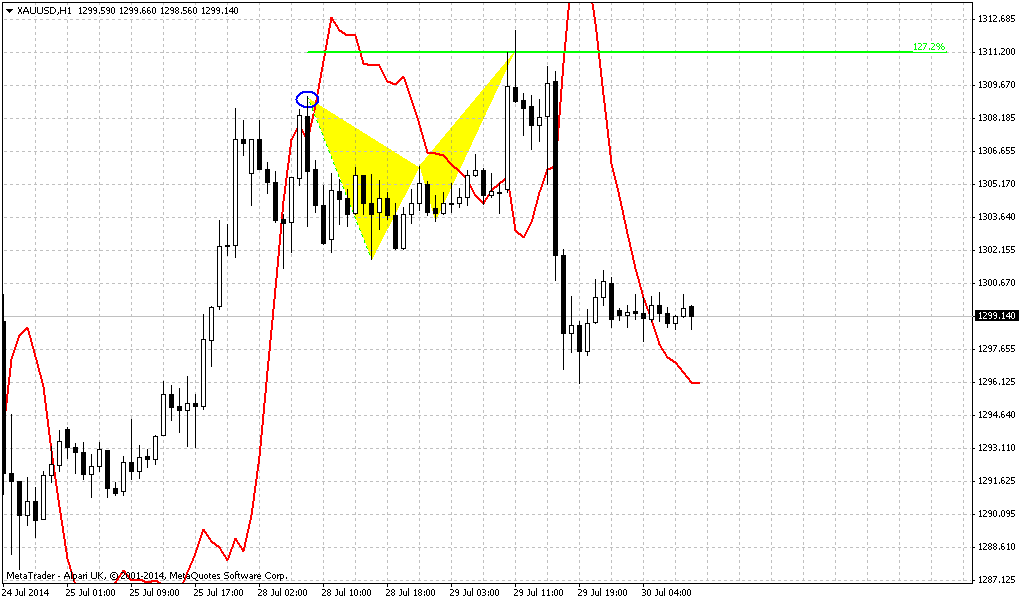
Due to solid events that we expect at the end of coming week, long-term picture does not change. As we’ve said previously - in nearest couple of week the major question will be whether gold will hold above 1335 or not. And now we stand at hot point. Usually reaching of minor target does not suggest deep retracement. If market is really bearish it should continue move down soon and 1335 level – 5/8 Fib resistance will become the last edge. Retracement above 5/8 level will be too deep for minor bounce after reaching just minor AB=CD target. Spot traders tell that as soon as market reaches this area – buying volume starts to decline significantly and this is also confirmed by recent CFTC data. Although on previous week market has shown not bad bounce down, but it still stands relatively close to 1335-1340 area and everything still could change.
It is difficult to comment just small new candle on weekly chart. We know that 5/8 resistance at 1335 is crucial for us and market already has confirmed it by downside action. Thus, we probably could say that the recent top is invalidation point for bearish setup in short-term perspective. Market should re-start move down or bearish trend or AB=CD pattern will be broken. In this case market theoretically could form butterfly “Sell” pattern.
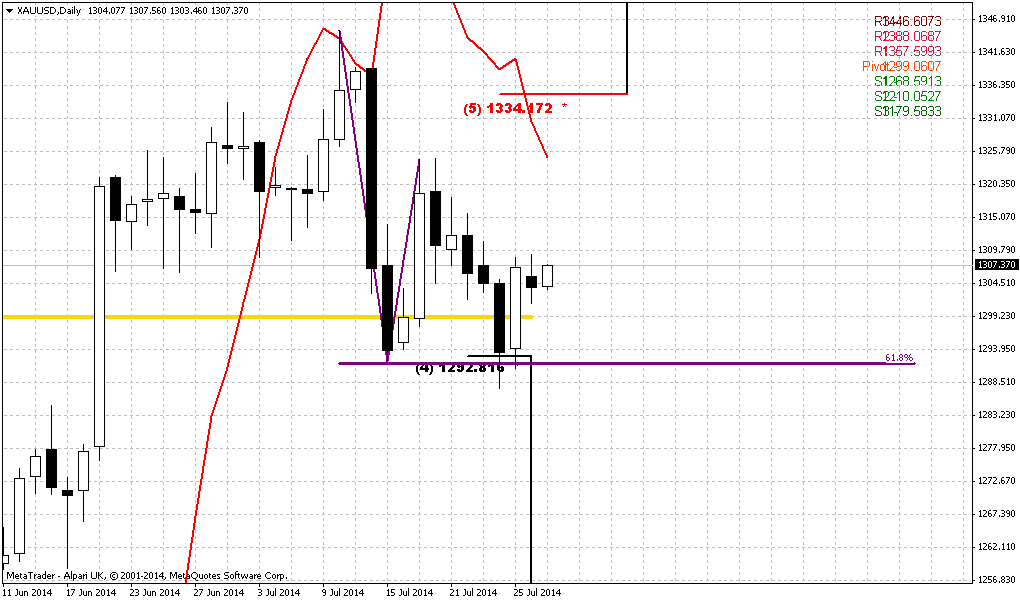
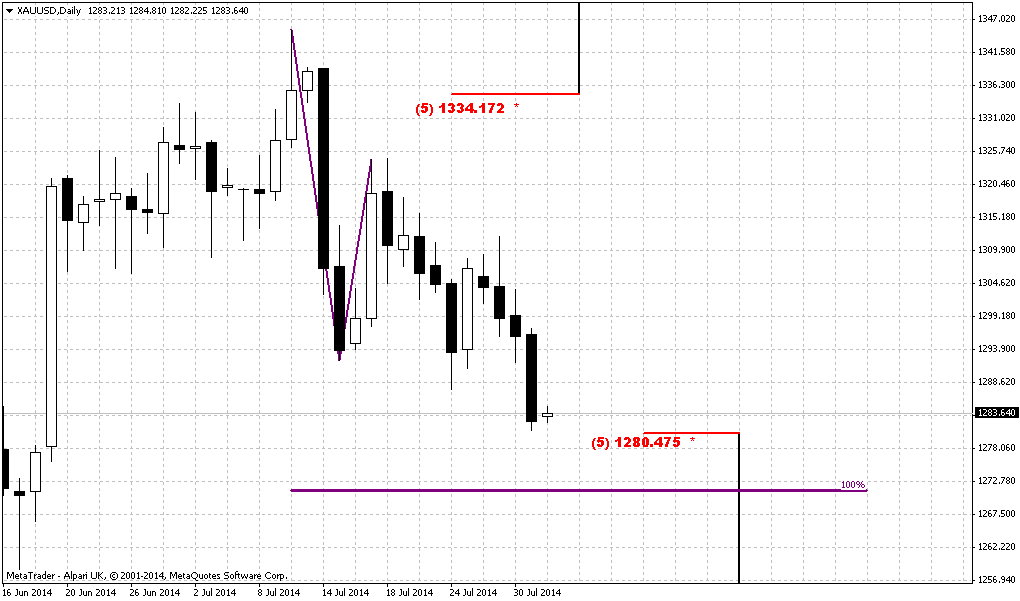
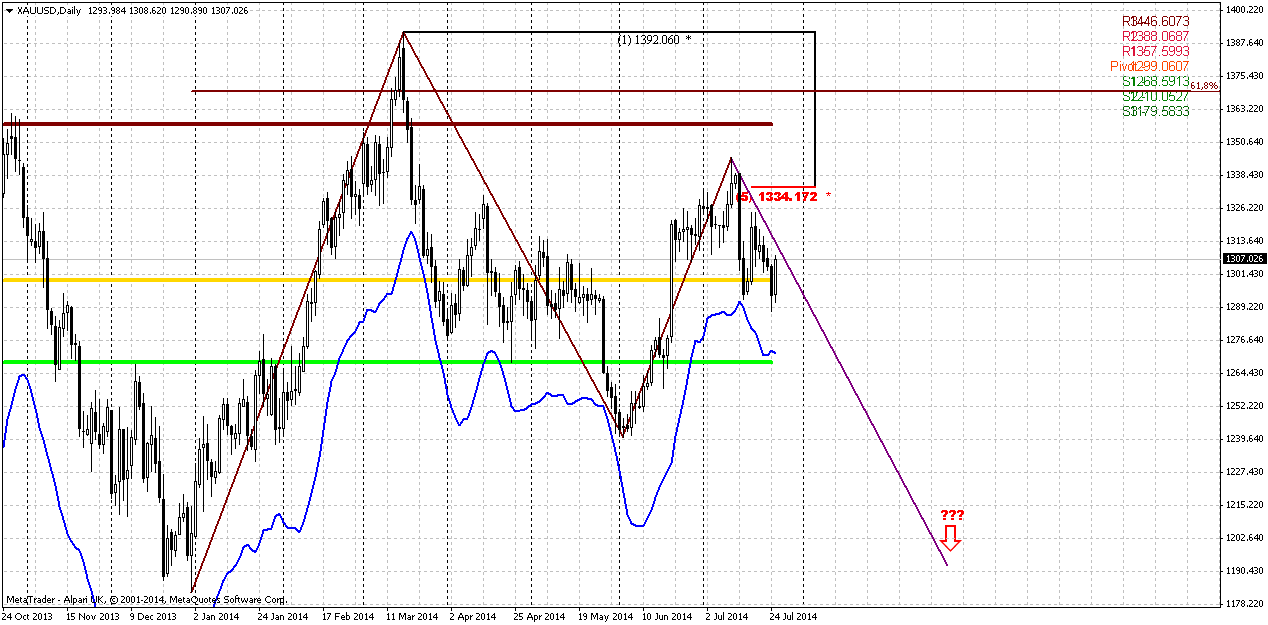
Daily
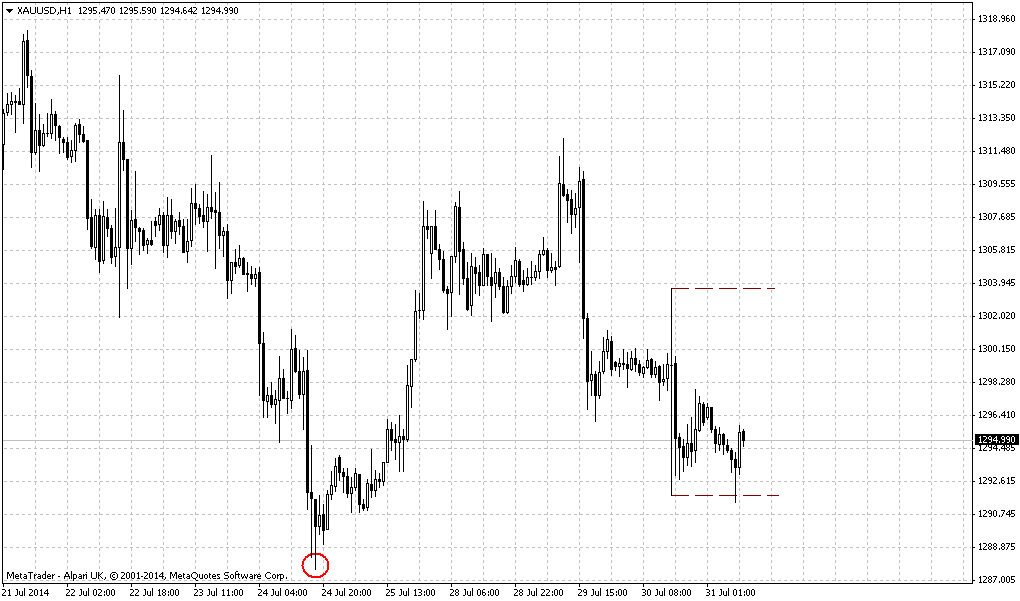
As you remember, week ago we have some concerns on possible upward continuation, but market one by one has erased all short-term opportunities for upside action and all potentials for bullish pattern. We already said that upward continuation has some weak moments. First is market failure at 1335 and inability to hold above it. This simultaneously points as on corrective nature of upward action as problems with further upward continuation, since plunge was really strong. Lack of physical demand on spot market… It is difficult to count on significant appreciation that demands breakout through strong levels without real big inflows. Closing of shorts can’t support rally for considerable period of time, especially it can’t push prices to new upward achievements. Although on Friday we saw attempt to break the situation and market even has formed bullish engulfing pattern right at MPP and 50% Fib support level. At the same time CFTC report does not show significant changes and looks like we should agree with others who explained this rally by escalation on geopolitical situation.
Thus nothing drastical has happened yet, but tactically now we have to get downward breakout and erasing of engulfing pattern before taking any short position. And of cause we mostly be focus on 1270 area first – MPS1 and oversold, since downside AB=CD target that we draw here stands too far yet.
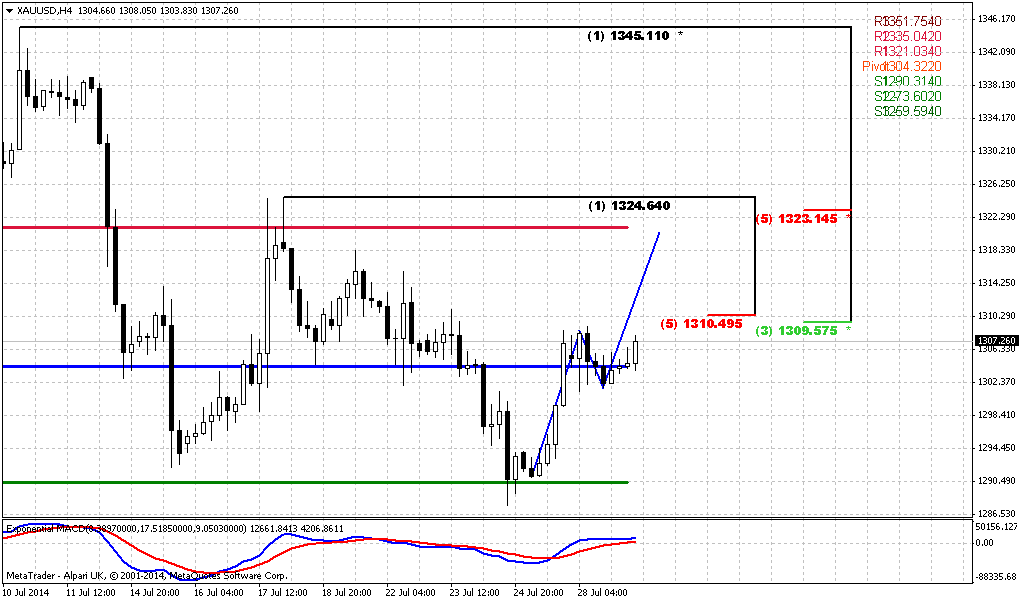
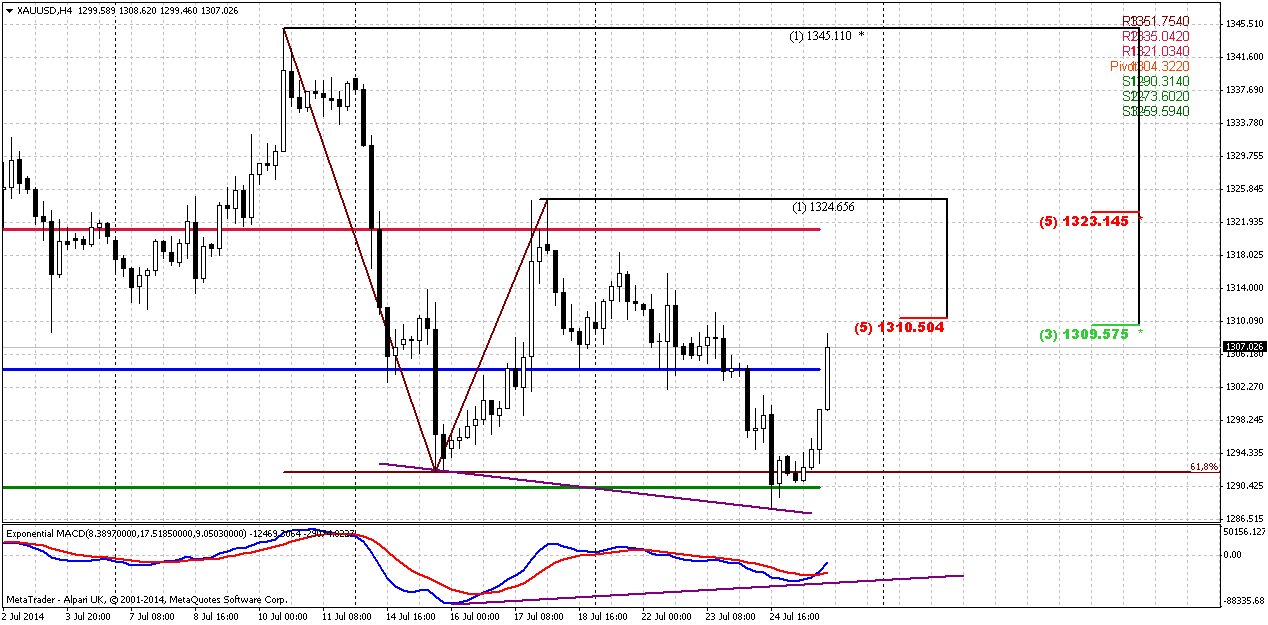
4-hour
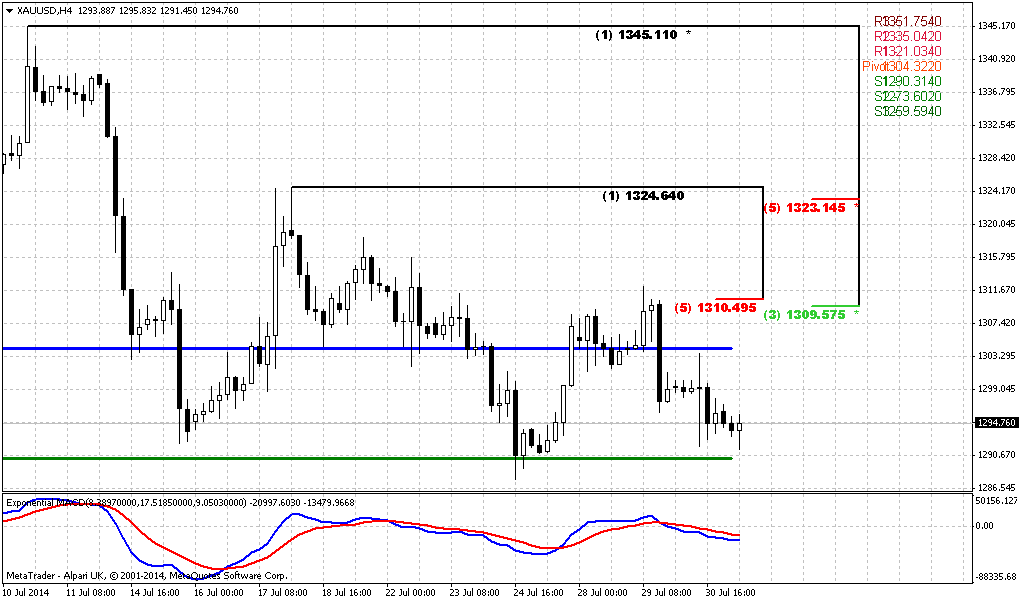
Intraday charts shows short-term bullish setup. Despite what reason has triggered it, technically this is bounce up from daily 50% support and Agreement, since market also has reached minor 0.618 AB=CD target. Now is the question how long and far this bounce will be. On Friday price has reached K-resistance area, trend has turned bullish and we also have bullish MACD divergence. Ultimate retracement that will keep bearish setup intact stands at WPR1 and 1323 area Fib resistance, but it is prefferable that market stops somewhere around WPP. Currently I do not have any illusions on perspective of this upside motion due reasons that we’ve discussed in fundamental part of this research. Usually when geopolitical event triggers short-term reaction – it is unstable and short-term. Thus, in the beginning of the week let’s be focused on WPP and 1287 lows. In fact, to get confirmation of bearish stretngh we need to see daily engulfing pattern vanishing. First – keep watching on WPP and K-area. If market will turn down, this could be first sign of downward continuation and then we will start to monitor 1287 area. But if market will move higher – then next destination will be 1323-1325 level.
Conclusion:
Market has to breakout 1400 to change long-term situation significantly. Fundamentally situation is supportive to USD. Recent just up on Friday mostly was due escalation of geopolitical situation and closing of some positions on gold. Hardly this situation lasts for long period. Investors will prepare to FOMC meeting and NFP report on coming week.
Although currently retracement up does not look like menace for bears – it still could reach 1325 area without breaking bearish sentiment. On next week we will be watch for WPP and 1310 area first and then, depending on what direction will prevail – either 1325 area or 1287 lows and vanishing of short-term daily bullish pattern.
The technical portion of Sive's analysis owes a great deal to Joe DiNapoli's methods, and uses a number of Joe's proprietary indicators. Please note that Sive's analysis is his own view of the market and is not endorsed by Joe DiNapoli or any related companies.
Gold prices climbed as Russia said the United States was trying to influence international opinion through unfounded insinuations and anti-Russian rhetoric over the crisis in Ukraine, while the Pentagon said the transfer of rocket systems from Russia to Ukrainian separatists appeared to be imminent.
"With the news flow coming out Russia and Ukraine and you don't know what's going to happen in Iraq, traders are buying gold as they don't want to get too exposed to geopolitical risks going into the weekend," said Robert Haworth, senior investment strategist at U.S. Bank Wealth Management's Private Client Reserve.
Weaker U.S. equities dragged by bellwether online retailer Amazon also lifted gold prices. The market awaited the release of July U.S. non-farm payrolls and the Federal Open Market Committee meeting, both scheduled for next week. Gold was down 0.7 percent this week, extending the previous week's 2 percent fall, mostly on speculation that an improving employment sector in the United States could signal an early rate increase by the Federal Reserve.
As a gauge of investor sentiment, holdings of the SPDR Gold Trust, the world's largest gold-backed exchange-traded fund, fell 3.6 tonnes on Thursday - the biggest one-day drop in more than a month.
Monthly
Recent market mostly shows flat action, long term picture changes slowly. Despite solid upward action our bearish grabber is still valid and price should pass solid distance to change situation drastically. Situation could change only if market will move above 1400 area.
Right now gold stands under pressure of perpsectives of USD strength – good economy data first, that right now is confirmed by US companies earning reports, expectations on Fed more hawkish assessement of perspectives and finally, week physical demand – all these moments prevent gold appreciation. The only factor that could support gold somehow is gepolitical tensions. Previously we have turmoil in Iraq and Ukraine, now Israel and Palestine added.
Grabber pattern is important, but June, and especially July has blocked gradual downward action and white candles break the bearish harmony of recent action. Next upside important level is 1360 – Yearly pivot point. If market will move above it (not neccesary it will happen in July) – this could be an indication that gold will continue move higher and this really could become a breaking moment on gold market. Otherwise, grabber will be valid and potentially could lead price back at least to 1180 lows again.
That’s being said, situation on the monthly chart does not suggest yet taking long-term positions on gold, since everything could change on coming week. Still, fundamental picture is moderately bearish in long-term. Possible sanctions from EU and US could hurt their own economies (especially EU). Many analysts already have started to talk about it. It means that economies will start to loose upside pace and inflation will remain anemic. In such situations investors mostly invest in interest-bear assets, such as bonds. Inflation also will be depressed and this is negative sign for gold.
Weekly
Due to solid events that we expect at the end of coming week, long-term picture does not change. As we’ve said previously - in nearest couple of week the major question will be whether gold will hold above 1335 or not. And now we stand at hot point. Usually reaching of minor target does not suggest deep retracement. If market is really bearish it should continue move down soon and 1335 level – 5/8 Fib resistance will become the last edge. Retracement above 5/8 level will be too deep for minor bounce after reaching just minor AB=CD target. Spot traders tell that as soon as market reaches this area – buying volume starts to decline significantly and this is also confirmed by recent CFTC data. Although on previous week market has shown not bad bounce down, but it still stands relatively close to 1335-1340 area and everything still could change.
It is difficult to comment just small new candle on weekly chart. We know that 5/8 resistance at 1335 is crucial for us and market already has confirmed it by downside action. Thus, we probably could say that the recent top is invalidation point for bearish setup in short-term perspective. Market should re-start move down or bearish trend or AB=CD pattern will be broken. In this case market theoretically could form butterfly “Sell” pattern.
Daily
As you remember, week ago we have some concerns on possible upward continuation, but market one by one has erased all short-term opportunities for upside action and all potentials for bullish pattern. We already said that upward continuation has some weak moments. First is market failure at 1335 and inability to hold above it. This simultaneously points as on corrective nature of upward action as problems with further upward continuation, since plunge was really strong. Lack of physical demand on spot market… It is difficult to count on significant appreciation that demands breakout through strong levels without real big inflows. Closing of shorts can’t support rally for considerable period of time, especially it can’t push prices to new upward achievements. Although on Friday we saw attempt to break the situation and market even has formed bullish engulfing pattern right at MPP and 50% Fib support level. At the same time CFTC report does not show significant changes and looks like we should agree with others who explained this rally by escalation on geopolitical situation.
Thus nothing drastical has happened yet, but tactically now we have to get downward breakout and erasing of engulfing pattern before taking any short position. And of cause we mostly be focus on 1270 area first – MPS1 and oversold, since downside AB=CD target that we draw here stands too far yet.
4-hour
Intraday charts shows short-term bullish setup. Despite what reason has triggered it, technically this is bounce up from daily 50% support and Agreement, since market also has reached minor 0.618 AB=CD target. Now is the question how long and far this bounce will be. On Friday price has reached K-resistance area, trend has turned bullish and we also have bullish MACD divergence. Ultimate retracement that will keep bearish setup intact stands at WPR1 and 1323 area Fib resistance, but it is prefferable that market stops somewhere around WPP. Currently I do not have any illusions on perspective of this upside motion due reasons that we’ve discussed in fundamental part of this research. Usually when geopolitical event triggers short-term reaction – it is unstable and short-term. Thus, in the beginning of the week let’s be focused on WPP and 1287 lows. In fact, to get confirmation of bearish stretngh we need to see daily engulfing pattern vanishing. First – keep watching on WPP and K-area. If market will turn down, this could be first sign of downward continuation and then we will start to monitor 1287 area. But if market will move higher – then next destination will be 1323-1325 level.
Conclusion:
Market has to breakout 1400 to change long-term situation significantly. Fundamentally situation is supportive to USD. Recent just up on Friday mostly was due escalation of geopolitical situation and closing of some positions on gold. Hardly this situation lasts for long period. Investors will prepare to FOMC meeting and NFP report on coming week.
Although currently retracement up does not look like menace for bears – it still could reach 1325 area without breaking bearish sentiment. On next week we will be watch for WPP and 1310 area first and then, depending on what direction will prevail – either 1325 area or 1287 lows and vanishing of short-term daily bullish pattern.
The technical portion of Sive's analysis owes a great deal to Joe DiNapoli's methods, and uses a number of Joe's proprietary indicators. Please note that Sive's analysis is his own view of the market and is not endorsed by Joe DiNapoli or any related companies.
Last edited: