Sive Morten
Special Consultant to the FPA
- Messages
- 18,690
Fundamentals
Gold prices were slightly lower on Friday as the dollar rose after a closely watched monthly U.S. jobs report underscored expectations of a steady recovery in the world's No. 1 economy, while platinum group metals were buoyed by strikes. Traders had held off taking new positions ahead of the data after a near 1-percent gold price rally in the previous session following new stimulus measures from the European Central Bank. While appetite for the metal initially picked up after the report, gains were capped by expectations that the Federal Reserve will continue to unwind its stimulus measures and that other assets will offer better returns, as well as the dollar's recovery. "There can't be a substantial price rebound without any meaningful investor or consumer buying," VTB Capital analyst Andrey Kryuchenkov said.
"Major players will remain on the sidelines for now. European investors would be putting money into blue-chip equities, while with improving risk sentiment there is even less incentive to invest in gold."
Nonfarm payrolls increased 217,000 last month, the Labor Department said on Friday, against expectations for a 218,000 rise, while data for March and April was revised to show 6,000 fewer jobs created than previously reported. The dollar initially fell after the report as U.S. Treasury yields dipped, but later rebounded. U.S. stocks rose.
Among other precious metals, platinum added to gains after South Africa's AMCU union president said the union's 12,500 rand ($1,200) per month wage demand was "non-negotiable", dashing hopes of a speedy resolution to a five-month strike. Spot platinum touched fresh August 2011 highs of $844 per ounce and was up 0.5 percent at $1,444 an ounce, while spot palladium was up 0.8 percent at $842.00 an ounce, on track for its fourth straight week of gains.
"If after further arbitration, the strike is not resolved the government has the option of declaring the strike illegal," HSBC said in a note. "The apparent stalemate has boosted platinum group metal prices but we are mindful that any bearish news could take prices lower, at least in the near term." Spot silver was down 0.11 percent at $18.98 an ounce, but the industrial metal put in its best week since mid-March.
Monthly
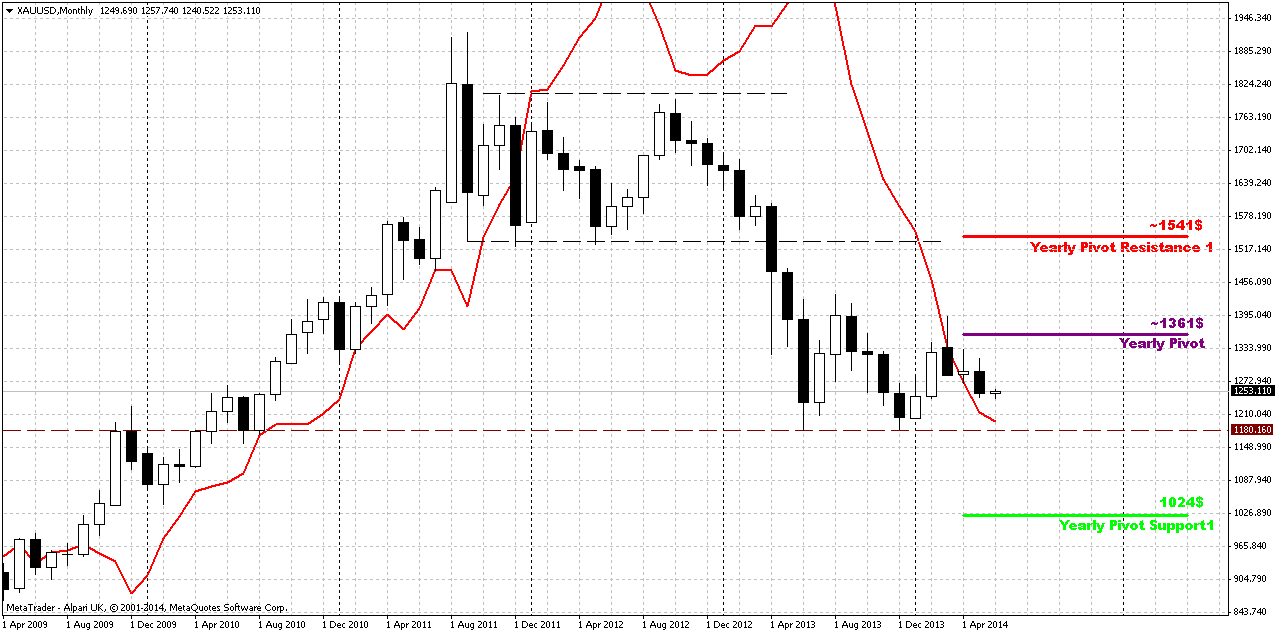
May right at the end has shown it’s power by solid plunge down. It could mean that bearish grabber that was formed 2 months earlier is taking it’s power. Also we’ve discussed possible bearish dynamic pressure here and now it looks as clear as never before. At the same time our reversal level here becomes farer and farer. Even if price will reach 1350 area – it will not change big picture. Situation could change only if market will move above 1400 area.
Grabber pattern and pressure is so important right now, because they provide direction for long-term perspective.
At the same time grabber has appeared right at Yearly Pivot Point – this is not best combination for bulls and could indicate reaction of the gold on Yearly pivot. Otherwords it could be a confirmation of bearish sentiment for the whole year. Grabber potentially strong pattern that could lead price back at least to 1180 lows again.
That’s being said recent action indicates that bears’ power is growing and may be market finally has turned to more active behavior. Besides, if we even will get any deeper retracement up - hardly it will change long-term picture. Currently, there are 3 major driving factors on gold - some unexpected geopolitical tensions, inflation and seasonal trend, i.e. spot demand. None of them show significant appreciation. Hence, it is very difficult to take bet on upward reversal on gold market by far. Even more, US fundamental data and seasonal trend now makes pressure impact on gold.
Weekly
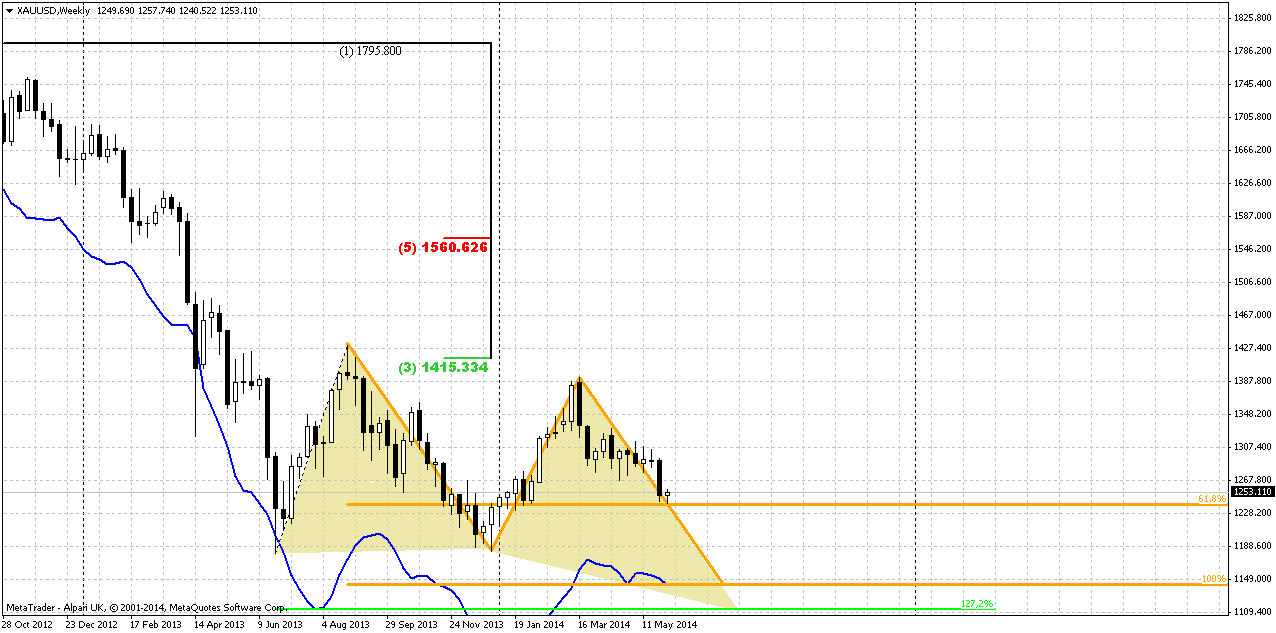
It is difficult to add something new to our analysis, because recent week was really small and it has not changed picture that we’ve discussed previously. Weekly chart is major one for gold right now. Mostly because it shows intermediate targets. Nearest target stands at 1236 area – just 10$ lower than the current market. This level probably will become the major one again. We thought that it should be reached on previous week, but this has not happened. By taking farer look – market could form AB=CD down to 1140$ area, because monthly grabber suggests taking out of previous lows and next nearest target below it is precisely AB=CD objective point.
And finally, guys, here could be even butterfly Buy pattern. It has even lower target – 1110$. At the same time guys, this area around 1000-1100$ will become an area of big demand. This is the breakeven cost of gold mining. Price will not be able to hold below this level for long period, otherwise it will be just unprofitable to mine gold… I dare to suggest that market could reach it at the end of the summer, when seasonal trend shifts bullish.
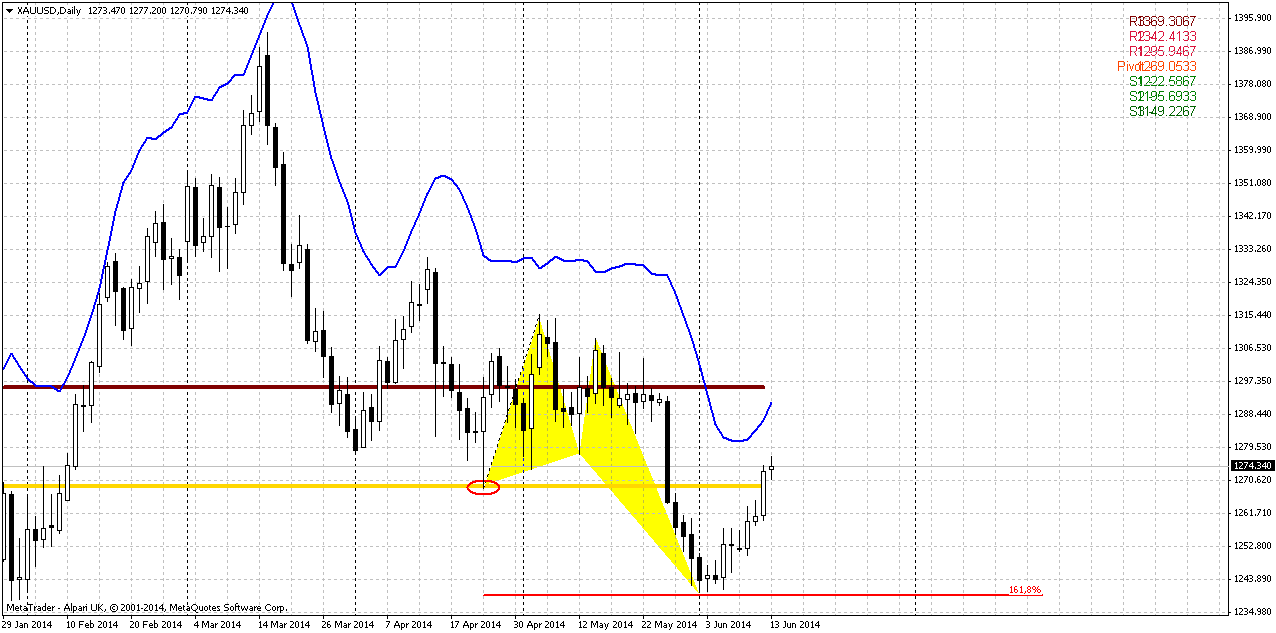
Daily
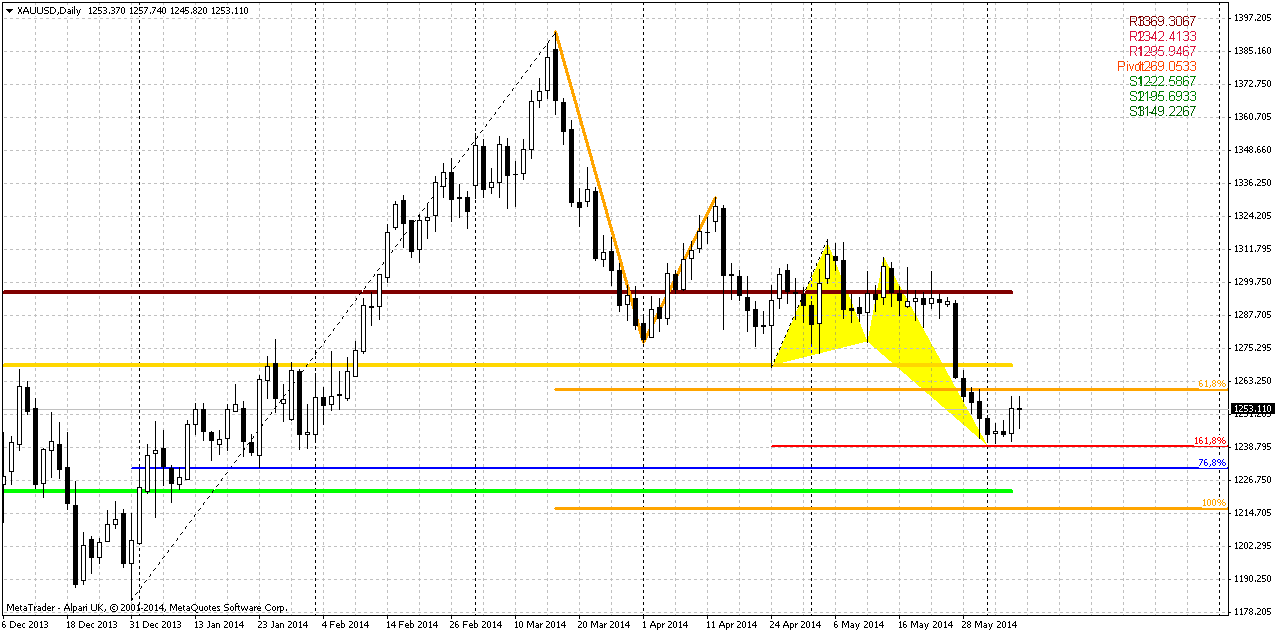
Finally we reach daily chart. Trend is bearish here. Situation on daily is very tricky – partially because we do not have any clear patterns yet, partially due anemic action on previous week. I draw a lot of color lines here, so let’s find out their purpose here. First of all, guys take a look at downward AB=CD pattern and 0.618 extension target that gold has broken 2 weeks ago. This was not just minor AB=CD extension but also major 5/8 Fib support, i.e. we had an Agreement and market has passed through it without any respect. This fact just tells us how weak market is and this is also confirmed by recent talks from analysts that demand in general anemic for gold. SPDR fund assets stand around lows, just 10 tonnes higher from absolute minimum. This level in June coincides with MPP that has not been tested yet. As market has tendency to re-test strong levels that were broken without respect – I suspect this could become the target of possible retracement up – 1270 area of MPP.
Next line is red – 1.618 extension of butterfly pattern. As we’ve talked previously, market turns to upside bounce on ECB speech but has not quite reached as butterfly as AB=CD weekly 0.618 extension target around 1236$. It means that market hardly will show deep bounce prior reaching of 1236 area, so be careful with any long position if you have it. This is always very dangerous to go long right above untouched target.
Finally, next target will be probably combination of MPS1 and AB=CD destination around 1214-1218 area.
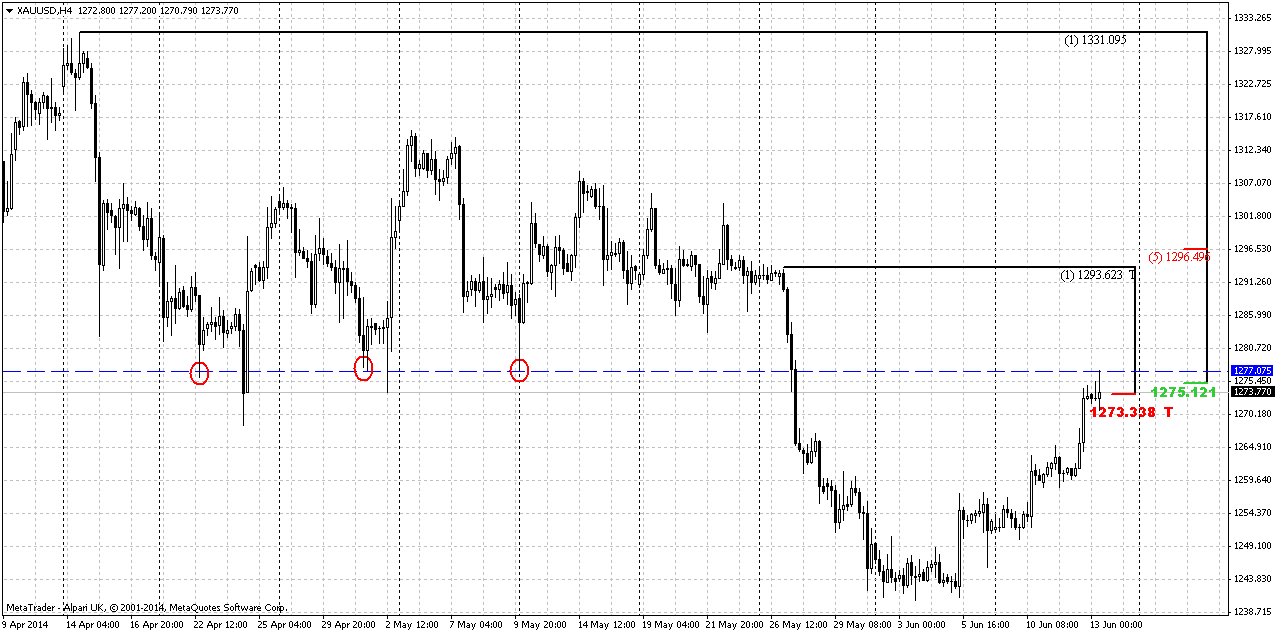
4-hour
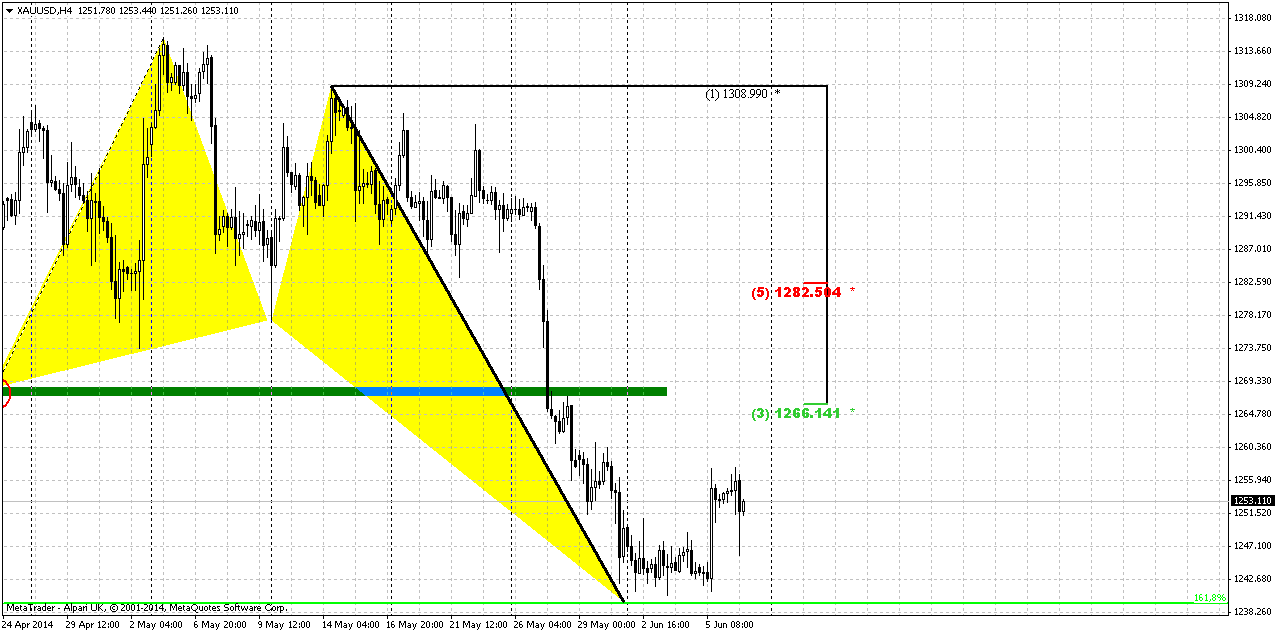
And the last one – 4hour chart. Here we clearly can see how price hovers above 1236 area. Market has shown tenuous bounce but suddenly it has stopped on Friday as no sufficient demand on market by far. Here we could get 2 possible scenarios. First is appearing something like Double bottom pattern, if market will return right back down, show W&R of previous lows and hit 1236 level finally. Second – gold will form some AB=CD pattern right tno 1265-1270 area and test MPP. Personally, guys, knowing gold’s cunning and habits, I would bet on first scenario.
We can’t also exclude that market will form some other patterns a bit later, say, butterfly “Buy”, but right now we will monitor coiling around 1236 area.
Conclusion:
Market has to breakout either 1400 to change long-term situation significantly. On previous week market has turned to fast action and has done as much as we have expected form it during much longer time. Thus, we’ve got as bearish grabber as dynamic pressure that point on reaching at least of recent lows around 1180s. But potentially, gold could reach deeper levels.
In short-term perspective, may be gold market is not as interesting and active as it was before. But we have to keep an eye on it, since this is quite “responsible moment” on gold market right now and we can’t exclude it from our eyeshot. Soon market could give us a context for taking position. Our trading plan suggests reaching of 1236 support area and following upward bounce to ~1270 area. This could become a level where we will start to think about short entry.
The technical portion of Sive's analysis owes a great deal to Joe DiNapoli's methods, and uses a number of Joe's proprietary indicators. Please note that Sive's analysis is his own view of the market and is not endorsed by Joe DiNapoli or any related companies.
Gold prices were slightly lower on Friday as the dollar rose after a closely watched monthly U.S. jobs report underscored expectations of a steady recovery in the world's No. 1 economy, while platinum group metals were buoyed by strikes. Traders had held off taking new positions ahead of the data after a near 1-percent gold price rally in the previous session following new stimulus measures from the European Central Bank. While appetite for the metal initially picked up after the report, gains were capped by expectations that the Federal Reserve will continue to unwind its stimulus measures and that other assets will offer better returns, as well as the dollar's recovery. "There can't be a substantial price rebound without any meaningful investor or consumer buying," VTB Capital analyst Andrey Kryuchenkov said.
"Major players will remain on the sidelines for now. European investors would be putting money into blue-chip equities, while with improving risk sentiment there is even less incentive to invest in gold."
Nonfarm payrolls increased 217,000 last month, the Labor Department said on Friday, against expectations for a 218,000 rise, while data for March and April was revised to show 6,000 fewer jobs created than previously reported. The dollar initially fell after the report as U.S. Treasury yields dipped, but later rebounded. U.S. stocks rose.
Among other precious metals, platinum added to gains after South Africa's AMCU union president said the union's 12,500 rand ($1,200) per month wage demand was "non-negotiable", dashing hopes of a speedy resolution to a five-month strike. Spot platinum touched fresh August 2011 highs of $844 per ounce and was up 0.5 percent at $1,444 an ounce, while spot palladium was up 0.8 percent at $842.00 an ounce, on track for its fourth straight week of gains.
"If after further arbitration, the strike is not resolved the government has the option of declaring the strike illegal," HSBC said in a note. "The apparent stalemate has boosted platinum group metal prices but we are mindful that any bearish news could take prices lower, at least in the near term." Spot silver was down 0.11 percent at $18.98 an ounce, but the industrial metal put in its best week since mid-March.
Monthly
May right at the end has shown it’s power by solid plunge down. It could mean that bearish grabber that was formed 2 months earlier is taking it’s power. Also we’ve discussed possible bearish dynamic pressure here and now it looks as clear as never before. At the same time our reversal level here becomes farer and farer. Even if price will reach 1350 area – it will not change big picture. Situation could change only if market will move above 1400 area.
Grabber pattern and pressure is so important right now, because they provide direction for long-term perspective.
At the same time grabber has appeared right at Yearly Pivot Point – this is not best combination for bulls and could indicate reaction of the gold on Yearly pivot. Otherwords it could be a confirmation of bearish sentiment for the whole year. Grabber potentially strong pattern that could lead price back at least to 1180 lows again.
That’s being said recent action indicates that bears’ power is growing and may be market finally has turned to more active behavior. Besides, if we even will get any deeper retracement up - hardly it will change long-term picture. Currently, there are 3 major driving factors on gold - some unexpected geopolitical tensions, inflation and seasonal trend, i.e. spot demand. None of them show significant appreciation. Hence, it is very difficult to take bet on upward reversal on gold market by far. Even more, US fundamental data and seasonal trend now makes pressure impact on gold.
Weekly
It is difficult to add something new to our analysis, because recent week was really small and it has not changed picture that we’ve discussed previously. Weekly chart is major one for gold right now. Mostly because it shows intermediate targets. Nearest target stands at 1236 area – just 10$ lower than the current market. This level probably will become the major one again. We thought that it should be reached on previous week, but this has not happened. By taking farer look – market could form AB=CD down to 1140$ area, because monthly grabber suggests taking out of previous lows and next nearest target below it is precisely AB=CD objective point.
And finally, guys, here could be even butterfly Buy pattern. It has even lower target – 1110$. At the same time guys, this area around 1000-1100$ will become an area of big demand. This is the breakeven cost of gold mining. Price will not be able to hold below this level for long period, otherwise it will be just unprofitable to mine gold… I dare to suggest that market could reach it at the end of the summer, when seasonal trend shifts bullish.
Daily
Finally we reach daily chart. Trend is bearish here. Situation on daily is very tricky – partially because we do not have any clear patterns yet, partially due anemic action on previous week. I draw a lot of color lines here, so let’s find out their purpose here. First of all, guys take a look at downward AB=CD pattern and 0.618 extension target that gold has broken 2 weeks ago. This was not just minor AB=CD extension but also major 5/8 Fib support, i.e. we had an Agreement and market has passed through it without any respect. This fact just tells us how weak market is and this is also confirmed by recent talks from analysts that demand in general anemic for gold. SPDR fund assets stand around lows, just 10 tonnes higher from absolute minimum. This level in June coincides with MPP that has not been tested yet. As market has tendency to re-test strong levels that were broken without respect – I suspect this could become the target of possible retracement up – 1270 area of MPP.
Next line is red – 1.618 extension of butterfly pattern. As we’ve talked previously, market turns to upside bounce on ECB speech but has not quite reached as butterfly as AB=CD weekly 0.618 extension target around 1236$. It means that market hardly will show deep bounce prior reaching of 1236 area, so be careful with any long position if you have it. This is always very dangerous to go long right above untouched target.
Finally, next target will be probably combination of MPS1 and AB=CD destination around 1214-1218 area.
4-hour
And the last one – 4hour chart. Here we clearly can see how price hovers above 1236 area. Market has shown tenuous bounce but suddenly it has stopped on Friday as no sufficient demand on market by far. Here we could get 2 possible scenarios. First is appearing something like Double bottom pattern, if market will return right back down, show W&R of previous lows and hit 1236 level finally. Second – gold will form some AB=CD pattern right tno 1265-1270 area and test MPP. Personally, guys, knowing gold’s cunning and habits, I would bet on first scenario.
We can’t also exclude that market will form some other patterns a bit later, say, butterfly “Buy”, but right now we will monitor coiling around 1236 area.
Conclusion:
Market has to breakout either 1400 to change long-term situation significantly. On previous week market has turned to fast action and has done as much as we have expected form it during much longer time. Thus, we’ve got as bearish grabber as dynamic pressure that point on reaching at least of recent lows around 1180s. But potentially, gold could reach deeper levels.
In short-term perspective, may be gold market is not as interesting and active as it was before. But we have to keep an eye on it, since this is quite “responsible moment” on gold market right now and we can’t exclude it from our eyeshot. Soon market could give us a context for taking position. Our trading plan suggests reaching of 1236 support area and following upward bounce to ~1270 area. This could become a level where we will start to think about short entry.
The technical portion of Sive's analysis owes a great deal to Joe DiNapoli's methods, and uses a number of Joe's proprietary indicators. Please note that Sive's analysis is his own view of the market and is not endorsed by Joe DiNapoli or any related companies.
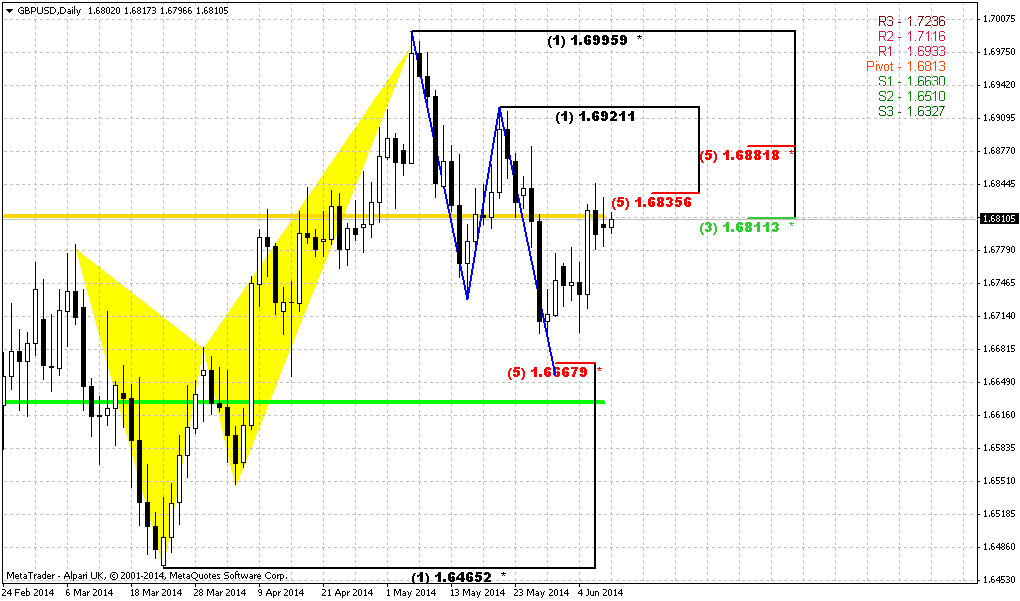
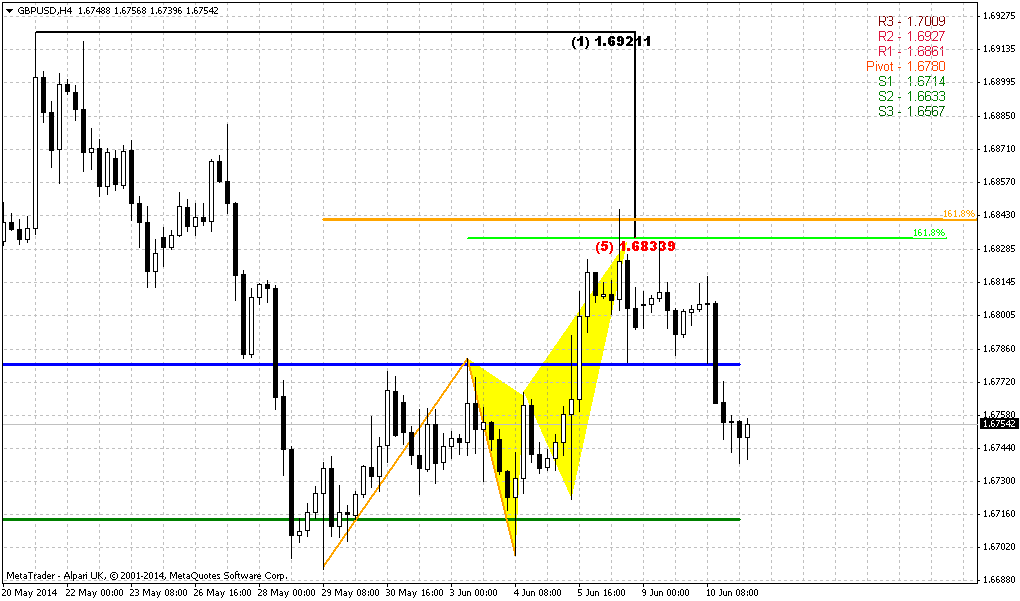
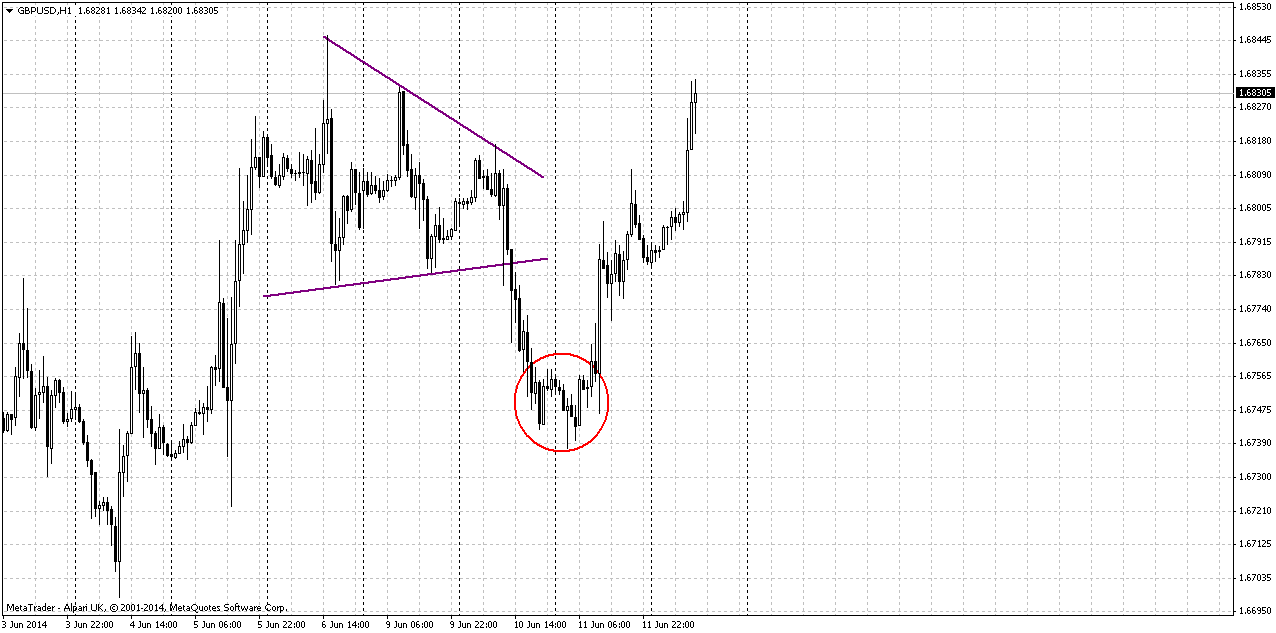
") If Cable retraces back down from here I will watch 1.6780 area to join the Big Party!? ;-)
If Cable retraces back down from here I will watch 1.6780 area to join the Big Party!? ;-)