Sive Morten
Special Consultant to the FPA
- Messages
- 18,760
Fundamentals
After FOMC meeting gold in fact was stricken twice. It’s no need to speak much about it, since we’ve discussed this in details previously. In general by announcement of QE contraction Fed confirms the positive changes in US economy. Thus, if Fed has decided to reduce liquidity inflow, they probably think that continuation of QE as it stands now could lead to some harm rather to advantages. Or, its efficiency has become significantly lower. On previous week we saw the chart of Non-farm payrolls and ISM manufacturing index. They show no growth as after QE II as after QE III has been started. Thus, the first impact on gold is growing attractiveness of risky assets. After FOMC meeting investors will put more careful look at them. This, in turn, will lead to massive money flow on Forex market since as foundation for hawkish Fed policy was put – US dollar carry trades should be contracted and major hurt will be on high yield currencies, such as AUD. This also can stimulate JPY weaken as investors will start to increase their investments in US economy by opening carry in JPY.
Second strike on gold is inflation, precisely speaking – it’s absence. This is actually a bearish explosive mix – economy growth and anemic inflation.
Market technical moments are all add fuel to the fire. Thus CME Group has raised initial margins on gold futures as gold price has plunged on Thursday for 6.5%. And only bargain hunting by investors and physical buyers helped offset a 25 percent increase in the margins of U.S. gold futures. Interesting but, open interest in U.S. Comex futures showed a surprise 3 percent increase after Thursday's sharp pullback, a sign that possible short-covering could help boost gold prices in the near term.
On previous week we’ve noted that some bounce up could possible in near term, by many factors. Major factor is long term strong upward momentum. Gold was in uptrend for 10 years and it is very difficult to assume “V” shape reversal and similar trend down. More probable is that we will get some attempt to continue move up as deep upward retracement. Second factor is significant oversold on gold and gradual increasing of interest and demand from long-term investors and retail buyers. And finally third is seasonal trend on gold – it should turn bullish at the end of August. It is thrilling moment as market almost has reached all time 3/8 support by this moment. I think, that now is the time to recall our view of yearly gold chart and remind you that we now stand at the eve of huge B&B “Buy”.

Unfortunately, guys, I was not able to find yearly data to draw 3x3 DMA and bar of current year – I’ll try to do this on coming week, but here on the chart that I’ve shown you before, we see that 1275 is major 0.382 support. If we will take even 34$ all time low of 70’s then we probably could get lower level around 1200, but anyway this area will be strong support. As you can see there are more and more factors start to appear that potentially supportive for gold. This is not necessary mean that gold will reverse up and continue long-term bull trend. This just points on potential deep retracement first that will not destroy overall bearish bias for gold, at least initially. And speaking about long-term perspective, we should not be very surprised if even will see bounce to 1500+ for example since that will be just 0.618 retracement.
CFTC data on current week shows small growth of Open Interest at significant drop on gold market.

Holdings of the world's largest physically backed gold exchange-traded funds - a popular way to invest in bullion since the financial crisis - have fallen more than 485 tonnes this year, Reuters data showed. The largest gold ETF, the SPDR Gold Trust, reported a4.5-tonne drop in its holdings on Thursday, taking them to their lowest in more than four years at 995.35 tonnes. That was 26 percent below their December 2012 peak of 1,353 tonnes.
So, major data allows us to make a conclusion that long term bearish sentiment still intact and price action is supported by trading volumes, reducing of physical gold positions. At the same time, there is some feeling that opposite pressure is growing and gold will harder and harder to continue downward action, since too many barriers stand ahead. Some relief is needed.
Monthly
June candle leads us to further confirmation of Volatility Breakout pattern here by showing even lower close than in May and April. This pattern usually provides solid reliability, since it based not on some price averaging as other indicators but on statistical measure of standard deviation, i.e. on volatility. This is in fact the core of the market’s breath and if we can call it in this way – some statistical law that could lead to significant consequences.
Now we have VOB setup here. Market never was as oversold as it stands now. Take a look at DOSC indicator again – market now stands at all time extreme point that is lower than the previous extreme value in 2008. This gives us very significant conclusion that will be hard to overvalue. Usually when market forms VOB it leads to 2-leg downward move in some shape of AB-CD, but not necessary that AB should be equal to CD. The minimum target of VOB is 0.618 extension of AB-CD, where AB – initial swing down that has given VOB. Other words – now market is forming AB move. Then some retracement up should follow and then downward continuation, i.e. extension. And major question now – is current level suitable for starting of upward bounce? Technically it is worthy of our attention and not only because this is significant Fib level. Take a look – this is also target of double harmonic swing and target of rectangle breakout. Usually price tends to pass down the distance that equals the height of broken rectangle. And yes, monthly oversold is also here. It is not necessary that bounce will start tomorrow. It could happen even not in July and after some fluctuations around 1200-1270, but we should be careful and keep an eye on possible reversal patterns on weekly chart.
So two significant conclusions could be made here: whatever bounce market will show here – this probably will be just retracement but not a reversal – the same thought we’ve made based on fundamental picture analysis. Second – market could reach some deeper support level and closest one stands around 1200.

Weekly
On weekly time frame situation is rather sophisticated, but not in term of direction but in term of objective point estimation. Thus, on monthly chart we said, that “somewhere” around market will probably meet the barrier and turn to retracement. But where is this barrier? Currently I do not see any exhausting signs on the market. Price has broken down “long bar” range and close below MPS1. This is the sign of continuation. Weekly gold is not at oversold. There are no signs of weakness on MACD either – no divergences or something of that sort. Even more shows increasing distance between the lines that usually confirms market’s strength. Yes, market has hit 1.27 extension and Fib support on monthly, but it has done it by single 6.5% drop in one day. Thus, it’s very probable that market will proceed to other downside targets. They are not too extended, but still stand lower. First one is 1210 1.618 extension, but most significant are 1.618 from the initial AB-CD and double range of broken April plunge that held followed price action for 2 months. They stand around 1150. At first glance it sounds difficult – how definitely estimate the target, and whether market proceeds lower or not. But here we have some assistance and this is 1320 low. To speak about possible upward retracement, we need to see that market has broken lower –low lower-high consequence. And if price will return above 1320 low, this could be first sign. Because take a look how whole move down is developing – markets never exceeds previous swing low and always finds resistance there and start downward continuation from it.

Daily
As market was rather flat on Friday, our analysis in fact is the same here. First of all, here it could be seen how market has hit 1.27 extension of butterfly – by single fast move down. Usually when this happens, odds suggest continuation to 1.618 butterfly with or without retracement. Also butterfly pattern treats as worked if market will show at least 3/8 retracement from the swing of right wing of the pattern. Current level is also target of excellent AB=CD pattern that is inner to butterfly. Thus, this is support.
But here there two other details appear that give us confidence that market will still show this 3/8 bounce. As we’ve said above – whole move down market retests previous swing low before next leg down starts. This swing low here coincides with our 3/8 Fib resistance level, i.e. minimum target of retracement. And now take a look – this is also WPP of coming week, and market tends to test it during the week with high probability. Thus, our chances to see retracement to 1320-1330 are not as hopeless as they could be with other circumstances.

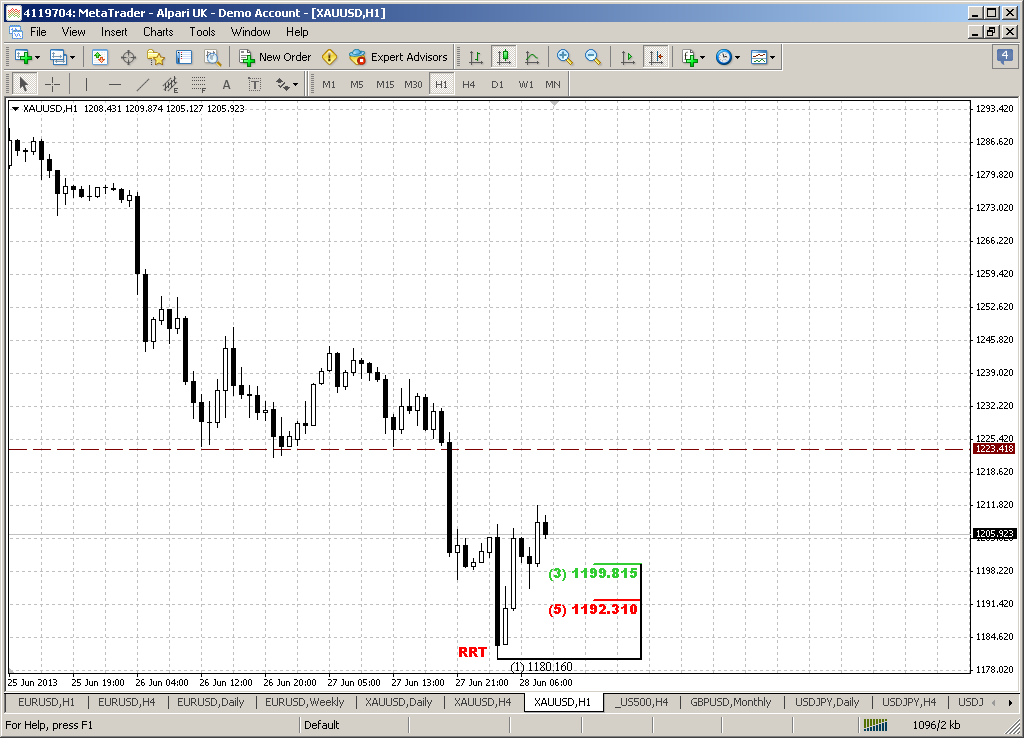
1-hour
Here, guys, I see nothing except this possible reverse H&S pattern. Since market was flat on Friday, it skewed a bit to the right, but now this is the only pattern that we can stick with. Trend holds bullish here. If it will work then we could get AB=CD retracement up and Agreement with strong resistance – hourly K-resistance around major daily 3/8 level and WPP. Thus, it really could happen that market will re-establish downward action from there.

Conclusion:
Technically and fundamentally gold market stands in long-term bearish motion, but there are more and more factors start to appear that make downward action as not as cloudless as it was recently. Also we’ve got VOB pattern that gives us forecast for long-term price behavior and promise compounded downward move in shape of some AB-CD.
Previous market’s way of action makes possible retracement to 1320-1330 area on coming week, but longer-term picture suggests some continuation at minimum to 1200 area but not exclude move even to 1150 area before any real big retracement could start.
The technical portion of Sive's analysis owes a great deal to Joe DiNapoli's methods, and uses a number of Joe's proprietary indicators. Please note that Sive's analysis is his own view of the market and is not endorsed by Joe DiNapoli or any related companies.
After FOMC meeting gold in fact was stricken twice. It’s no need to speak much about it, since we’ve discussed this in details previously. In general by announcement of QE contraction Fed confirms the positive changes in US economy. Thus, if Fed has decided to reduce liquidity inflow, they probably think that continuation of QE as it stands now could lead to some harm rather to advantages. Or, its efficiency has become significantly lower. On previous week we saw the chart of Non-farm payrolls and ISM manufacturing index. They show no growth as after QE II as after QE III has been started. Thus, the first impact on gold is growing attractiveness of risky assets. After FOMC meeting investors will put more careful look at them. This, in turn, will lead to massive money flow on Forex market since as foundation for hawkish Fed policy was put – US dollar carry trades should be contracted and major hurt will be on high yield currencies, such as AUD. This also can stimulate JPY weaken as investors will start to increase their investments in US economy by opening carry in JPY.
Second strike on gold is inflation, precisely speaking – it’s absence. This is actually a bearish explosive mix – economy growth and anemic inflation.
Market technical moments are all add fuel to the fire. Thus CME Group has raised initial margins on gold futures as gold price has plunged on Thursday for 6.5%. And only bargain hunting by investors and physical buyers helped offset a 25 percent increase in the margins of U.S. gold futures. Interesting but, open interest in U.S. Comex futures showed a surprise 3 percent increase after Thursday's sharp pullback, a sign that possible short-covering could help boost gold prices in the near term.
On previous week we’ve noted that some bounce up could possible in near term, by many factors. Major factor is long term strong upward momentum. Gold was in uptrend for 10 years and it is very difficult to assume “V” shape reversal and similar trend down. More probable is that we will get some attempt to continue move up as deep upward retracement. Second factor is significant oversold on gold and gradual increasing of interest and demand from long-term investors and retail buyers. And finally third is seasonal trend on gold – it should turn bullish at the end of August. It is thrilling moment as market almost has reached all time 3/8 support by this moment. I think, that now is the time to recall our view of yearly gold chart and remind you that we now stand at the eve of huge B&B “Buy”.
Unfortunately, guys, I was not able to find yearly data to draw 3x3 DMA and bar of current year – I’ll try to do this on coming week, but here on the chart that I’ve shown you before, we see that 1275 is major 0.382 support. If we will take even 34$ all time low of 70’s then we probably could get lower level around 1200, but anyway this area will be strong support. As you can see there are more and more factors start to appear that potentially supportive for gold. This is not necessary mean that gold will reverse up and continue long-term bull trend. This just points on potential deep retracement first that will not destroy overall bearish bias for gold, at least initially. And speaking about long-term perspective, we should not be very surprised if even will see bounce to 1500+ for example since that will be just 0.618 retracement.
CFTC data on current week shows small growth of Open Interest at significant drop on gold market.
Holdings of the world's largest physically backed gold exchange-traded funds - a popular way to invest in bullion since the financial crisis - have fallen more than 485 tonnes this year, Reuters data showed. The largest gold ETF, the SPDR Gold Trust, reported a4.5-tonne drop in its holdings on Thursday, taking them to their lowest in more than four years at 995.35 tonnes. That was 26 percent below their December 2012 peak of 1,353 tonnes.
So, major data allows us to make a conclusion that long term bearish sentiment still intact and price action is supported by trading volumes, reducing of physical gold positions. At the same time, there is some feeling that opposite pressure is growing and gold will harder and harder to continue downward action, since too many barriers stand ahead. Some relief is needed.
Monthly
June candle leads us to further confirmation of Volatility Breakout pattern here by showing even lower close than in May and April. This pattern usually provides solid reliability, since it based not on some price averaging as other indicators but on statistical measure of standard deviation, i.e. on volatility. This is in fact the core of the market’s breath and if we can call it in this way – some statistical law that could lead to significant consequences.
Now we have VOB setup here. Market never was as oversold as it stands now. Take a look at DOSC indicator again – market now stands at all time extreme point that is lower than the previous extreme value in 2008. This gives us very significant conclusion that will be hard to overvalue. Usually when market forms VOB it leads to 2-leg downward move in some shape of AB-CD, but not necessary that AB should be equal to CD. The minimum target of VOB is 0.618 extension of AB-CD, where AB – initial swing down that has given VOB. Other words – now market is forming AB move. Then some retracement up should follow and then downward continuation, i.e. extension. And major question now – is current level suitable for starting of upward bounce? Technically it is worthy of our attention and not only because this is significant Fib level. Take a look – this is also target of double harmonic swing and target of rectangle breakout. Usually price tends to pass down the distance that equals the height of broken rectangle. And yes, monthly oversold is also here. It is not necessary that bounce will start tomorrow. It could happen even not in July and after some fluctuations around 1200-1270, but we should be careful and keep an eye on possible reversal patterns on weekly chart.
So two significant conclusions could be made here: whatever bounce market will show here – this probably will be just retracement but not a reversal – the same thought we’ve made based on fundamental picture analysis. Second – market could reach some deeper support level and closest one stands around 1200.
Weekly
On weekly time frame situation is rather sophisticated, but not in term of direction but in term of objective point estimation. Thus, on monthly chart we said, that “somewhere” around market will probably meet the barrier and turn to retracement. But where is this barrier? Currently I do not see any exhausting signs on the market. Price has broken down “long bar” range and close below MPS1. This is the sign of continuation. Weekly gold is not at oversold. There are no signs of weakness on MACD either – no divergences or something of that sort. Even more shows increasing distance between the lines that usually confirms market’s strength. Yes, market has hit 1.27 extension and Fib support on monthly, but it has done it by single 6.5% drop in one day. Thus, it’s very probable that market will proceed to other downside targets. They are not too extended, but still stand lower. First one is 1210 1.618 extension, but most significant are 1.618 from the initial AB-CD and double range of broken April plunge that held followed price action for 2 months. They stand around 1150. At first glance it sounds difficult – how definitely estimate the target, and whether market proceeds lower or not. But here we have some assistance and this is 1320 low. To speak about possible upward retracement, we need to see that market has broken lower –low lower-high consequence. And if price will return above 1320 low, this could be first sign. Because take a look how whole move down is developing – markets never exceeds previous swing low and always finds resistance there and start downward continuation from it.
Daily
As market was rather flat on Friday, our analysis in fact is the same here. First of all, here it could be seen how market has hit 1.27 extension of butterfly – by single fast move down. Usually when this happens, odds suggest continuation to 1.618 butterfly with or without retracement. Also butterfly pattern treats as worked if market will show at least 3/8 retracement from the swing of right wing of the pattern. Current level is also target of excellent AB=CD pattern that is inner to butterfly. Thus, this is support.
But here there two other details appear that give us confidence that market will still show this 3/8 bounce. As we’ve said above – whole move down market retests previous swing low before next leg down starts. This swing low here coincides with our 3/8 Fib resistance level, i.e. minimum target of retracement. And now take a look – this is also WPP of coming week, and market tends to test it during the week with high probability. Thus, our chances to see retracement to 1320-1330 are not as hopeless as they could be with other circumstances.
1-hour
Here, guys, I see nothing except this possible reverse H&S pattern. Since market was flat on Friday, it skewed a bit to the right, but now this is the only pattern that we can stick with. Trend holds bullish here. If it will work then we could get AB=CD retracement up and Agreement with strong resistance – hourly K-resistance around major daily 3/8 level and WPP. Thus, it really could happen that market will re-establish downward action from there.
Conclusion:
Technically and fundamentally gold market stands in long-term bearish motion, but there are more and more factors start to appear that make downward action as not as cloudless as it was recently. Also we’ve got VOB pattern that gives us forecast for long-term price behavior and promise compounded downward move in shape of some AB-CD.
Previous market’s way of action makes possible retracement to 1320-1330 area on coming week, but longer-term picture suggests some continuation at minimum to 1200 area but not exclude move even to 1150 area before any real big retracement could start.
The technical portion of Sive's analysis owes a great deal to Joe DiNapoli's methods, and uses a number of Joe's proprietary indicators. Please note that Sive's analysis is his own view of the market and is not endorsed by Joe DiNapoli or any related companies.