Sive Morten
Special Consultant to the FPA
- Messages
- 18,727
Fundamentals
According to Reuters news, Gold turned higher after touching six-week lows under $1,300 an ounce on Friday, but marked its second straight weekly decline as an improving U.S. economic outlook lifted the dollar and bolstered appetite for risk. Bullion has been volatile and has dropped about $100 an ounce from a six-month high in the last nine trading sessions on declining geopolitical tensions, strong U.S. economic data and comments by Federal Reserve Chair Janet Yellen that interest rates could rise in the first half of 2015. Low interest rates, which cut the opportunity cost of holding non-yielding bullion above other assets, had been an important factor driving bullion higher in recent years.
"Economic figures on consumer sentiment keep rates low, stocks up, but gold is seeing (a) short-covering rally today," said George Gero, vice-president at RBC Capital markets. "Market participants over the past days have started to look back at economic fundamentals and focus less on Russia, Crimea," Credit Suisse analyst Karim Cherif said. "You will probably see prices continue to slowly slide downward and unless you see renewed concern about the economic side or Russia, which doesn't seem to be the case, prices should fall."
The U.S. currency was aided by data showing U.S. consumer spending rose in February, in the latest sign that the economy was regaining strength after a setback caused by bad weather. "If we don't close below $1,290 today, we could see some consolidation around these levels ahead of the ECB on Thursday and the U.S. non-farm payrolls on Friday," VTB Capital analyst Andrey Kryuchenkov said, earlier in the session.
The next focus for the market will be the March non-farm employment report due next Friday, which will give clues on the strength of the economy. As a gauge of investor interest, holdings of the SPDR Gold Trust, the world's biggest gold-backed exchange-traded fund, remained unchanged from Thursday after two straight days of outflows.
PHYSICAL DEMAND
In the physical markets, traders said demand could pick up, given the recent sharp fall in prices but they remained cautious as consumers seemed uncertain about the price direction from current levels. Prices in the world's biggest consumer, China, remained at a discount to spot prices, indicating lack of fresh demand. Platinum was up 0.86 percent at $1,403.75 an ounce, while palladium gained 2.5 percent to $771.75 an ounce as a miners' strike in South Africa continued for the tenth week. "Platinum prices look rather cheap here considering the severity of the situation in South Africa," UBS said in a note. "We expect deliveries to start struggling in April – current prices suggest that the market is not fully pricing in this risk, therefore any indication of producer difficulties in meeting their contractual agreements with customers in the coming weeks is likely to have a considerable price impact."
So, guys, in to words we can acknowledge that looks like market is returning to it’s own and gradually getting some relief from geopolitical tensions and lot of macro data surprises.
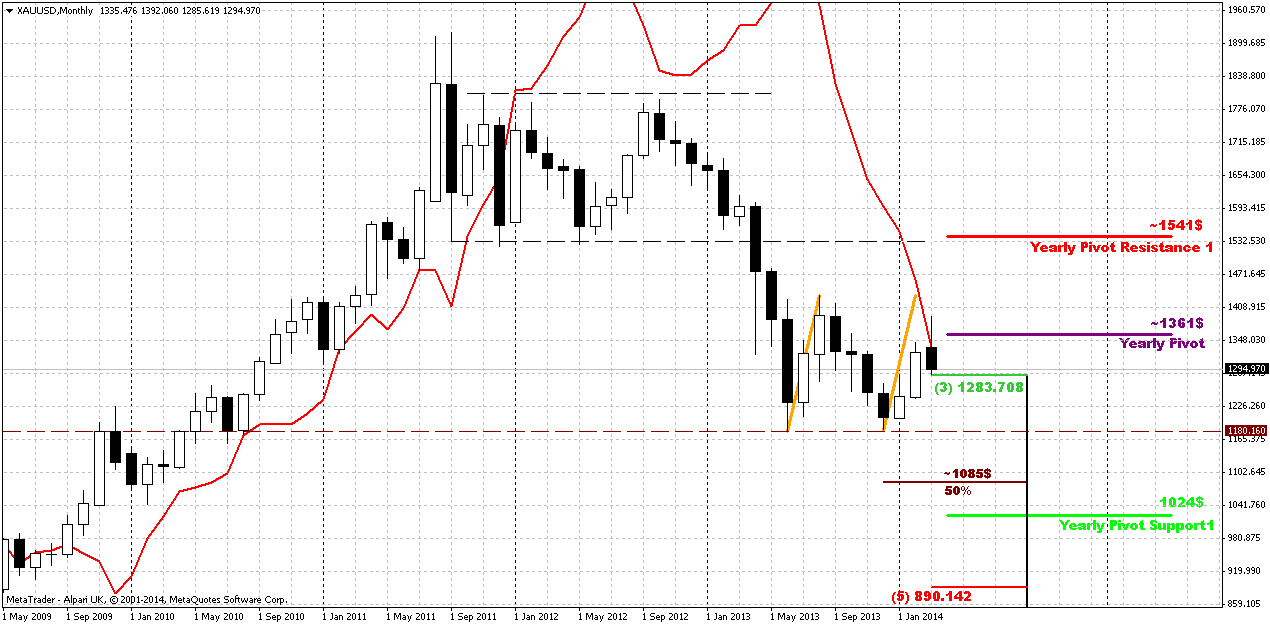
Monthly
Although on previous week we’ve noted that price has moved above YPP and shifted trend to bullish, but also we said that this could shift to bearish stop grabber and that it is too early to be fascinating with bullish break. Now we have the picture how it could look like by the end of the month having another bearish week on our backs. At the same time let’s not to give dramatic turn to this event. All that I would like to point is that nothing is done yet here. Of cause turning down from YPP can’t treated as positive sign, but this is normal – respect and react on reaching solid resistance.
Taking into consideration all issues that we have now on gold market – I would not rush with reversal conclusions and treat current move down as retracement by far. Another interesting moment here is that market has not reached neckline of potential Double Bottom pattern and has not reached AB=CD upward target around 1430. The question what will it be – another gold’s trick and pitfall? When traders will take shorts - will market make another leg up to neckline before following retracement? If not, then market should not show too deep retracement right now. If gold is really bullish, and it stands above 0.618 target already – there is no reasons for too extended retracement to downside.
Long term upside target stands around yearly PR1. We know that gold likes to re-test previously broken lows and consolidations. 1540 area is monthly overbought, YPR1 and low border of broken long-term rectangle. As market was strongly oversold, very often it has tendency to reach overbought. Market is a impulse substance and reaction equals to counter reacion.
So our long-term analysis is the same. As another application of significantly oversold we’ve suggested retracement up. Thus, we’ve made an assumption of possible deeper upward retracement that could take a shape of AB=CD, and invalidation for this setup is previous lows around 1170s. Market right now is forming something like double bottom.
That’s being said – nearest target here is 1430 resistance level, while taking in consideration golds’ habits, geopolitical tension and technical issues, now we treat probability of reaching 1540 level as very high. In nearest future we have to keep close eye on current retracement down. Appearing of bearish grabber will force us to postpone upward expectations until it will not be resolved – either hits target or will be vanished.
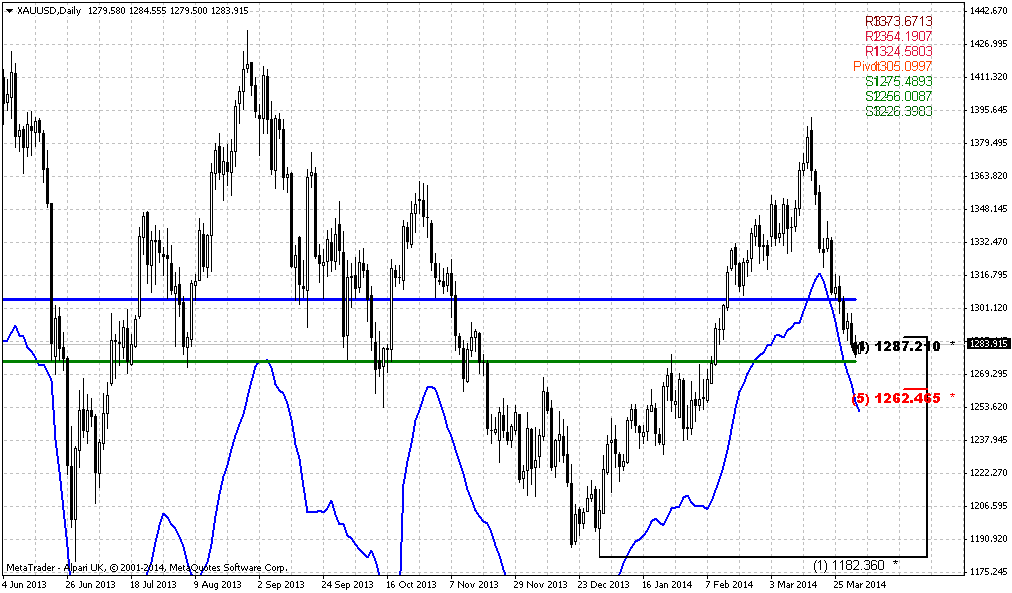
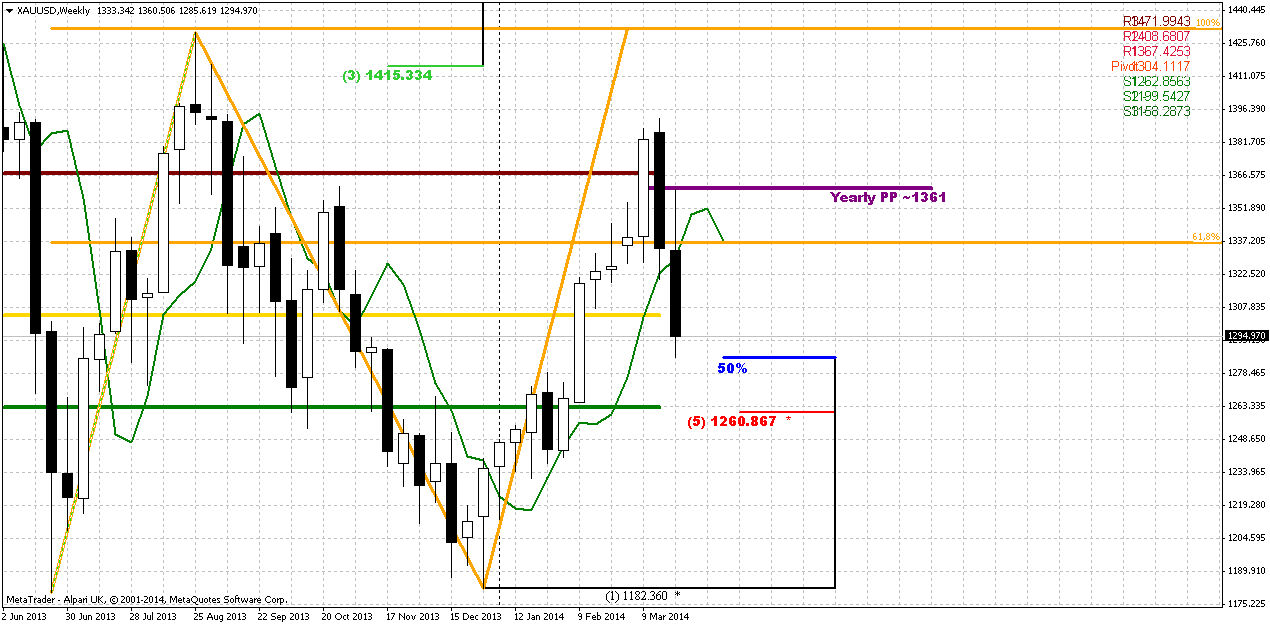
Weekly
Trend is bullish here, market is not at overbought. As we’ve said on previous week– nice thrust up, if any retracement will happen we could get DiNapoli “B&B” buy setup. That’s the pattern that we will be watching for in nearest 1-2 weeks here. Right now price has reached target of engulfing pattern – right at 50% weekly support. This probably could explain deeper retracement and the fact that market just slightly delayed at 3/8 support area. So, right now we have all conditions completed – thrust, price has reached significant fib support level with not longer than 1-3 periods after breaking below 3x3 DMA. So, let’s watch for bullish patterns on daily and intraday charts finally. On previous week we have tried to get any around 3/8 level, but didn’t get them. So, let’s see what will happen next…
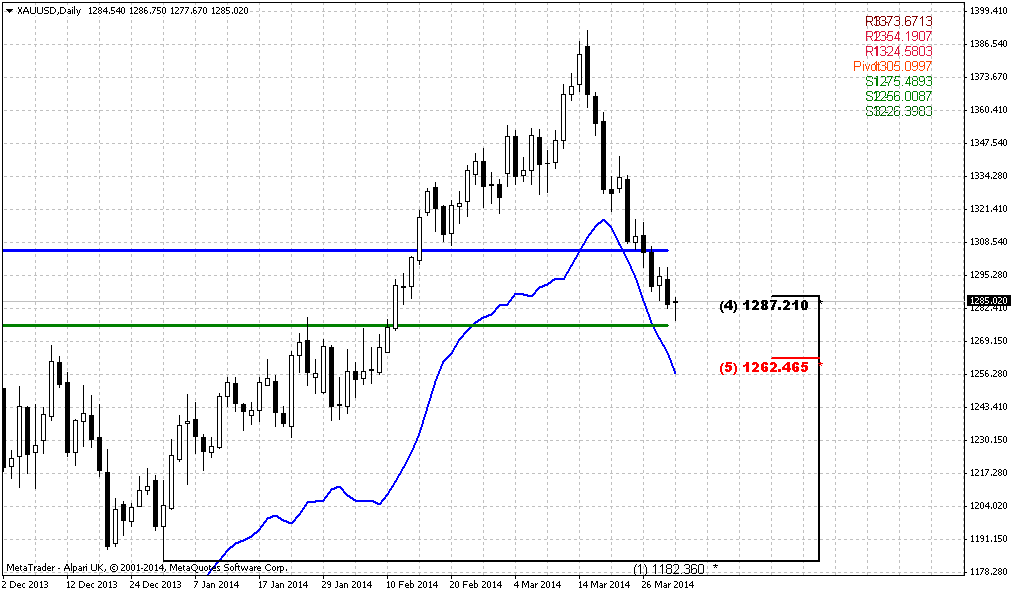
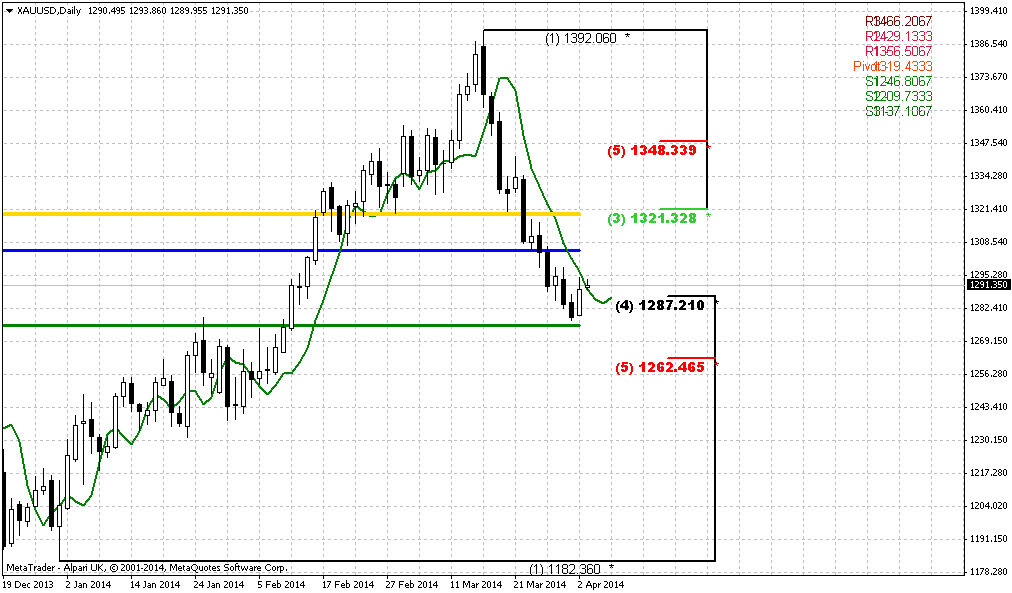
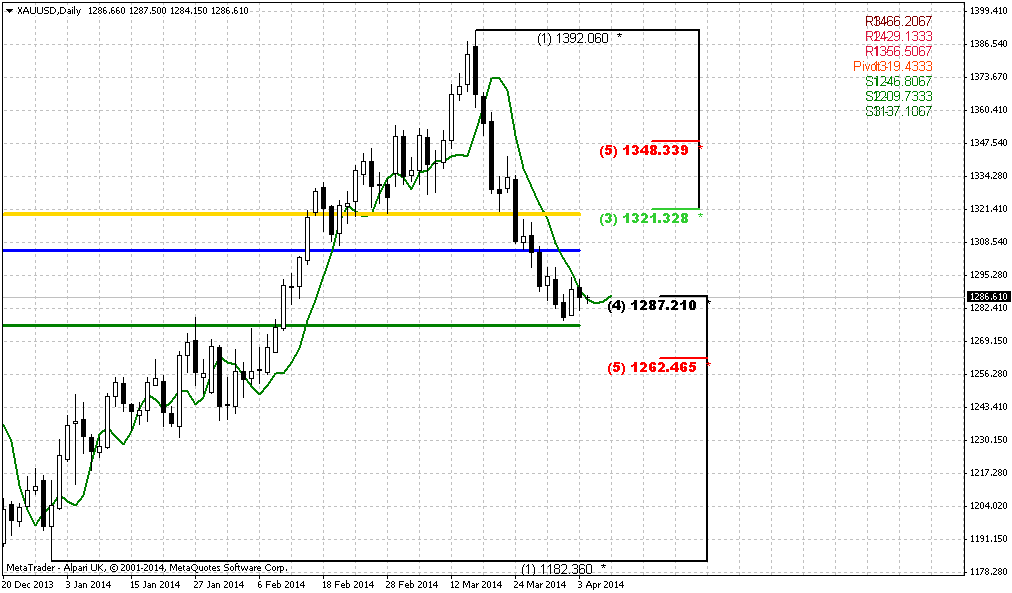
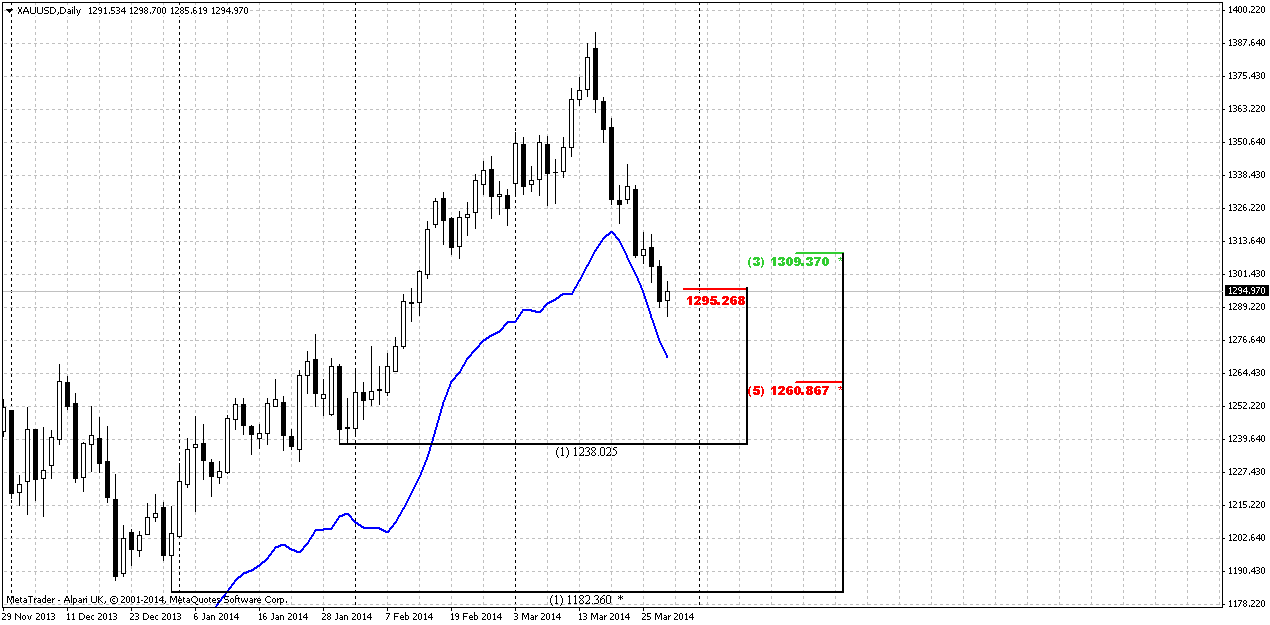
Daily
On previous week there was a technical event - “golden cross” – crossing of 50-day and 200-day MA. This treats as bullish signal and many investors watch for it. So, we have initial solid plunge down and market has reached 50% Fib support area around 1300. This area includes K-support and MPP. Market has tested it and moved slightly below it. If you remember we’ve mentioned this area as primary one where we will watch for bullish reversal patterns to step into B&B “Buy” on weekly chart, right?
Also, guys, retracement even to MPS1 at 1260 area will be acceptable and will not break bullish trend, since we know – until market stands above MPS1 – long term bullish trend is valid. Usually PS1 has to hold retracement within bullish trend and it works like some type of indicator of trend’s validation. But the moment of truth will happen earlier probably. If market is really bullish, then it should use weekly B&B to re-establish upward action…
Right now we have downward thrust as well, that also is suitable for its own directional DiNapoli pattern and who knows, may be we will get DRPO “Buy” here… But right now as you can see we have nothing yet. Only the fact that price has reached our primary support area.
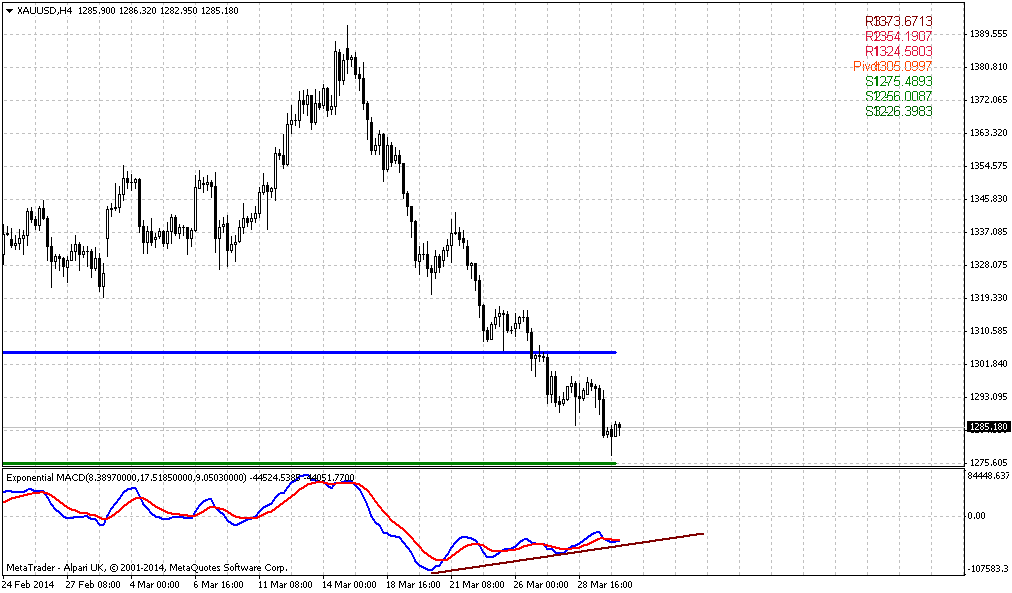
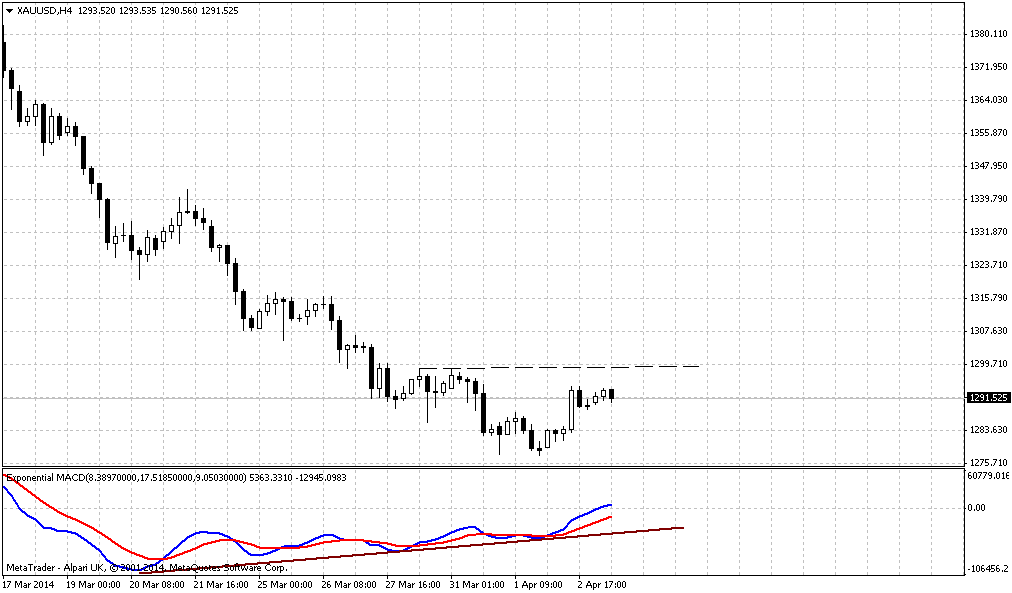
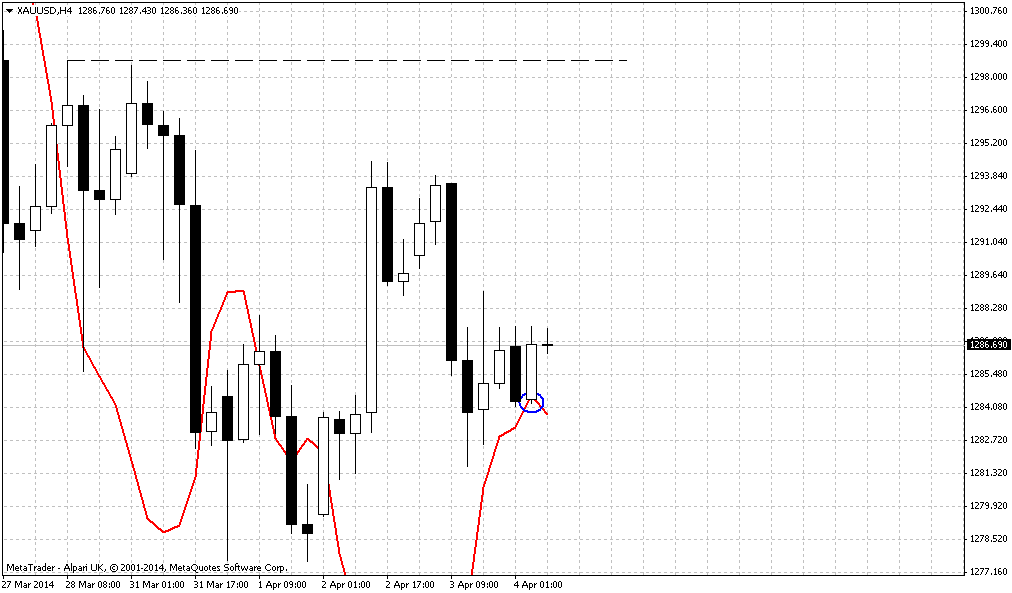
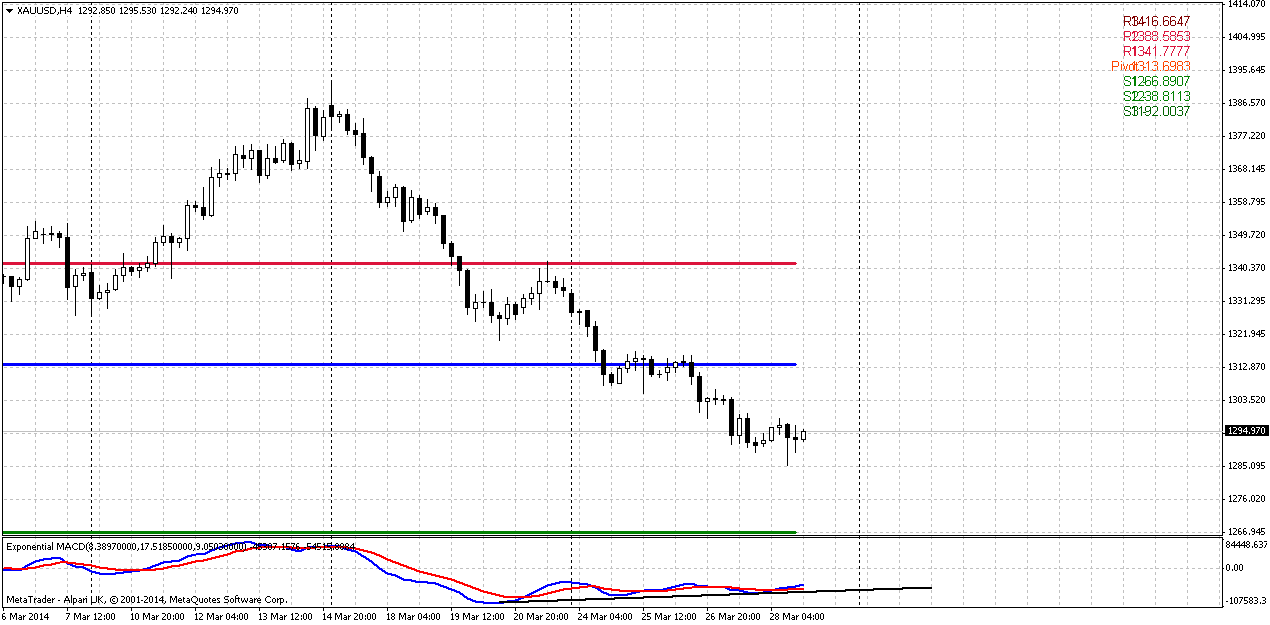
4-hour
Guys, nothing to catch here yet. First that I would like to see before we will start to speak about long entry is a breaking of current bearish tendency. We need to interrupt cequence of lower lows and lower highs here, but we do not see it yet here – only divergence with MACD, that actually holds within whole previous week.
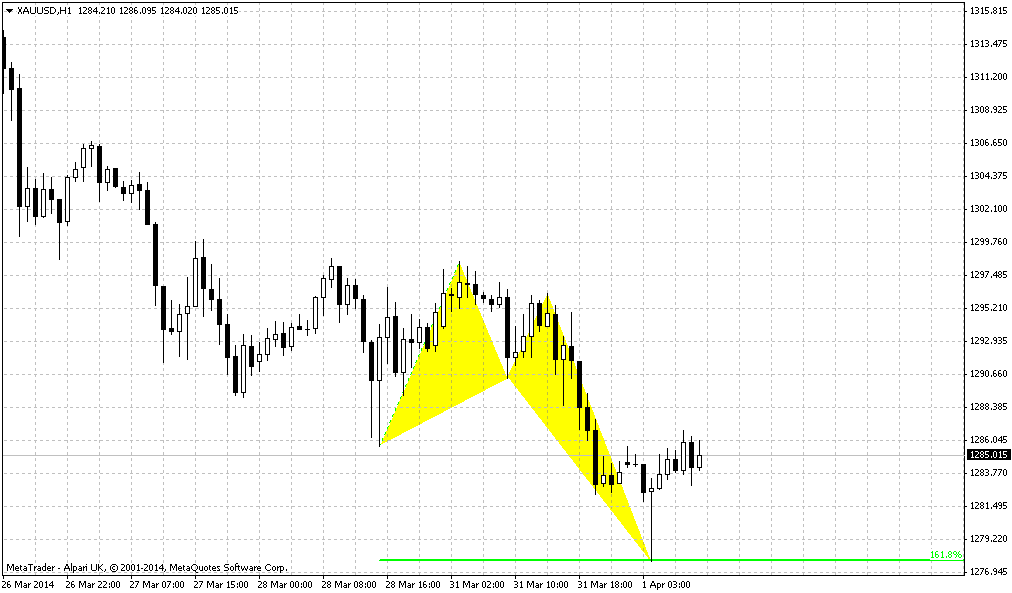
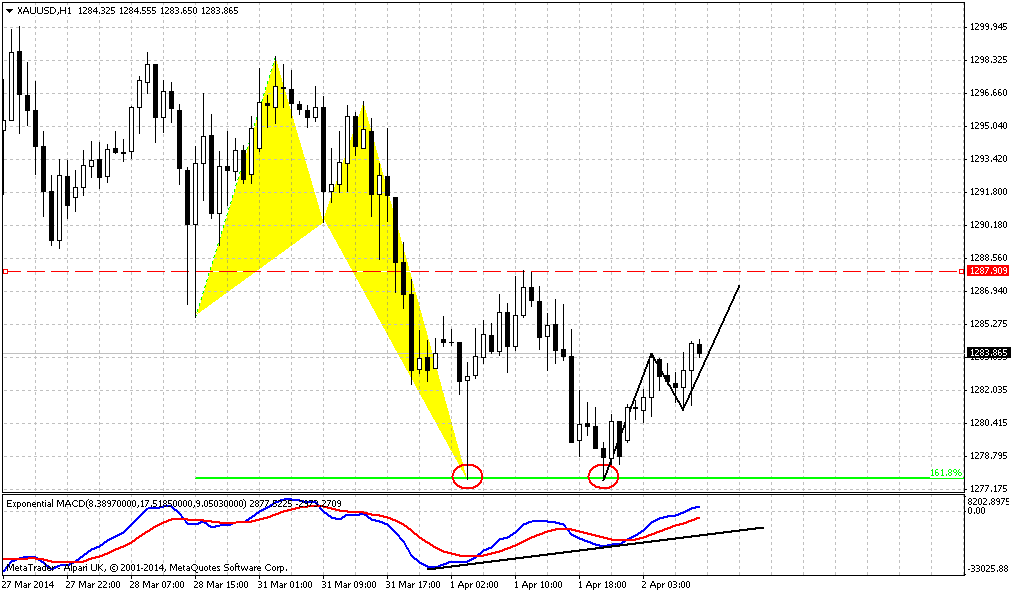
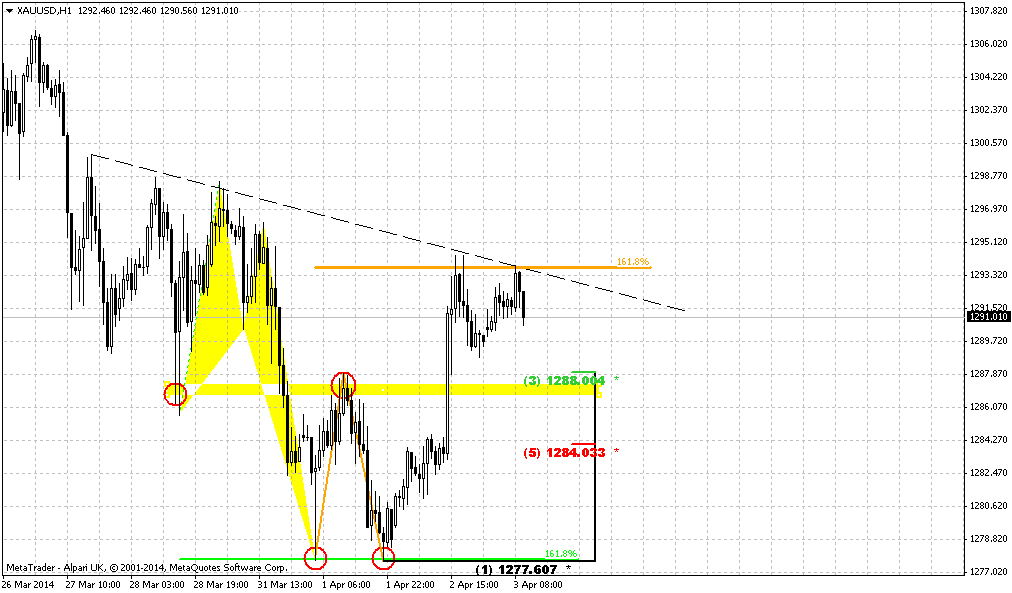
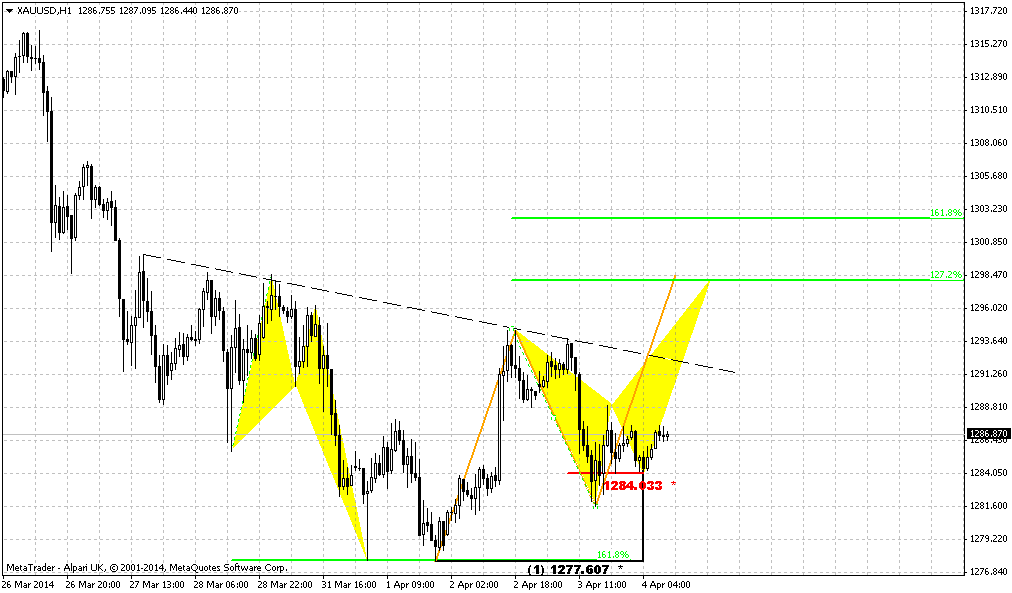
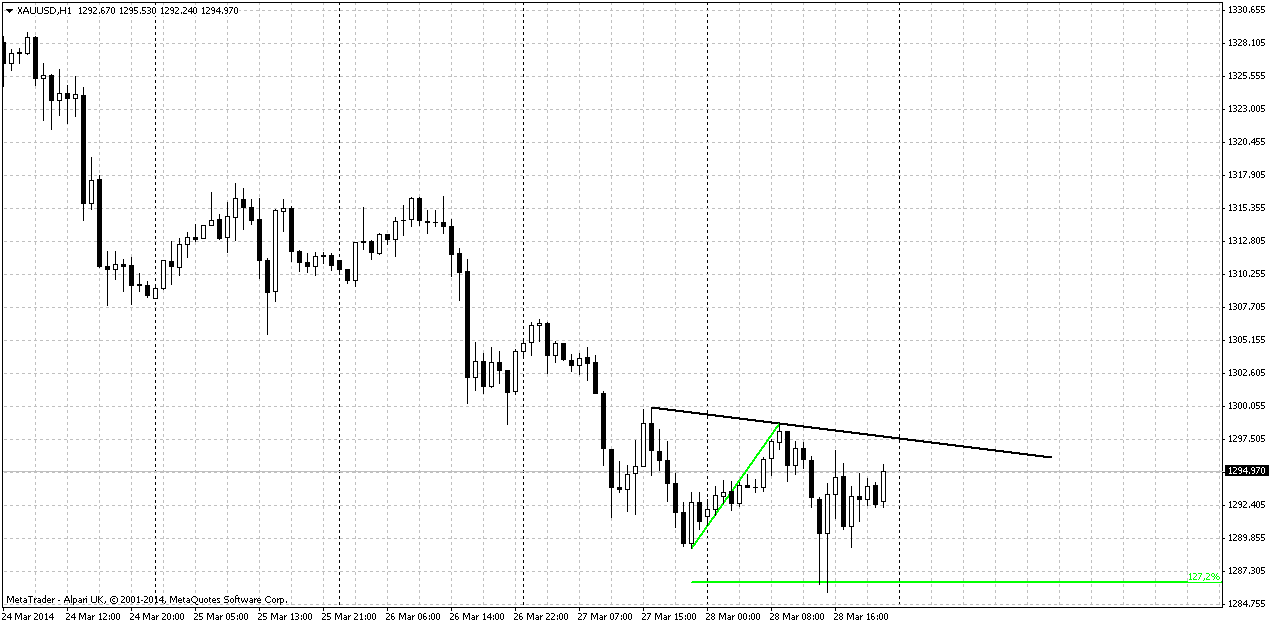
1-hour
On hourly chart I just draw one of possible scenarios. Since current low stands at 1.27 of previous retracement, we could get reversed H&S pattern, because if our analysis is correct and B&B will work – we should get bottom somewhere around...So gold market enters in period when we can’t leave it without monitoring even on short-term period.
Conclusion:
Since gold market stands in strong geopolitical and fundamental storm – price is flirting with very significant crucial level of YPP that potentially could lead to appearing of drastical moments, such as bearish stop grabber that could drastically shift force balance.
Our medium-term trading plan suggests taking long position and first area where we could get the chance to do it stands around 1300. Our reason for this is potential B&B “Buy” on weekly chart.
Unfortunately, we do not have any clear patterns that could let to do this. So, on next week we will keep monitor chances for that…
The technical portion of Sive's analysis owes a great deal to Joe DiNapoli's methods, and uses a number of Joe's proprietary indicators. Please note that Sive's analysis is his own view of the market and is not endorsed by Joe DiNapoli or any related companies.
According to Reuters news, Gold turned higher after touching six-week lows under $1,300 an ounce on Friday, but marked its second straight weekly decline as an improving U.S. economic outlook lifted the dollar and bolstered appetite for risk. Bullion has been volatile and has dropped about $100 an ounce from a six-month high in the last nine trading sessions on declining geopolitical tensions, strong U.S. economic data and comments by Federal Reserve Chair Janet Yellen that interest rates could rise in the first half of 2015. Low interest rates, which cut the opportunity cost of holding non-yielding bullion above other assets, had been an important factor driving bullion higher in recent years.
"Economic figures on consumer sentiment keep rates low, stocks up, but gold is seeing (a) short-covering rally today," said George Gero, vice-president at RBC Capital markets. "Market participants over the past days have started to look back at economic fundamentals and focus less on Russia, Crimea," Credit Suisse analyst Karim Cherif said. "You will probably see prices continue to slowly slide downward and unless you see renewed concern about the economic side or Russia, which doesn't seem to be the case, prices should fall."
The U.S. currency was aided by data showing U.S. consumer spending rose in February, in the latest sign that the economy was regaining strength after a setback caused by bad weather. "If we don't close below $1,290 today, we could see some consolidation around these levels ahead of the ECB on Thursday and the U.S. non-farm payrolls on Friday," VTB Capital analyst Andrey Kryuchenkov said, earlier in the session.
The next focus for the market will be the March non-farm employment report due next Friday, which will give clues on the strength of the economy. As a gauge of investor interest, holdings of the SPDR Gold Trust, the world's biggest gold-backed exchange-traded fund, remained unchanged from Thursday after two straight days of outflows.
PHYSICAL DEMAND
In the physical markets, traders said demand could pick up, given the recent sharp fall in prices but they remained cautious as consumers seemed uncertain about the price direction from current levels. Prices in the world's biggest consumer, China, remained at a discount to spot prices, indicating lack of fresh demand. Platinum was up 0.86 percent at $1,403.75 an ounce, while palladium gained 2.5 percent to $771.75 an ounce as a miners' strike in South Africa continued for the tenth week. "Platinum prices look rather cheap here considering the severity of the situation in South Africa," UBS said in a note. "We expect deliveries to start struggling in April – current prices suggest that the market is not fully pricing in this risk, therefore any indication of producer difficulties in meeting their contractual agreements with customers in the coming weeks is likely to have a considerable price impact."
So, guys, in to words we can acknowledge that looks like market is returning to it’s own and gradually getting some relief from geopolitical tensions and lot of macro data surprises.
Monthly
Although on previous week we’ve noted that price has moved above YPP and shifted trend to bullish, but also we said that this could shift to bearish stop grabber and that it is too early to be fascinating with bullish break. Now we have the picture how it could look like by the end of the month having another bearish week on our backs. At the same time let’s not to give dramatic turn to this event. All that I would like to point is that nothing is done yet here. Of cause turning down from YPP can’t treated as positive sign, but this is normal – respect and react on reaching solid resistance.
Taking into consideration all issues that we have now on gold market – I would not rush with reversal conclusions and treat current move down as retracement by far. Another interesting moment here is that market has not reached neckline of potential Double Bottom pattern and has not reached AB=CD upward target around 1430. The question what will it be – another gold’s trick and pitfall? When traders will take shorts - will market make another leg up to neckline before following retracement? If not, then market should not show too deep retracement right now. If gold is really bullish, and it stands above 0.618 target already – there is no reasons for too extended retracement to downside.
Long term upside target stands around yearly PR1. We know that gold likes to re-test previously broken lows and consolidations. 1540 area is monthly overbought, YPR1 and low border of broken long-term rectangle. As market was strongly oversold, very often it has tendency to reach overbought. Market is a impulse substance and reaction equals to counter reacion.
So our long-term analysis is the same. As another application of significantly oversold we’ve suggested retracement up. Thus, we’ve made an assumption of possible deeper upward retracement that could take a shape of AB=CD, and invalidation for this setup is previous lows around 1170s. Market right now is forming something like double bottom.
That’s being said – nearest target here is 1430 resistance level, while taking in consideration golds’ habits, geopolitical tension and technical issues, now we treat probability of reaching 1540 level as very high. In nearest future we have to keep close eye on current retracement down. Appearing of bearish grabber will force us to postpone upward expectations until it will not be resolved – either hits target or will be vanished.
Weekly
Trend is bullish here, market is not at overbought. As we’ve said on previous week– nice thrust up, if any retracement will happen we could get DiNapoli “B&B” buy setup. That’s the pattern that we will be watching for in nearest 1-2 weeks here. Right now price has reached target of engulfing pattern – right at 50% weekly support. This probably could explain deeper retracement and the fact that market just slightly delayed at 3/8 support area. So, right now we have all conditions completed – thrust, price has reached significant fib support level with not longer than 1-3 periods after breaking below 3x3 DMA. So, let’s watch for bullish patterns on daily and intraday charts finally. On previous week we have tried to get any around 3/8 level, but didn’t get them. So, let’s see what will happen next…
Daily
On previous week there was a technical event - “golden cross” – crossing of 50-day and 200-day MA. This treats as bullish signal and many investors watch for it. So, we have initial solid plunge down and market has reached 50% Fib support area around 1300. This area includes K-support and MPP. Market has tested it and moved slightly below it. If you remember we’ve mentioned this area as primary one where we will watch for bullish reversal patterns to step into B&B “Buy” on weekly chart, right?
Also, guys, retracement even to MPS1 at 1260 area will be acceptable and will not break bullish trend, since we know – until market stands above MPS1 – long term bullish trend is valid. Usually PS1 has to hold retracement within bullish trend and it works like some type of indicator of trend’s validation. But the moment of truth will happen earlier probably. If market is really bullish, then it should use weekly B&B to re-establish upward action…
Right now we have downward thrust as well, that also is suitable for its own directional DiNapoli pattern and who knows, may be we will get DRPO “Buy” here… But right now as you can see we have nothing yet. Only the fact that price has reached our primary support area.
4-hour
Guys, nothing to catch here yet. First that I would like to see before we will start to speak about long entry is a breaking of current bearish tendency. We need to interrupt cequence of lower lows and lower highs here, but we do not see it yet here – only divergence with MACD, that actually holds within whole previous week.
1-hour
On hourly chart I just draw one of possible scenarios. Since current low stands at 1.27 of previous retracement, we could get reversed H&S pattern, because if our analysis is correct and B&B will work – we should get bottom somewhere around...So gold market enters in period when we can’t leave it without monitoring even on short-term period.
Conclusion:
Since gold market stands in strong geopolitical and fundamental storm – price is flirting with very significant crucial level of YPP that potentially could lead to appearing of drastical moments, such as bearish stop grabber that could drastically shift force balance.
Our medium-term trading plan suggests taking long position and first area where we could get the chance to do it stands around 1300. Our reason for this is potential B&B “Buy” on weekly chart.
Unfortunately, we do not have any clear patterns that could let to do this. So, on next week we will keep monitor chances for that…
The technical portion of Sive's analysis owes a great deal to Joe DiNapoli's methods, and uses a number of Joe's proprietary indicators. Please note that Sive's analysis is his own view of the market and is not endorsed by Joe DiNapoli or any related companies.