Sive Morten
Special Consultant to the FPA
- Messages
- 18,695
Fundamentals
Weekly Gold Tading Report prepared by Sive Morten exclusively for ForexPeaceArmy.com
As Reuters reports Gold edged higher on Friday, snapping two days of losses, as revisions to U.S. payrolls data supported speculation that the Federal Reserve may hold off raising interest rates in the immediate future.
U.S. job growth rebounded last month and the unemployment rate dropped to a near seven-year low of 5.4 percent, potentially keeping the Federal Reserve on track to hike interest rates this year.
However, March payrolls were revised to show only 85,000 jobs created, the smallest number since June 2012.
Mixed economic data has pushed earlier expectations for the Federal Reserve to announce a rate rise at its June policy meeting back to later this year.
"What our gangbuster jobs report said today is that short-term, it does not look like there will be an increase in interest rates," said George Gero, precious metals strategist for RBC Capital Markets in New York.
Gero noted that the report prompted short-covering among investors who had piled on new shorts during the previous two sessions' losses.
Gold prices have been stuck in a narrow range of around $50 an ounce since mid-March, as uncertainty over U.S. monetary policy pushed buyers to the sidelines. A failure to sustain a push above $1,200 an ounce last week is also weighing, traders said.
"The more we do not break upside resistance, the more the chance of a bid sell-off," Afshin Nabavi, head of trading at MKS in Switzerland, said. "I think $1,100 should be tested sooner rather than later."
South Africa's National Union of Mineworkers (NUM) said on Friday it was shocked by platinum producer Lonmin's plan to cut mining jobs and would fight the decision.
The company has said it is in talks with unions and employees to cut 3,500 jobs at its mines.
Recent CFTC data changes are not very significant, but still, we mostly see hints on bearish strength. Take a look that overall net long speculative position has become smaller, while open interest even has increased slightly. It means that short speculative position has increased, i.e. new contracts have been opened. And this makes closer the moment of possible drop on gold market as it was mentioned in comments above.
Indeed despite the poverty of recent US data gold was not able to break through major 1200 area. It mostly means that major decision has made by investors and it turns gold down. Poor data just postpones a bit this moment probably.
 Summary:
Technicals
Monthly
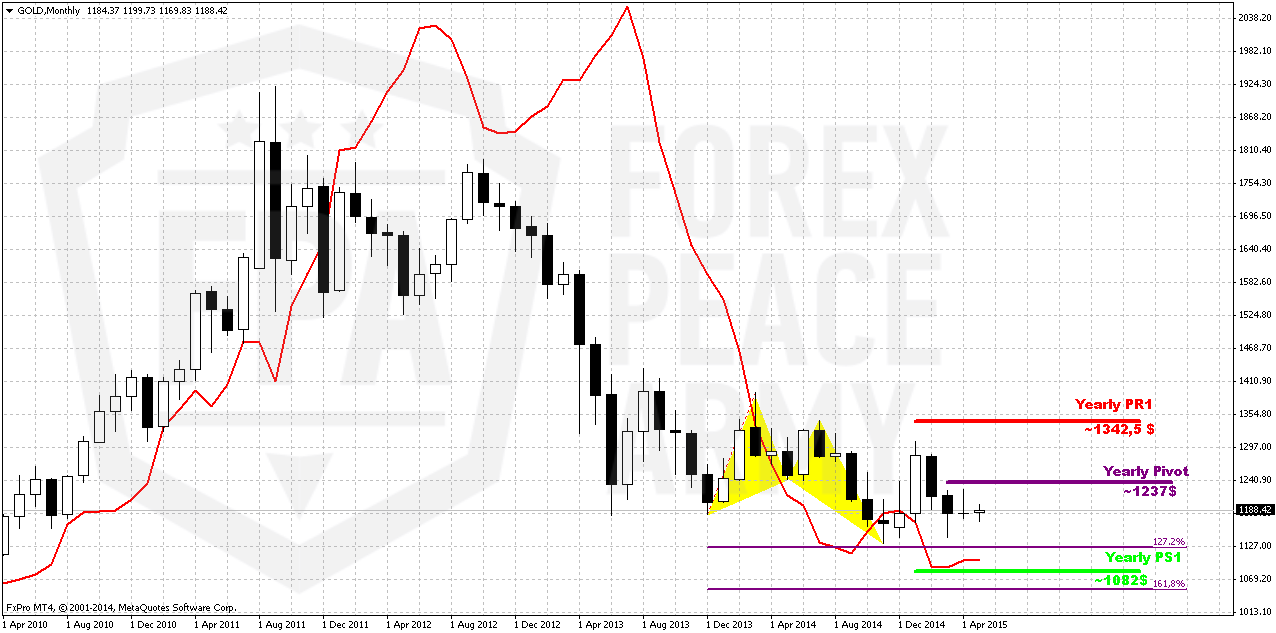
As we can see gold stands rather flat on monthly chart within second month in a row. But between April standing and May standing is big difference. In May investors are coming to action, at least, CFTC data shows the signs of it, while in April CFTC was absolutely anemic and market was driven by technical and news flows. So, this lets us hope that we will see some acceleration soon.
We just could say that downward continuation has become visible again on monthly chart, as well as bearish dynamic pressure. On long-term horizon we still have last big pattern in progress that is Volatility breakout (VOB). It suggests at least 0.618 AB-CD down. And this target is 1050$. At the same time we need 1130 breakout to start clearly speak on 1050 target.
In the beginning of the year market showed solid upside action. Gold was able to exceed yearly pivot, passed half way to Yearly Pivot resistance 1 but right now has reversed down and closed below YPP. From technical point of view this is bearish sign. This could be very significant moment and next logical destination will be yearly pivot support 1 around 1083$.
Recent US economy data mostly was positive but not as strong as investors have expected. Many investors concern about anemic wage growth, although in recent time this indicator shows improving. So, it seems that gold will remain hostage of dollar value and US economical data (mostly inflation) in nearest perspective. Approximately the same was announced by Fed in forecast on inflation and had become a reason of dovish approach to rate hiking. Another concern right now is too strong dollar that becomes a problem per se for economy growth and kills inflation. Prices are fallen so no needs to hike rates.
Still, if we will take into consideration geopolitical situation and risks that have appeared recently, it could happen that situation will change, especially if situation in Ukraine will escalate and peaceful regulation will fail. Day by day we see worrying geopolitical news. But this, guys, is just only thing that could change situation drastically. Looking at other factors – gold is bearish as fundamentally as technically.
That’s being said, economical data in general still supports further gold decreasing in long term but geopolicy could bring significant adjustment. Unfortunately the geopolicy is sphere where we can’t do much. As gold has passed through 1200, our next destination point is previous lows at 1130, but since gold is returning to 1130 for second time – this is temporal destination and we should prepare for further downward action. Besides, right now we can clear recognized bearish dynamic pressure on monthly chart. Take a look, although trend has turned bullish, but market was unable to show more or less meaningful upside action. Right now we see the tendency of lower highs creation and this significantly increases chances on downward breakout.
Weekly
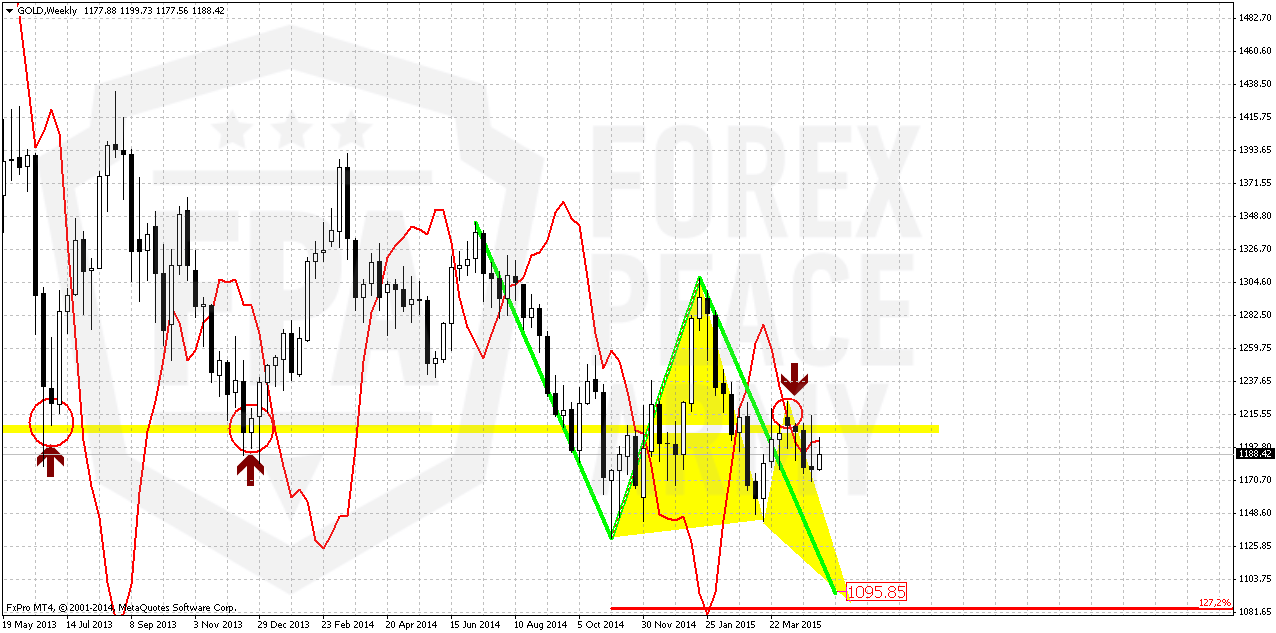
So guys, be my guests – another bearish grabber in our collection last week. Weekly chart continues to work “on perspective” of possible downward breakout since all patterns that we have here mostly are bearish. If you will take a look at weekly chart closely you will find a lot of different targets – AB-CD’s, couple of butterflies etc. By the way, most recent action also could turn to butterfly… and all of them have targets below current level.
In last two weeks, as gold has failed to move through long-term 1215 resistance, signs of bearish dynamic pressure here have become clearer and it turns to active phase as trend has turned bearish. Besides, we have multiple bearish grabbers here and all of them are valid and point at the same target – recent lows.
Speaking on invalidation points… if market will continue move up somehow - until it will hold below 1313 top – bearish sentiment will be valid, because monthly bearish dynamic pressure will be valid and market will keep chance on forming butterfly. Only if market will move above 1313 top – it will break tendency of lower highs and put under question further downward action in medium term perspective.
This looks not very possible right now. Grabbers have started to work as well as bearish dynamic pressure, since gold moves lower while trend is bullish. CFTC data also is starting to support this. This points on high probability of taking out 1140-1130 lows and lead market simultaneously to AB=CD and butterfly destination points.
This confirms that return back to 1130 area will be temporal event and just preparation for further drop. So, currently we have no sense to change trading plan since our context is still valid. To destroy this setup gold needs at least erase the grabbers.
All other targets stand significantly lower – 1080, 1050 and even 990$.
Daily
So, upward retracement to 1200 area that we’ve expected last week has happened. Probably it makes no sense to comment yesterday action. In fact, despite NFP release we mostly has inside session. Our bearish butterfly is still valid. Daily chart of gold, guys, is a bit difficult stuff. We have clear bearish pattern, but the action that market shows in last two months absolutely is not bearish. Some flat action. It is always difficult to correctly analyze this. Very often it suggests existing of opposite power, as we call it “dynamic pressure” and suggest strong breakout in opposite direction. But sometimes this could be just indecision either in data vacuum or seasonal one.
Still, let’s try to find some nuances that could shed some light on recent action. Does it really hold the menace of bullish breakout or not. Actually, since March, we could draw sideways consolidation and only attention to non-obvious features could help us understand what will happen. This feature is failure breakouts.
First one was to upside. The main feature of failure breakouts is it leads market to opposite border of consolidation and we see that this indeed has happened. Second failure breakout was to downside. I’ve marked all of them by red circles. What do we see here? Market has moved up, but has not quite reached the opposite border. Further we get even more – recent one failure breakout was not able to push market even above the middle of the range – and market has stuck around MPP and 1200 resistance.
Now let’s take a look at yellow rectangle. Try to imagine that we have not 4 candles but just two big ones. In this case we get huge bearish engulfing pattern at 1215 resistance and what recent upside action is? Right, just is upside retracement inside the body of engulfing. It means that we could get at least AB=CD down very soon. Recent action mostly shows the weakness of the market, it looks really heavy. Even gold positive events couldn’t give it additional power and push it higher. So drop is very close probably…
4-hour
After discussion above we logically move to intraday charts. First is – here we have classical engulfing target of AB=CD that points on 1150 area. Another pattern that could be formed (we do not know it yet) that also confirms the same area is butterfly “buy”.
But here we mostly are interested with nuances again. Particularly speaking – high wave pattern, it’s range and grabber quality of this candle.
In short-term perspective this candle will clarify everything. Since this is simultaneously grabber and high wave, downward breakout out from its range will put the start for downward action to 1150 area. While upside breakout of this candle will not be bearish supportive. It will not mean that bearish trend is over but it will force us to wait and look for new signs and signals from the market. Thus, on Monday we will watch for this high wave candle and its range.
1-hour
If still want to take short position you can do this by two ways. First one is, as we’ve said – wait for downward breakout of high wave candle down and enter on nearest upside retracement. Another way, as we’ve drawn on chart below. Recent action is not a thrust, it is just retracement by price behavior and even reminds flag. We know that most recent swing is bearish grabber with invalidation point at the top. And right now market shows 5/8 retracement up inside its body. So, this is reasonable area for attempt to take short position with reasonable loss order about 5$ per contract.
Conclusion:
Long-term picture remains bearish and major patterns stand intact and even have become clearer last week. CFTC finally starts to show bears’ supportive data but we also have to agree that changes in numbers are minimal yet. Thus, upward action has blur perspective and reliability. As weekly chart has given us bearish grabber and dynamic pressure, we mostly should prepare for taking short position. At the same time recent data was soft and investors have taken more balanced position and mostly wait for some driving factor that finally could clarify situation and at least short-term direction.
On short-term charts market shows some signs of weakness and inability to pass through key resistance level even with support from poor statistics numbers.
The technical portion of Sive's analysis owes a great deal to Joe DiNapoli's methods, and uses a number of Joe's proprietary indicators. Please note that Sive's analysis is his own view of the market and is not endorsed by Joe DiNapoli or any related companies.
Weekly Gold Tading Report prepared by Sive Morten exclusively for ForexPeaceArmy.com
As Reuters reports Gold edged higher on Friday, snapping two days of losses, as revisions to U.S. payrolls data supported speculation that the Federal Reserve may hold off raising interest rates in the immediate future.
U.S. job growth rebounded last month and the unemployment rate dropped to a near seven-year low of 5.4 percent, potentially keeping the Federal Reserve on track to hike interest rates this year.
However, March payrolls were revised to show only 85,000 jobs created, the smallest number since June 2012.
Mixed economic data has pushed earlier expectations for the Federal Reserve to announce a rate rise at its June policy meeting back to later this year.
"What our gangbuster jobs report said today is that short-term, it does not look like there will be an increase in interest rates," said George Gero, precious metals strategist for RBC Capital Markets in New York.
Gero noted that the report prompted short-covering among investors who had piled on new shorts during the previous two sessions' losses.
Gold prices have been stuck in a narrow range of around $50 an ounce since mid-March, as uncertainty over U.S. monetary policy pushed buyers to the sidelines. A failure to sustain a push above $1,200 an ounce last week is also weighing, traders said.
"The more we do not break upside resistance, the more the chance of a bid sell-off," Afshin Nabavi, head of trading at MKS in Switzerland, said. "I think $1,100 should be tested sooner rather than later."
South Africa's National Union of Mineworkers (NUM) said on Friday it was shocked by platinum producer Lonmin's plan to cut mining jobs and would fight the decision.
The company has said it is in talks with unions and employees to cut 3,500 jobs at its mines.
Recent CFTC data changes are not very significant, but still, we mostly see hints on bearish strength. Take a look that overall net long speculative position has become smaller, while open interest even has increased slightly. It means that short speculative position has increased, i.e. new contracts have been opened. And this makes closer the moment of possible drop on gold market as it was mentioned in comments above.
Indeed despite the poverty of recent US data gold was not able to break through major 1200 area. It mostly means that major decision has made by investors and it turns gold down. Poor data just postpones a bit this moment probably.
Technicals
Monthly
As we can see gold stands rather flat on monthly chart within second month in a row. But between April standing and May standing is big difference. In May investors are coming to action, at least, CFTC data shows the signs of it, while in April CFTC was absolutely anemic and market was driven by technical and news flows. So, this lets us hope that we will see some acceleration soon.
We just could say that downward continuation has become visible again on monthly chart, as well as bearish dynamic pressure. On long-term horizon we still have last big pattern in progress that is Volatility breakout (VOB). It suggests at least 0.618 AB-CD down. And this target is 1050$. At the same time we need 1130 breakout to start clearly speak on 1050 target.
In the beginning of the year market showed solid upside action. Gold was able to exceed yearly pivot, passed half way to Yearly Pivot resistance 1 but right now has reversed down and closed below YPP. From technical point of view this is bearish sign. This could be very significant moment and next logical destination will be yearly pivot support 1 around 1083$.
Recent US economy data mostly was positive but not as strong as investors have expected. Many investors concern about anemic wage growth, although in recent time this indicator shows improving. So, it seems that gold will remain hostage of dollar value and US economical data (mostly inflation) in nearest perspective. Approximately the same was announced by Fed in forecast on inflation and had become a reason of dovish approach to rate hiking. Another concern right now is too strong dollar that becomes a problem per se for economy growth and kills inflation. Prices are fallen so no needs to hike rates.
Still, if we will take into consideration geopolitical situation and risks that have appeared recently, it could happen that situation will change, especially if situation in Ukraine will escalate and peaceful regulation will fail. Day by day we see worrying geopolitical news. But this, guys, is just only thing that could change situation drastically. Looking at other factors – gold is bearish as fundamentally as technically.
That’s being said, economical data in general still supports further gold decreasing in long term but geopolicy could bring significant adjustment. Unfortunately the geopolicy is sphere where we can’t do much. As gold has passed through 1200, our next destination point is previous lows at 1130, but since gold is returning to 1130 for second time – this is temporal destination and we should prepare for further downward action. Besides, right now we can clear recognized bearish dynamic pressure on monthly chart. Take a look, although trend has turned bullish, but market was unable to show more or less meaningful upside action. Right now we see the tendency of lower highs creation and this significantly increases chances on downward breakout.
Weekly
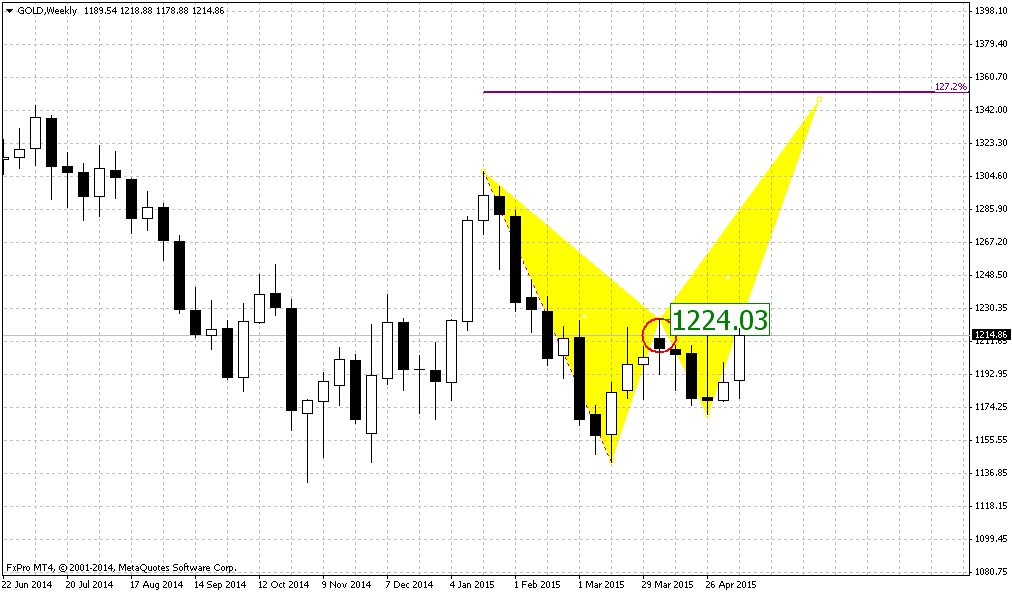
So guys, be my guests – another bearish grabber in our collection last week. Weekly chart continues to work “on perspective” of possible downward breakout since all patterns that we have here mostly are bearish. If you will take a look at weekly chart closely you will find a lot of different targets – AB-CD’s, couple of butterflies etc. By the way, most recent action also could turn to butterfly… and all of them have targets below current level.
In last two weeks, as gold has failed to move through long-term 1215 resistance, signs of bearish dynamic pressure here have become clearer and it turns to active phase as trend has turned bearish. Besides, we have multiple bearish grabbers here and all of them are valid and point at the same target – recent lows.
Speaking on invalidation points… if market will continue move up somehow - until it will hold below 1313 top – bearish sentiment will be valid, because monthly bearish dynamic pressure will be valid and market will keep chance on forming butterfly. Only if market will move above 1313 top – it will break tendency of lower highs and put under question further downward action in medium term perspective.
This looks not very possible right now. Grabbers have started to work as well as bearish dynamic pressure, since gold moves lower while trend is bullish. CFTC data also is starting to support this. This points on high probability of taking out 1140-1130 lows and lead market simultaneously to AB=CD and butterfly destination points.
This confirms that return back to 1130 area will be temporal event and just preparation for further drop. So, currently we have no sense to change trading plan since our context is still valid. To destroy this setup gold needs at least erase the grabbers.
All other targets stand significantly lower – 1080, 1050 and even 990$.
Daily
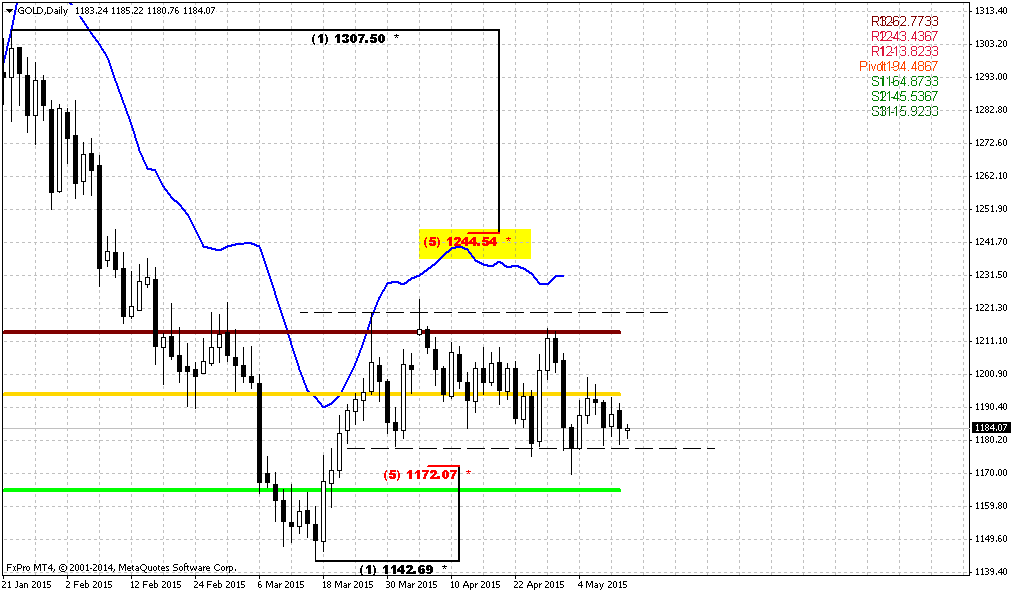
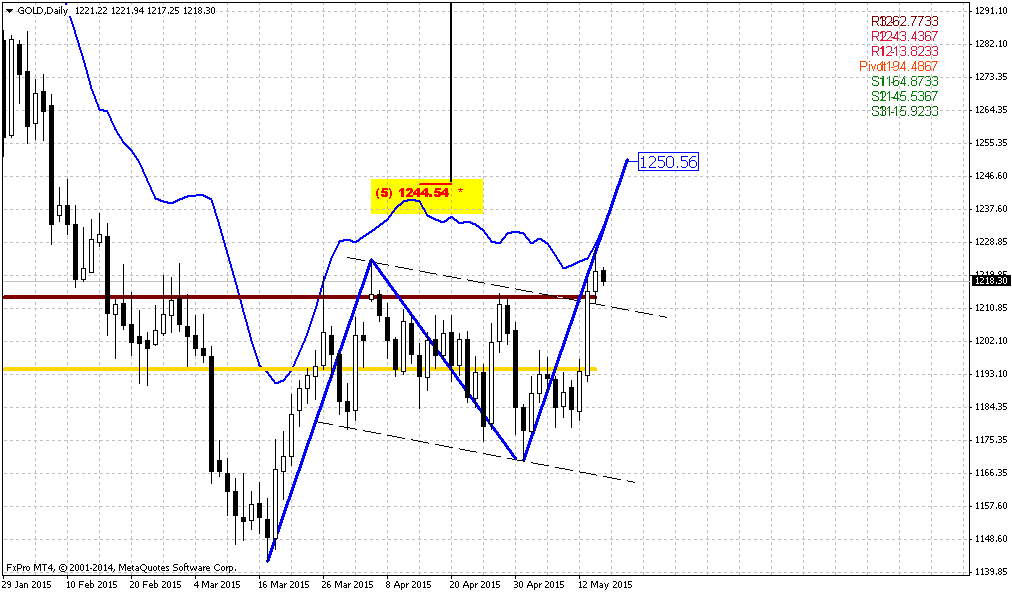
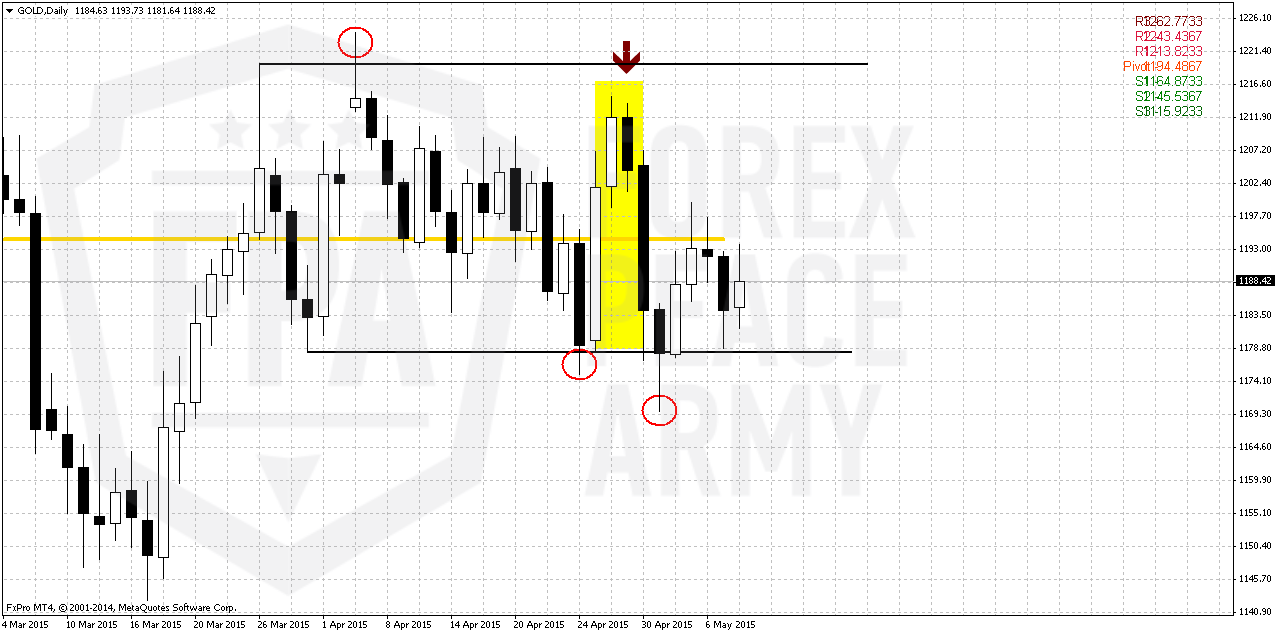
So, upward retracement to 1200 area that we’ve expected last week has happened. Probably it makes no sense to comment yesterday action. In fact, despite NFP release we mostly has inside session. Our bearish butterfly is still valid. Daily chart of gold, guys, is a bit difficult stuff. We have clear bearish pattern, but the action that market shows in last two months absolutely is not bearish. Some flat action. It is always difficult to correctly analyze this. Very often it suggests existing of opposite power, as we call it “dynamic pressure” and suggest strong breakout in opposite direction. But sometimes this could be just indecision either in data vacuum or seasonal one.
Still, let’s try to find some nuances that could shed some light on recent action. Does it really hold the menace of bullish breakout or not. Actually, since March, we could draw sideways consolidation and only attention to non-obvious features could help us understand what will happen. This feature is failure breakouts.
First one was to upside. The main feature of failure breakouts is it leads market to opposite border of consolidation and we see that this indeed has happened. Second failure breakout was to downside. I’ve marked all of them by red circles. What do we see here? Market has moved up, but has not quite reached the opposite border. Further we get even more – recent one failure breakout was not able to push market even above the middle of the range – and market has stuck around MPP and 1200 resistance.
Now let’s take a look at yellow rectangle. Try to imagine that we have not 4 candles but just two big ones. In this case we get huge bearish engulfing pattern at 1215 resistance and what recent upside action is? Right, just is upside retracement inside the body of engulfing. It means that we could get at least AB=CD down very soon. Recent action mostly shows the weakness of the market, it looks really heavy. Even gold positive events couldn’t give it additional power and push it higher. So drop is very close probably…
4-hour
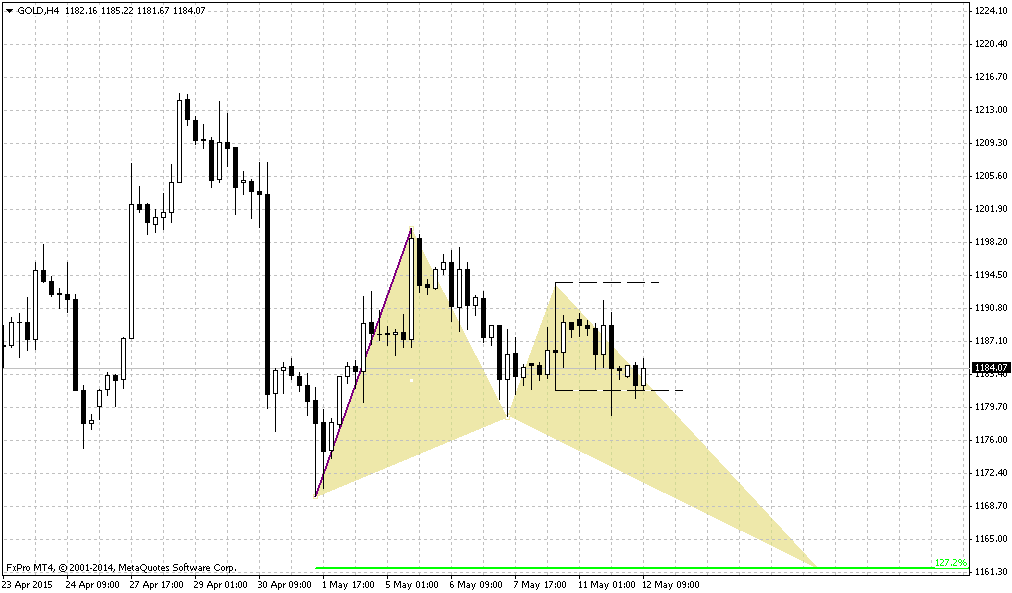
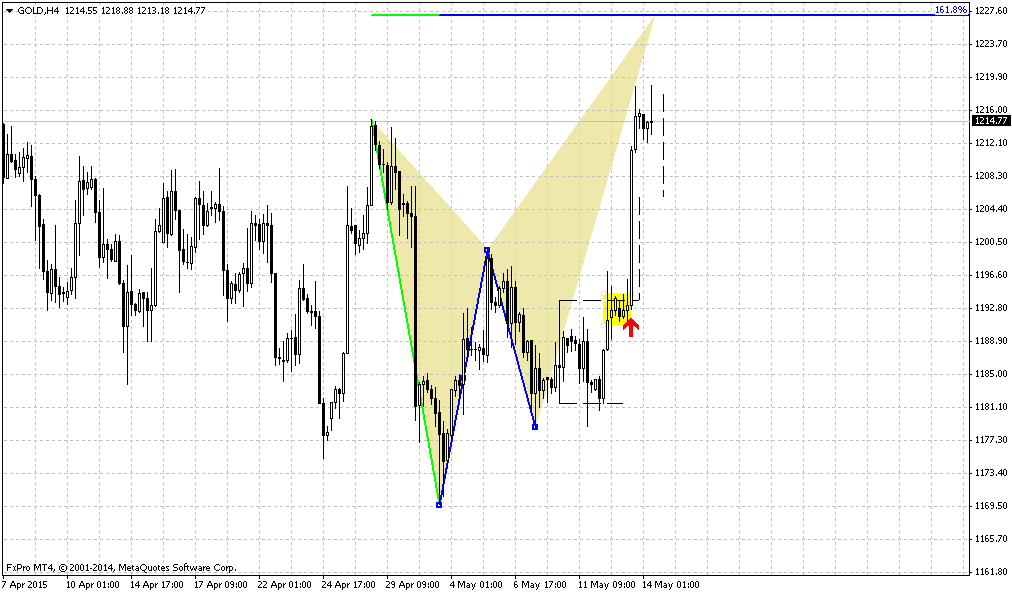
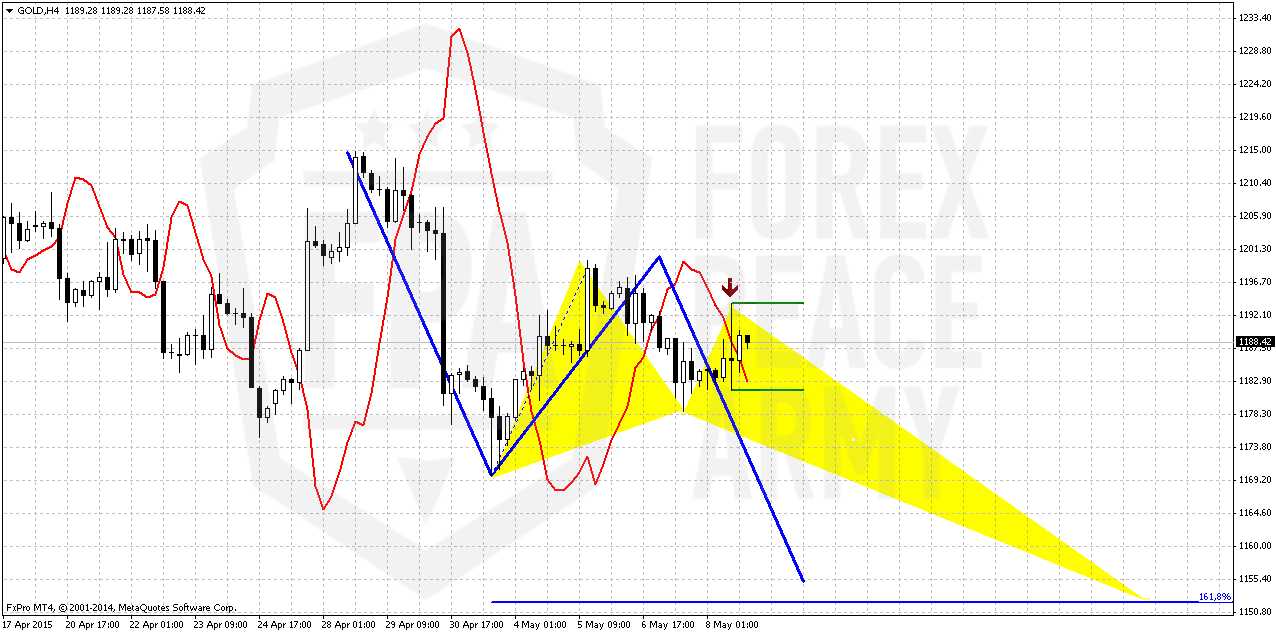
After discussion above we logically move to intraday charts. First is – here we have classical engulfing target of AB=CD that points on 1150 area. Another pattern that could be formed (we do not know it yet) that also confirms the same area is butterfly “buy”.
But here we mostly are interested with nuances again. Particularly speaking – high wave pattern, it’s range and grabber quality of this candle.
In short-term perspective this candle will clarify everything. Since this is simultaneously grabber and high wave, downward breakout out from its range will put the start for downward action to 1150 area. While upside breakout of this candle will not be bearish supportive. It will not mean that bearish trend is over but it will force us to wait and look for new signs and signals from the market. Thus, on Monday we will watch for this high wave candle and its range.
1-hour
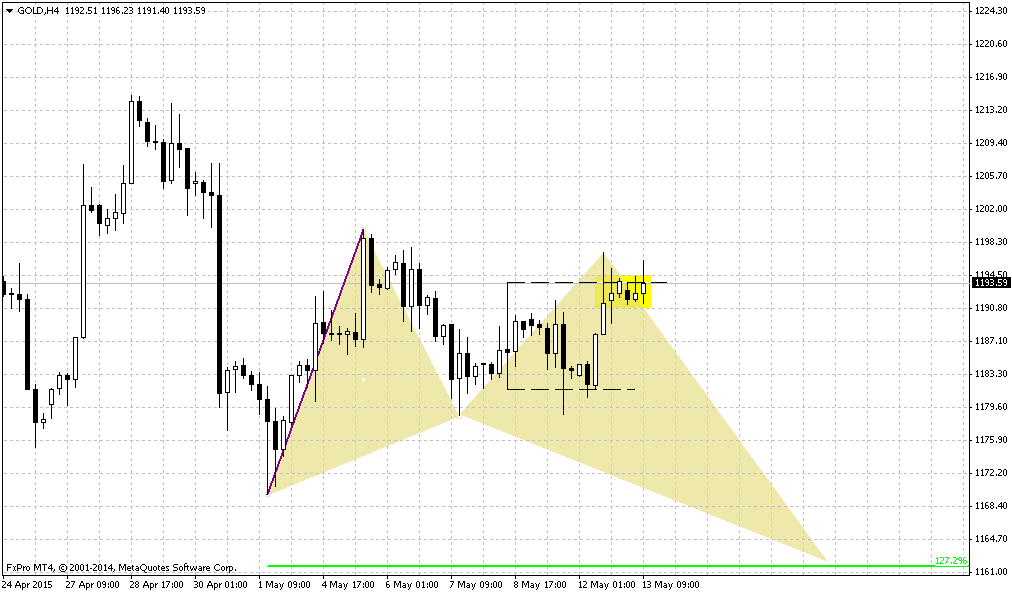
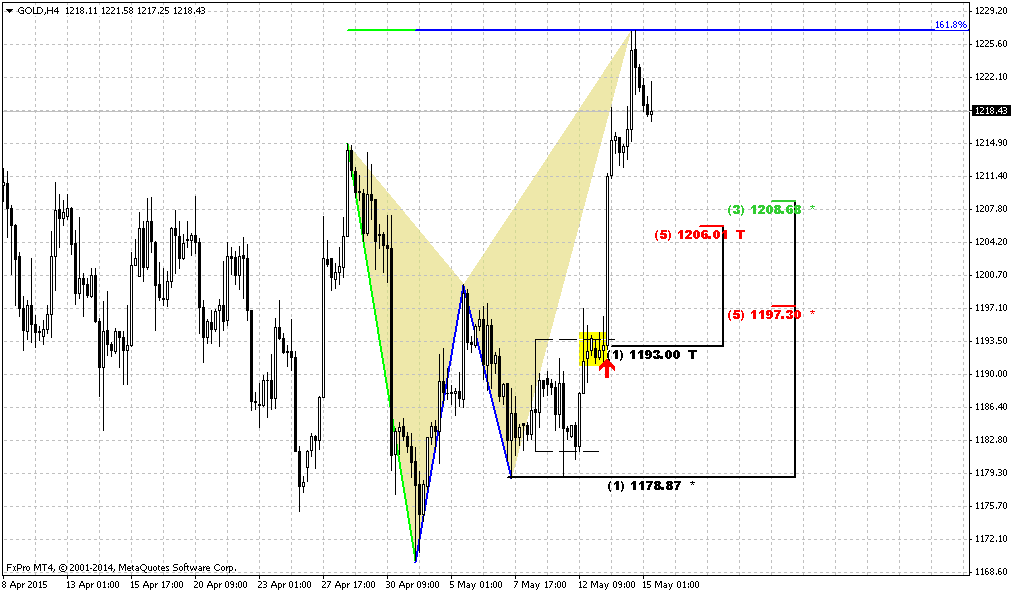
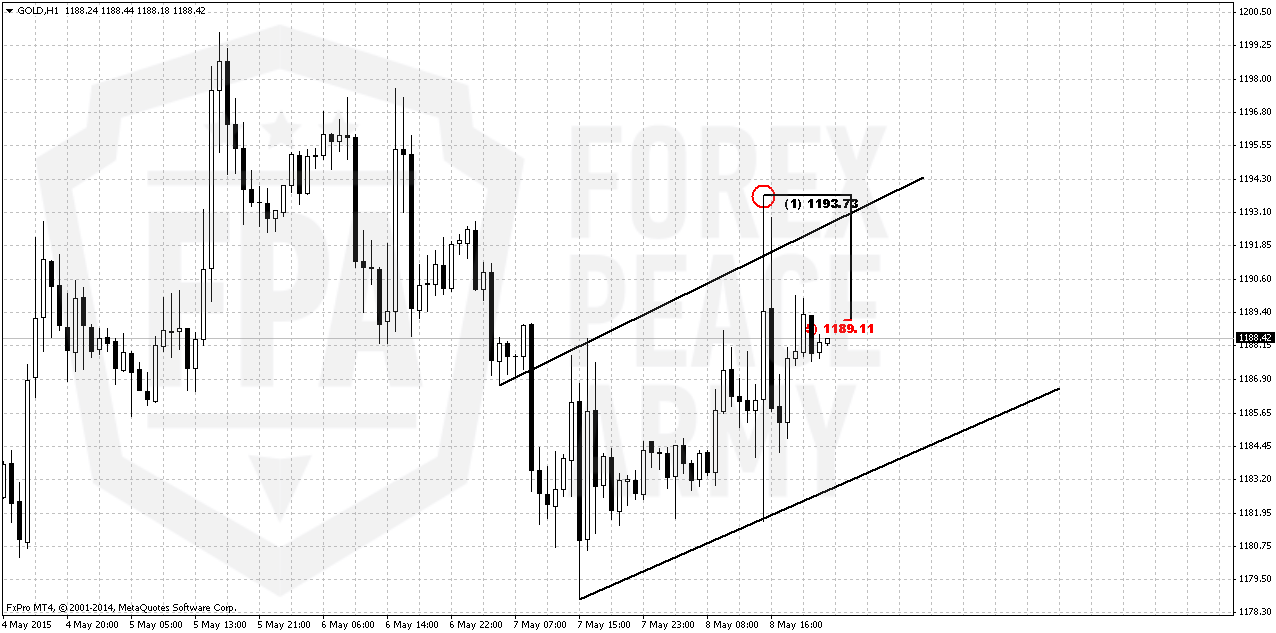
If still want to take short position you can do this by two ways. First one is, as we’ve said – wait for downward breakout of high wave candle down and enter on nearest upside retracement. Another way, as we’ve drawn on chart below. Recent action is not a thrust, it is just retracement by price behavior and even reminds flag. We know that most recent swing is bearish grabber with invalidation point at the top. And right now market shows 5/8 retracement up inside its body. So, this is reasonable area for attempt to take short position with reasonable loss order about 5$ per contract.
Conclusion:
Long-term picture remains bearish and major patterns stand intact and even have become clearer last week. CFTC finally starts to show bears’ supportive data but we also have to agree that changes in numbers are minimal yet. Thus, upward action has blur perspective and reliability. As weekly chart has given us bearish grabber and dynamic pressure, we mostly should prepare for taking short position. At the same time recent data was soft and investors have taken more balanced position and mostly wait for some driving factor that finally could clarify situation and at least short-term direction.
On short-term charts market shows some signs of weakness and inability to pass through key resistance level even with support from poor statistics numbers.
The technical portion of Sive's analysis owes a great deal to Joe DiNapoli's methods, and uses a number of Joe's proprietary indicators. Please note that Sive's analysis is his own view of the market and is not endorsed by Joe DiNapoli or any related companies.