Sive Morten
Special Consultant to the FPA
- Messages
- 18,673
Fundamentals
Weekly Gold Tading Report prepared by Sive Morten exclusively for ForexPeaceArmy.com
As Reuters reports Gold held near three-month highs on Friday, heading for its biggest weekly gain since mid-January, as soft U.S. consumer sentiment data weighed on the dollar and further diminished expectations for a near-term rise in U.S. interest rates.
The dollar eased against the euro in the wake of the report, allowing gold to extend a three-day rally that took prices to their highest since mid-February on Thursday at $1,227.04.
Recent economic reports have supported market expectations that the economy is not strong enough for the Fed to start raising record-low rates from June.
Data released on Friday showed U.S. consumer sentiment fell more than expected this month, though an earlier report showed manufacturing activity growth in New York State accelerated in May after weakening for three consecutive months.
"If the data remains soft in the United States, this rally has potential," Commerzbank analyst Eugen Weinberg said. "When data is more on the soft side, the market will be looking for indications on when the Fed will be raising interest rates."
Gold is sensitive to rate expectations, as higher rates increase the opportunity cost of holding non-yielding bullion, while boosting the dollar, in which it is priced.
"Our view is that the underlying data is getting weaker and it has been weak for a while but I think there are still some in the market that seem to be holding out hope that maybe we will get a rebound in the U.S.," said Mike Dragosits, senior commodity strategist for TD Securities in Toronto.
"But that doesn't appear to be the case and that's why we're trading at the top end of these ranges."
Holdings in the world's largest gold-backed exchange-traded fund, SPDR Gold Shares, fell 0.61 percent on Thursday to a four-month low of 723.91 tonnes.
Physical buying slowed in Asia on higher prices. In China, premiums eased about 50 cents to $1 an ounce over the global benchmark on Friday, from premiums of $2-$3 earlier in the week.
Recent CFTC data shows shy changes, they are too small yet to make any far going conclusions, but the nature of these changes are different. Thus, previously we saw how open interest grew on dropping net long position. It was mean that shorts grew faster than longs, while right now we see that open interest continues slow upward tendency but net long position has increased. It seems that last week long positions have got greater surplus compares to short one. Still, this change is very small yet. Besides, SPDR fund does not show any tendency in the same direction. That’s why we should be very careful and to not hurry with conclusions. Any significant inflow usually easily noticeable and couldn’t be hidden, but current action is not of this kind probably, at least right now.
 Summary:
Technicals
Monthly
Let see what impact recent upward action has made on monthly chart. Previously we’ve mentioned that gold stands rather flat on monthly chart within second month in a row. But between April standing and May standing is big difference. In May investors are coming to action, at least, CFTC data shows the signs of it, while in April CFTC was absolutely anemic and market was driven by technical and news flows. So, this lets us hope that we will see some acceleration soon. And it looks like this acceleration has started.
Whether recent jump has harmed any of our long-term patterns? Not yet. As bearish dynamic pressure as VOB pattern are still valid.
On long-term horizon we still have last big pattern in progress that is Volatility breakout (VOB). It suggests at least 0.618 AB-CD down. And this target is 1050$. At the same time we need 1130 breakout to start clearly speak on 1050 target.
But what action market should show to break huge bearish patterns on monthly? Dynamic pressure is a tendency of lower highs within bullish trend. Hence, to break it, market should show higher high. I’ve marked it with arrow. It means that market should take out 1308 top to break this pattern and make investors doubt on bearish perspectives of gold market in long term. That’s why action that we have on daily and intraday charts right now is not an action of monthly one yet.
Overall picture still remains mostly bearish. In the beginning of the year market showed solid upside action. Gold was able to exceed yearly pivot, passed half way to Yearly Pivot resistance 1 but right now has reversed down and closed below YPP. From technical point of view this is bearish sign. This could be very significant moment and next logical destination will be yearly pivot support 1 around 1083$.
Still right now gold mostly is hostage of dollar value and US economical data (mostly inflation) in nearest perspective. Approximately the same was announced by Fed in forecast on inflation and had become a reason of dovish approach to rate hiking. Another concern right now is too strong dollar that becomes a problem per se for economy growth and kills inflation. Prices are fallen so no needs to hike rates.
Still, if we will take into consideration geopolitical situation and risks that have appeared recently, it could happen that situation will change, especially if situation in Ukraine will escalate and peaceful regulation will fail. Day by day we see worrying geopolitical news – Macedonia, Yemen to call some new. Unfortunately the geopolicy is sphere where we can’t do much.
Currently gold is turning to retracement, and it looks like tactical bounce by far. The major question on monthly chart – will this tactical bounce turn to strategical reversal? What if US data shows not just pause, temporal slow down but change the tendency? This will become clear after some time – what will happen with data, Fed rhetoric and investors’ positions.
That’s being said, as gold has passed through 1200 and until it stands below 1308 top, our long-term next destination point is previous lows at 1130, but since gold is returning to 1130 for second time – this is temporal destination and we should prepare for further downward action. Current upside action currently we should treat as retracement, but it could be really significant on lower time frames.
Weekly
Recent upward action has destroyed short-term bearish setup on gold market. During previous 3-4 weeks market has formed number of stop grabbers that suggested downward action to 1140 area. Right now trend on weekly chart has shift bullish, grabbers were vanished, but is it really shift long-term view on weekly chart?
The fact that market has passed through long-term natural support/resitsance level (marked with circles) makes possible further upward continuation to upper end. But on a road to 1308 area – let’s assume most optimistic scenario, it will meet with solid bariers. First of all, currently gold is forming AB-CD pattern and first destination point will be around 1230-1250 level. There gold will complete AB-CD and hit weekly overbought.
Second interesting observation – if even gold will form 1.618 AB-CD up, it will remain below 1308. This will be second barier, and currently it is very difficult to say whether gold will be able to pass trhough them.
At the same time here we get the clue. We know that retracement will be just till 1298 area, hence any action above it will not be retracement any more. Thus, around this level we will understand whether long-term picture has changed or not.
Meantime, as you can see even 1.618 AB=CD will not destroy butterfly shape and keep valid long-term bearish scenario. That’s why current action is nice and probably tradable on lower charts but here as well as on monthly it does not change situation yet.
Still we’ve got useful AB-CD tool that points on next two targets – 1250 and 1298.
Daily
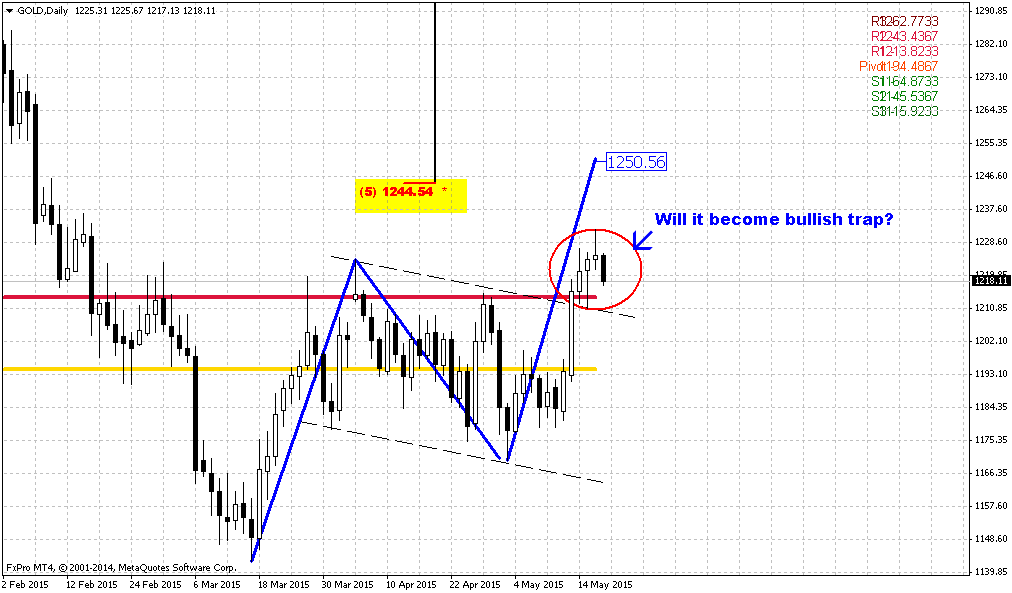
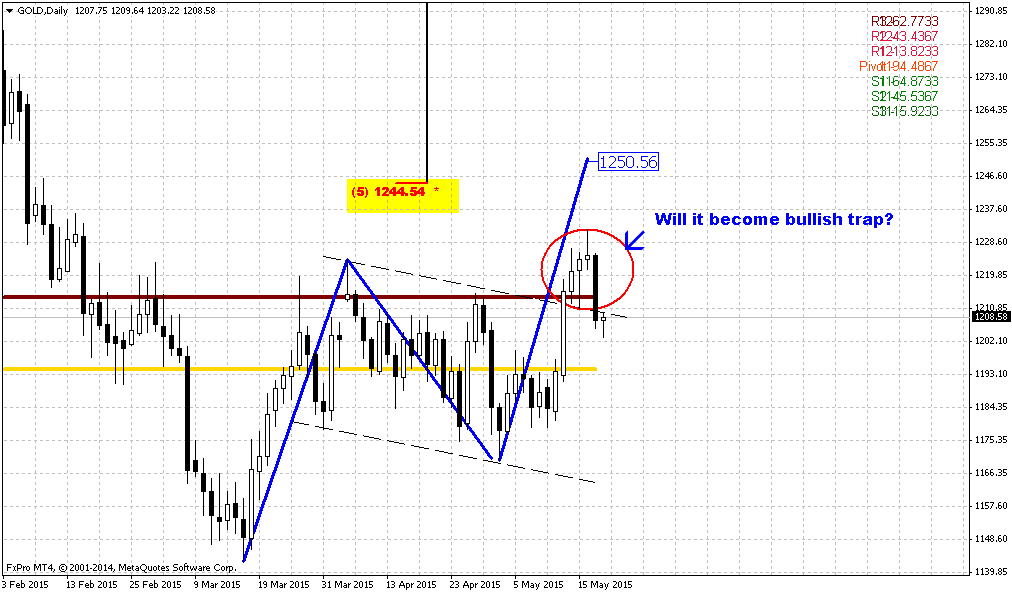
On daily chart trend also is bullish and at the first glance we have bullish context. Market shows clear AB-CD pattern, price stands above MPR1 and it seems that rectangle also was broken up. At the same time gold has reached daily overbought and this makes situation tricky. If gold will response on overbought and start retracement down – it will bring price back in rectangle and this will smell like failure breakout. That’s why we need to keep an eye on two moments. Initially, we probably should search chances for long entry with 1250 target. Monday overbought will be at 1233 so may be gold will continue upward action.
At the same time we need keep watching, whether market will return right back down inside the rectangle. Thus, if we will take long position and market will drop back inside of it – this will be worrying situation that could demand reversing of position. Gold position here is very fragile, and the situation of this kind when market shows breakout but meets overbought is one among most tricky.
Most safe and scenario would be if on Monday gold will reach, say, 1230 area and after that turn to retracement and re-test broken upper border of rectangle. But gold very rare gives simple setups.
If we suggest that breakout indeed has happened, then different targets point approximately at the same 1250-1260 area.
4-hour
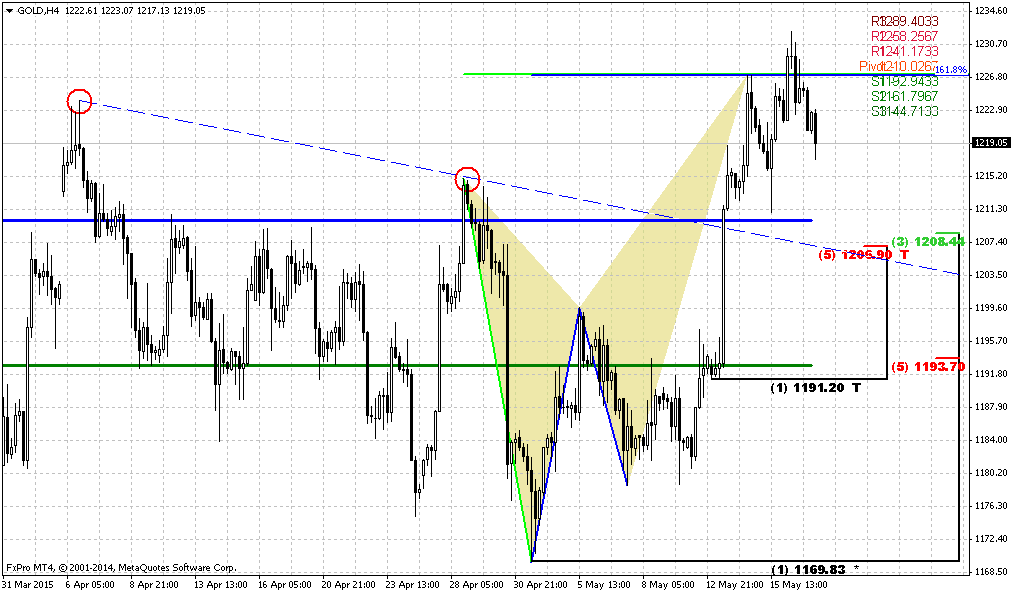
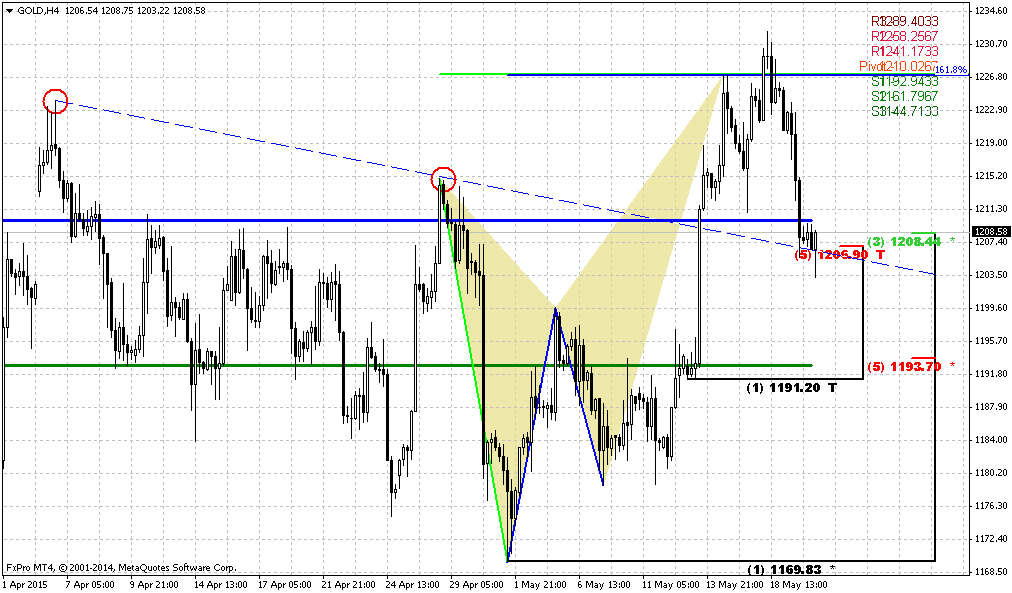
Here, guys, we have other reasons to worry about perspectives of upward action, at least in short-term. Market simultaneously has completed butterfly “sell” and inner 1.618 AB=CD pattern. We’ve mentioned this in Friday’s update. Normally gold should respect this and show some retracement down, at least to 1205 K-support area. The pattern that could trigger this downward action will be probably DRPO “Sell”. All that we need to get is just close below green line – 3x3 DMA. But 1205 stands as below MPR1 as inside broken rectangle and returning back into it will not be good sign for upside perspectives.
As we’ve said above situation could be resolved, if say, market will continue move right to 1.618 butterfly. It stands precisely around 1240 area and daily overbought. If DRPO will be formed and downward action indeed will start – be careful with taking long position even around 1205. Returning back inside broken consolidation is a bad partner for bulls.
Conclusion:
Long-term picture remains bearish and major patterns stand mostly intact. CFTC finally starts to show some action but we also have to agree that changes in numbers are minimal yet.
On short-term charts market has started upside retracement but we have no confidence yet with strength and perspectives of this action. Thus we should be very careful with details and short-term patterns that are forming right now on gold market.
The technical portion of Sive's analysis owes a great deal to Joe DiNapoli's methods, and uses a number of Joe's proprietary indicators. Please note that Sive's analysis is his own view of the market and is not endorsed by Joe DiNapoli or any related companies.
Weekly Gold Tading Report prepared by Sive Morten exclusively for ForexPeaceArmy.com
As Reuters reports Gold held near three-month highs on Friday, heading for its biggest weekly gain since mid-January, as soft U.S. consumer sentiment data weighed on the dollar and further diminished expectations for a near-term rise in U.S. interest rates.
The dollar eased against the euro in the wake of the report, allowing gold to extend a three-day rally that took prices to their highest since mid-February on Thursday at $1,227.04.
Recent economic reports have supported market expectations that the economy is not strong enough for the Fed to start raising record-low rates from June.
Data released on Friday showed U.S. consumer sentiment fell more than expected this month, though an earlier report showed manufacturing activity growth in New York State accelerated in May after weakening for three consecutive months.
"If the data remains soft in the United States, this rally has potential," Commerzbank analyst Eugen Weinberg said. "When data is more on the soft side, the market will be looking for indications on when the Fed will be raising interest rates."
Gold is sensitive to rate expectations, as higher rates increase the opportunity cost of holding non-yielding bullion, while boosting the dollar, in which it is priced.
"Our view is that the underlying data is getting weaker and it has been weak for a while but I think there are still some in the market that seem to be holding out hope that maybe we will get a rebound in the U.S.," said Mike Dragosits, senior commodity strategist for TD Securities in Toronto.
"But that doesn't appear to be the case and that's why we're trading at the top end of these ranges."
Holdings in the world's largest gold-backed exchange-traded fund, SPDR Gold Shares, fell 0.61 percent on Thursday to a four-month low of 723.91 tonnes.
Physical buying slowed in Asia on higher prices. In China, premiums eased about 50 cents to $1 an ounce over the global benchmark on Friday, from premiums of $2-$3 earlier in the week.
Recent CFTC data shows shy changes, they are too small yet to make any far going conclusions, but the nature of these changes are different. Thus, previously we saw how open interest grew on dropping net long position. It was mean that shorts grew faster than longs, while right now we see that open interest continues slow upward tendency but net long position has increased. It seems that last week long positions have got greater surplus compares to short one. Still, this change is very small yet. Besides, SPDR fund does not show any tendency in the same direction. That’s why we should be very careful and to not hurry with conclusions. Any significant inflow usually easily noticeable and couldn’t be hidden, but current action is not of this kind probably, at least right now.
Technicals
Monthly
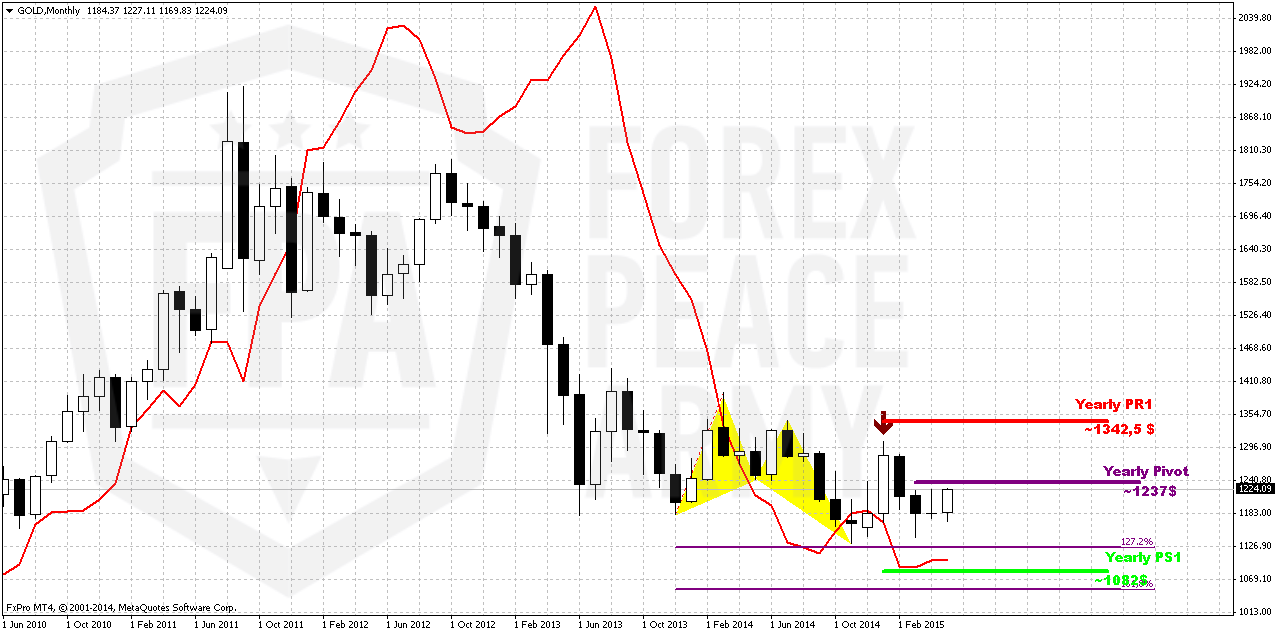
Let see what impact recent upward action has made on monthly chart. Previously we’ve mentioned that gold stands rather flat on monthly chart within second month in a row. But between April standing and May standing is big difference. In May investors are coming to action, at least, CFTC data shows the signs of it, while in April CFTC was absolutely anemic and market was driven by technical and news flows. So, this lets us hope that we will see some acceleration soon. And it looks like this acceleration has started.
Whether recent jump has harmed any of our long-term patterns? Not yet. As bearish dynamic pressure as VOB pattern are still valid.
On long-term horizon we still have last big pattern in progress that is Volatility breakout (VOB). It suggests at least 0.618 AB-CD down. And this target is 1050$. At the same time we need 1130 breakout to start clearly speak on 1050 target.
But what action market should show to break huge bearish patterns on monthly? Dynamic pressure is a tendency of lower highs within bullish trend. Hence, to break it, market should show higher high. I’ve marked it with arrow. It means that market should take out 1308 top to break this pattern and make investors doubt on bearish perspectives of gold market in long term. That’s why action that we have on daily and intraday charts right now is not an action of monthly one yet.
Overall picture still remains mostly bearish. In the beginning of the year market showed solid upside action. Gold was able to exceed yearly pivot, passed half way to Yearly Pivot resistance 1 but right now has reversed down and closed below YPP. From technical point of view this is bearish sign. This could be very significant moment and next logical destination will be yearly pivot support 1 around 1083$.
Still right now gold mostly is hostage of dollar value and US economical data (mostly inflation) in nearest perspective. Approximately the same was announced by Fed in forecast on inflation and had become a reason of dovish approach to rate hiking. Another concern right now is too strong dollar that becomes a problem per se for economy growth and kills inflation. Prices are fallen so no needs to hike rates.
Still, if we will take into consideration geopolitical situation and risks that have appeared recently, it could happen that situation will change, especially if situation in Ukraine will escalate and peaceful regulation will fail. Day by day we see worrying geopolitical news – Macedonia, Yemen to call some new. Unfortunately the geopolicy is sphere where we can’t do much.
Currently gold is turning to retracement, and it looks like tactical bounce by far. The major question on monthly chart – will this tactical bounce turn to strategical reversal? What if US data shows not just pause, temporal slow down but change the tendency? This will become clear after some time – what will happen with data, Fed rhetoric and investors’ positions.
That’s being said, as gold has passed through 1200 and until it stands below 1308 top, our long-term next destination point is previous lows at 1130, but since gold is returning to 1130 for second time – this is temporal destination and we should prepare for further downward action. Current upside action currently we should treat as retracement, but it could be really significant on lower time frames.
Weekly
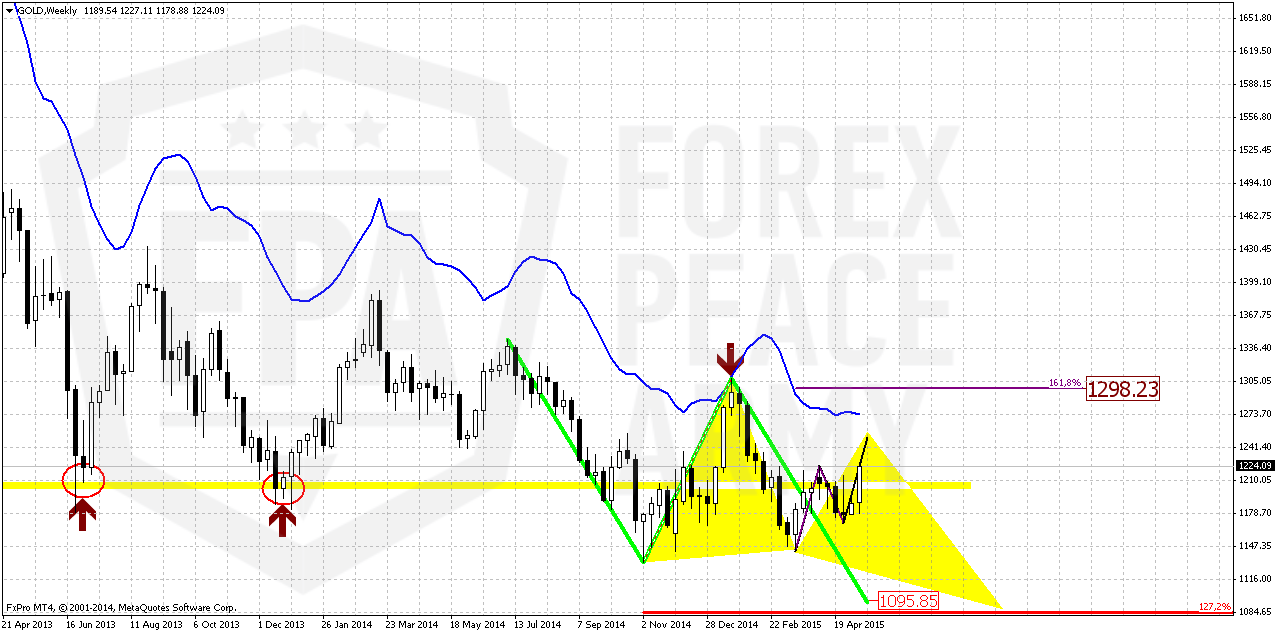
Recent upward action has destroyed short-term bearish setup on gold market. During previous 3-4 weeks market has formed number of stop grabbers that suggested downward action to 1140 area. Right now trend on weekly chart has shift bullish, grabbers were vanished, but is it really shift long-term view on weekly chart?
The fact that market has passed through long-term natural support/resitsance level (marked with circles) makes possible further upward continuation to upper end. But on a road to 1308 area – let’s assume most optimistic scenario, it will meet with solid bariers. First of all, currently gold is forming AB-CD pattern and first destination point will be around 1230-1250 level. There gold will complete AB-CD and hit weekly overbought.
Second interesting observation – if even gold will form 1.618 AB-CD up, it will remain below 1308. This will be second barier, and currently it is very difficult to say whether gold will be able to pass trhough them.
At the same time here we get the clue. We know that retracement will be just till 1298 area, hence any action above it will not be retracement any more. Thus, around this level we will understand whether long-term picture has changed or not.
Meantime, as you can see even 1.618 AB=CD will not destroy butterfly shape and keep valid long-term bearish scenario. That’s why current action is nice and probably tradable on lower charts but here as well as on monthly it does not change situation yet.
Still we’ve got useful AB-CD tool that points on next two targets – 1250 and 1298.
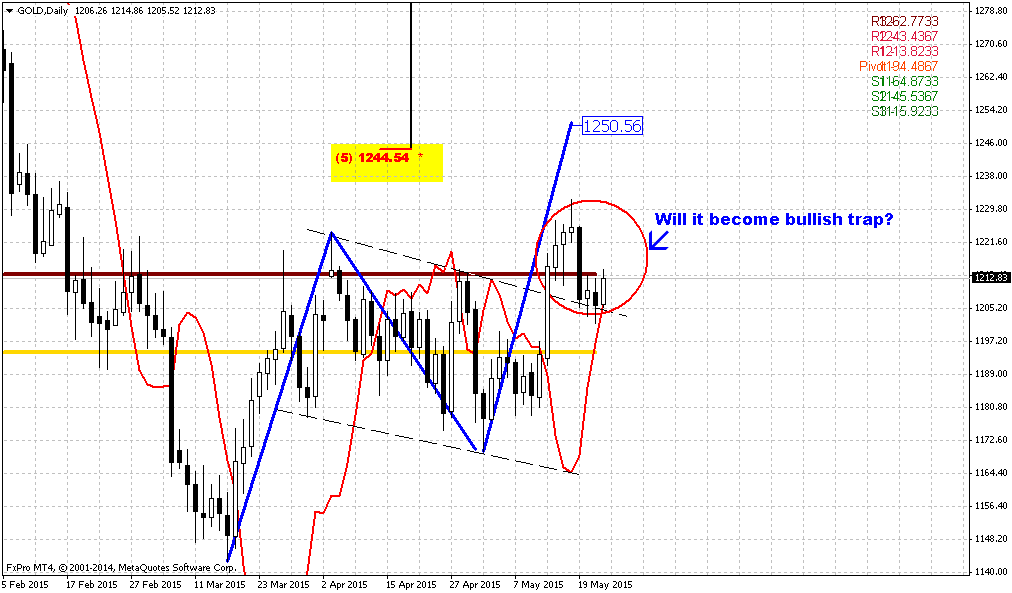
Daily
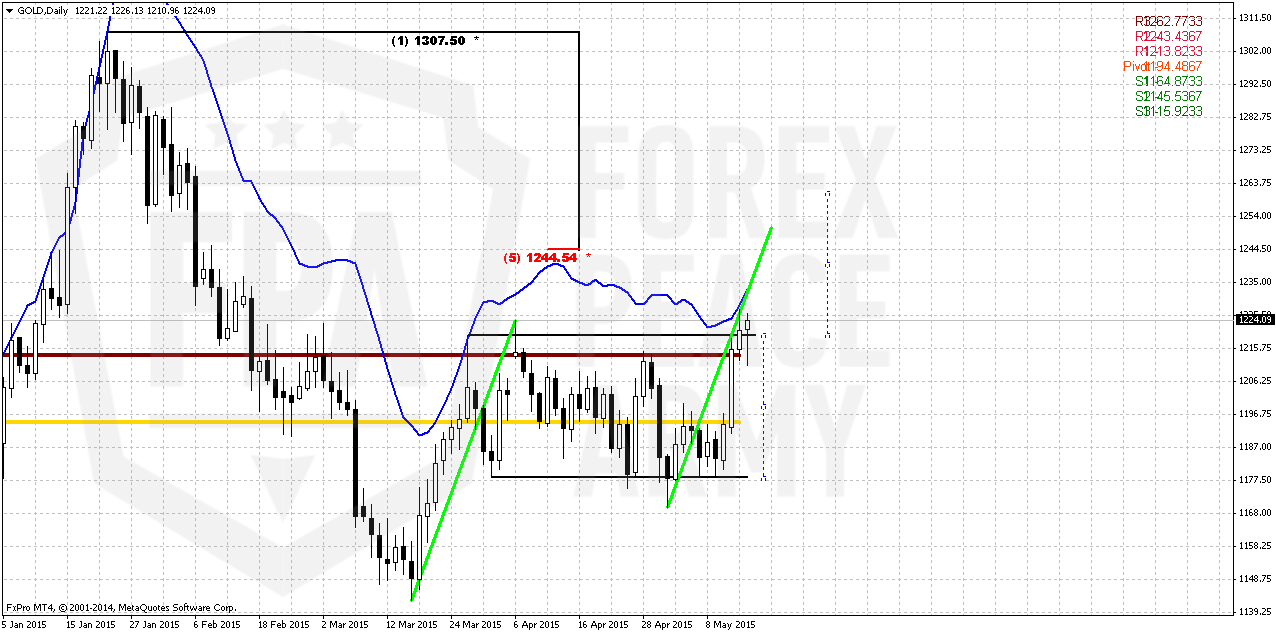
On daily chart trend also is bullish and at the first glance we have bullish context. Market shows clear AB-CD pattern, price stands above MPR1 and it seems that rectangle also was broken up. At the same time gold has reached daily overbought and this makes situation tricky. If gold will response on overbought and start retracement down – it will bring price back in rectangle and this will smell like failure breakout. That’s why we need to keep an eye on two moments. Initially, we probably should search chances for long entry with 1250 target. Monday overbought will be at 1233 so may be gold will continue upward action.
At the same time we need keep watching, whether market will return right back down inside the rectangle. Thus, if we will take long position and market will drop back inside of it – this will be worrying situation that could demand reversing of position. Gold position here is very fragile, and the situation of this kind when market shows breakout but meets overbought is one among most tricky.
Most safe and scenario would be if on Monday gold will reach, say, 1230 area and after that turn to retracement and re-test broken upper border of rectangle. But gold very rare gives simple setups.
If we suggest that breakout indeed has happened, then different targets point approximately at the same 1250-1260 area.
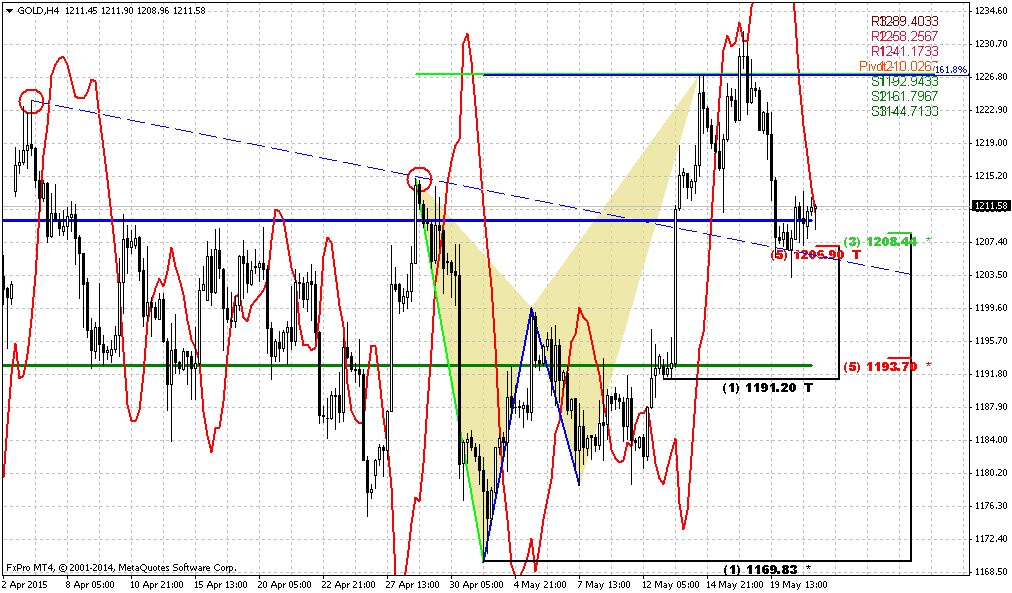
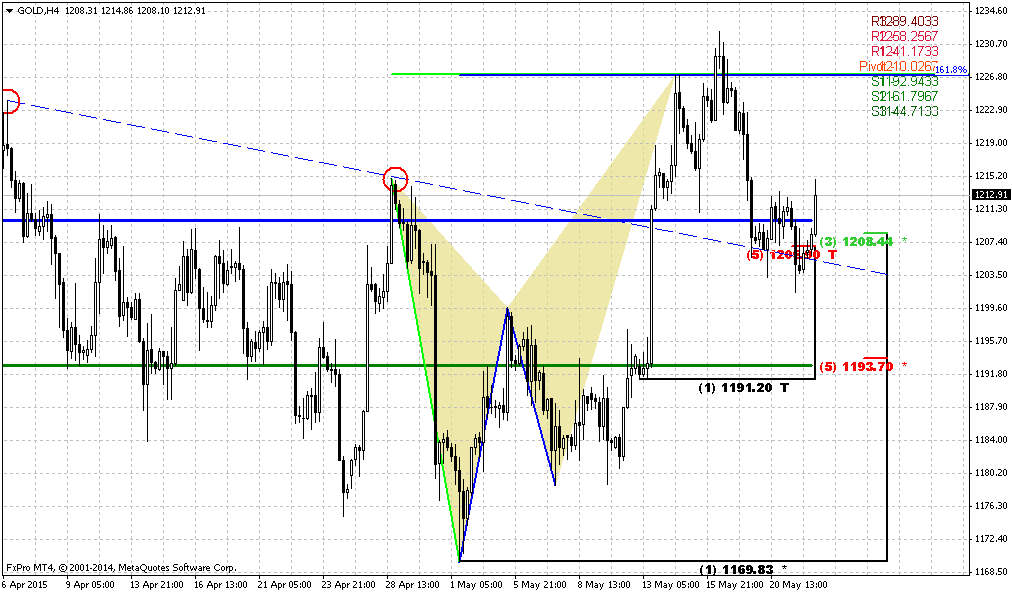
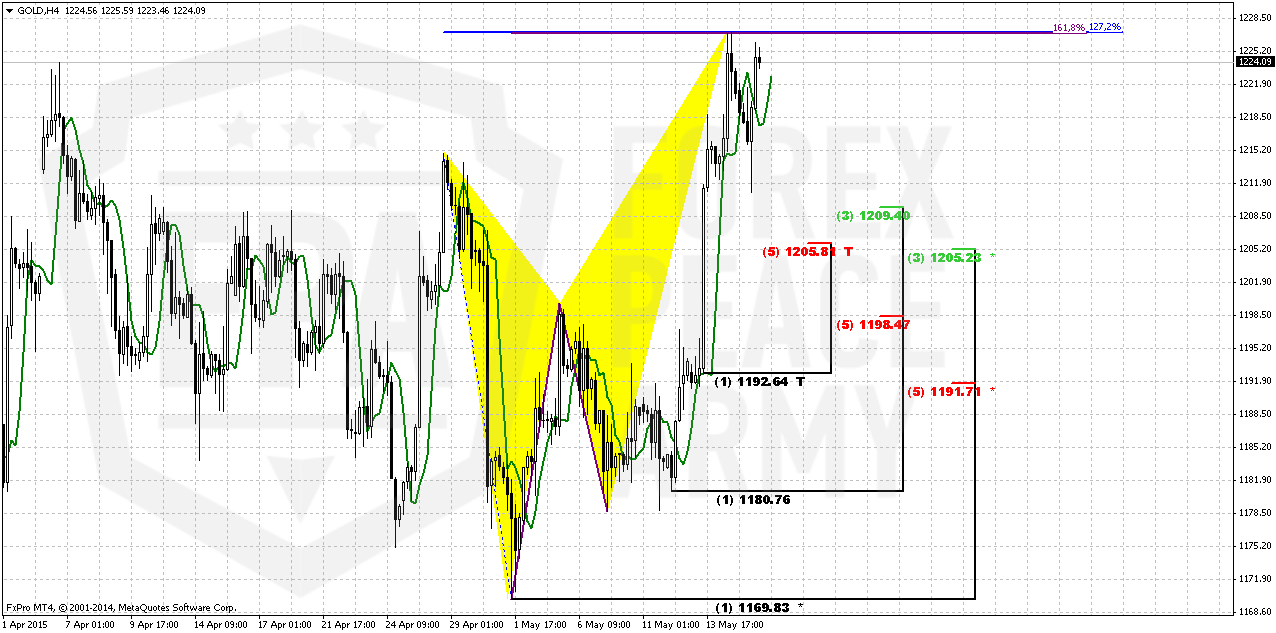
4-hour
Here, guys, we have other reasons to worry about perspectives of upward action, at least in short-term. Market simultaneously has completed butterfly “sell” and inner 1.618 AB=CD pattern. We’ve mentioned this in Friday’s update. Normally gold should respect this and show some retracement down, at least to 1205 K-support area. The pattern that could trigger this downward action will be probably DRPO “Sell”. All that we need to get is just close below green line – 3x3 DMA. But 1205 stands as below MPR1 as inside broken rectangle and returning back into it will not be good sign for upside perspectives.
As we’ve said above situation could be resolved, if say, market will continue move right to 1.618 butterfly. It stands precisely around 1240 area and daily overbought. If DRPO will be formed and downward action indeed will start – be careful with taking long position even around 1205. Returning back inside broken consolidation is a bad partner for bulls.
Conclusion:
Long-term picture remains bearish and major patterns stand mostly intact. CFTC finally starts to show some action but we also have to agree that changes in numbers are minimal yet.
On short-term charts market has started upside retracement but we have no confidence yet with strength and perspectives of this action. Thus we should be very careful with details and short-term patterns that are forming right now on gold market.
The technical portion of Sive's analysis owes a great deal to Joe DiNapoli's methods, and uses a number of Joe's proprietary indicators. Please note that Sive's analysis is his own view of the market and is not endorsed by Joe DiNapoli or any related companies.