Sive Morten
Special Consultant to the FPA
- Messages
- 18,695
Fundamentals
Weekly Gold Tading Report prepared by Sive Morten exclusively for ForexPeaceArmy.com
As Reuters reports Gold rose 2.6 percent on Friday, its biggest one-day gain in nearly five months, as a retreat in the U.S. dollar and heavy short-covering lifted bullion from a 4-1/2-year low.
The metal notched a third straight week of losses, however, having dropped to its lowest since April 2010 at $1,131.85 an ounce earlier on Friday.
The dollar slipped after a solid but below-expectation October U.S. jobs report as investors took profits on the greenback's months-long rally, which has seen it reach multi-year highs in anticipation of tighter U.S. monetary policy next year.
Market watchers said bullion could still extend its slide after tumbling below key technical support at $1,180 an ounce, the low reached during gold's 28 percent plunge last year.
"After we've had such a big sell-off, some speculators are covering their shorts after the worse-than-expected non farm number. I think that's all it is at this point," said Thomas Capalbo, precious metals trader at brokerage Newedge.
U.S. COMEX gold futures for December delivery settled up $27.20 an ounce at $1,169.80, with volume nearly double its 30-day average, preliminary Reuters data shows.
Asian trading was choppy. After subdued early trading, U.S. gold futures slid 1 percent to $1,130.40 an ounce, their lowest since March 2010, on high volume. In only five minutes, nearly 5,000 lots changed hands, but an hour and a half later, prices popped up about $10, again on high volume.
Gold had been under pressure for a week from a rising dollar, which has benefited from expectations the Federal Reserve will move before other central banks to tighten monetary policy.
Despite coming in below expectations, the U.S. payrolls report showed the unemployment rate fell to a fresh six-year low, suggesting the economy remains on a strengthening path.
In other market news, SPDR Gold Trust, the world's largest gold-backed exchange-traded fund, said its holdings fell 0.41 percent to 732.83 tonnes on Thursday, a six-year low.
First, guys we thought that SDPR shows a bit slower downside dynamic compares to market itself. Actually such divergences are very important before real long-term reversals. Take a look at our chart of SPDR holding and gold price. See, in 2011 before turning down market has shown significant divergence as gold climbed higher while SPDR holding remained flat. We expect to see something of that sort again. When gold will continue move down and SPDR holdings will stop to falling – this probably will be very important moment. But right now, by taking a look at recent changes it seems that they move harmonic by far:
Besides, recent CFTC report shows solid jump in open interest with simultaneous decreasing of net long position. This combination supports downward action:
 Source: CFTC, Reuters
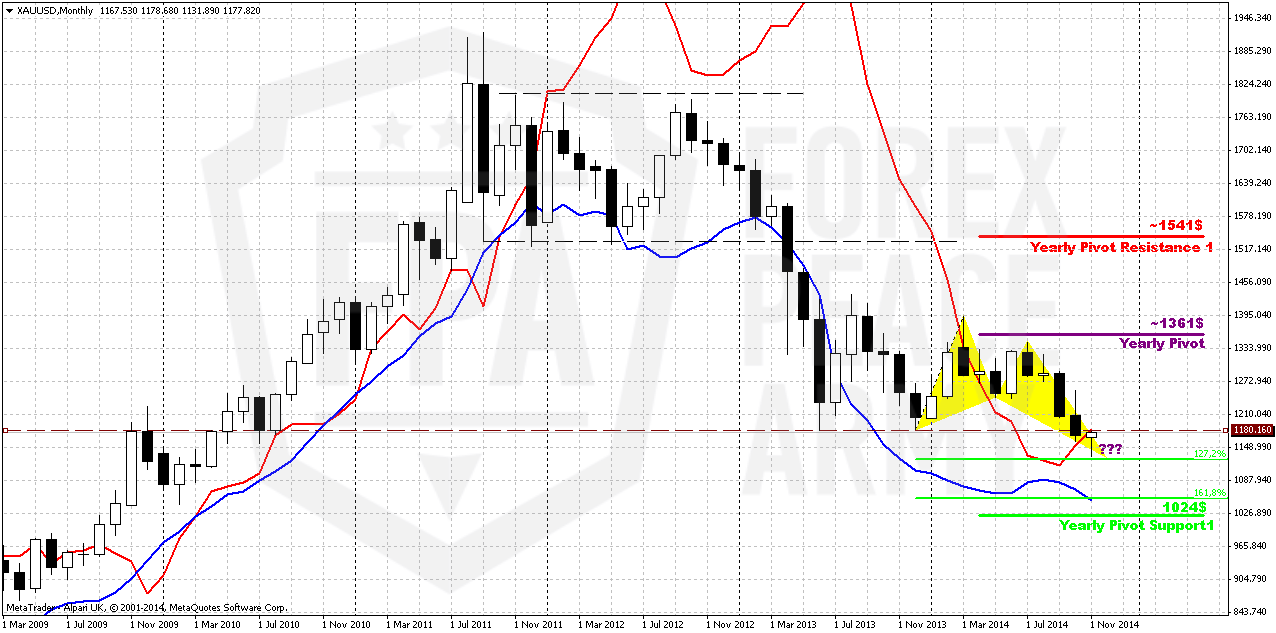
Monthly
So, right now we definitely see that this was not W&R of 1180 lows. Two of our patterns have been completed, I mean bearish grabber @ 1400 and recent dynamic pressure that have led market to 1180 lows and clear them out. Still we have another one pattern in progress that is Volatility breakout (VOB). It suggests at least 0.618 AB-CD down. And this target is 1050$.
Right now we have completed 1.27 Butterfly pattern. And here we could get interesting surprise. Particularly speaking it is important right now how market will react on this pattern. Reaction will be bearish if market will show just 3/8 retracement and re-test broken 1180. This will be clear signal that market will proceed lower, to 1.618 point that coincides with VOB 0.618 AB-CD target.
But if market will move above 1180 this could be bullish sign. Let’s not call it as reversal by far, but anyway retracement that could be triggered will be very deep. And reason for that stands due potential monthly bullish grabber. Take a note that November MACDP=1183,04. That’s why moving above 1180 will be important from this point of view as well. This could be comfirmation of the grabber. In this case market at least will return right back to 1360 Yearly Pivot point. As you can see situation is really thrilling.
As market has turned to retracement up and until we will not know results of it (whether we will get grabber or not) currently it is not big sense to discuss on second question – how deep market could drop below 1180.
So here we just repeat what we’ve said previously on this subject. Currently we only can try to get hints here and there. Although some traders point on growing individual demand on gold and hope that this could trigger rally on gold. We would say that individual demand is just a part of global annual demand and this demand mostly planned and expected. If even as it was reported has grown for 20%, this is nothing compares to money of institutional investors with big part in futures market. It is not annual well known demand ~5-6K tonnes drives market, it is futures positions. Just imagine how big they are 75 K contracts in net long position. This is 75 K* 100 Oz per contract = 7,5 Mln Oz. ~ 2,3K tonnes. This is 50% of annual demand. But this is just net position. Open interest is 10 times greater. Thus, 20% increase in individual demand stands around 500-600 tonnes within a year and just dissolves in huge institutional volumes. Thus, to understand what will happen and how far gold could fall we need keep a close eye on CFTC and SPDR data because it will warn us about possible changing.
Another factor that could impact on gold market is possible gold buying from SNB. We’ve said about it on previous week:
Swiss gold referendum's support falls short of majority: poll | Reuters
Finally the major driving factor for Gold is inflation and particularly here US economy has problem. All stats are improving across the board but wages and wealth of middle class stagnates. Although this is typical for first stage of grow in economical cycle, but this does not support gold appreciation by far. Still, it seems that situation slightly starts to change here. Our ultimate target stands at 1050 and this is just 80 bucks above recent 1130 lows… ABN AMRO recently told about 800$ at the end of 2015, but we have solid doubts on this forecast. The point is that Fed “plans” to change rate somewhere in 2015. It means that inflation probably will become visible somehow. And in these conditions gold will react even earlier, as well as Treasury bond market.
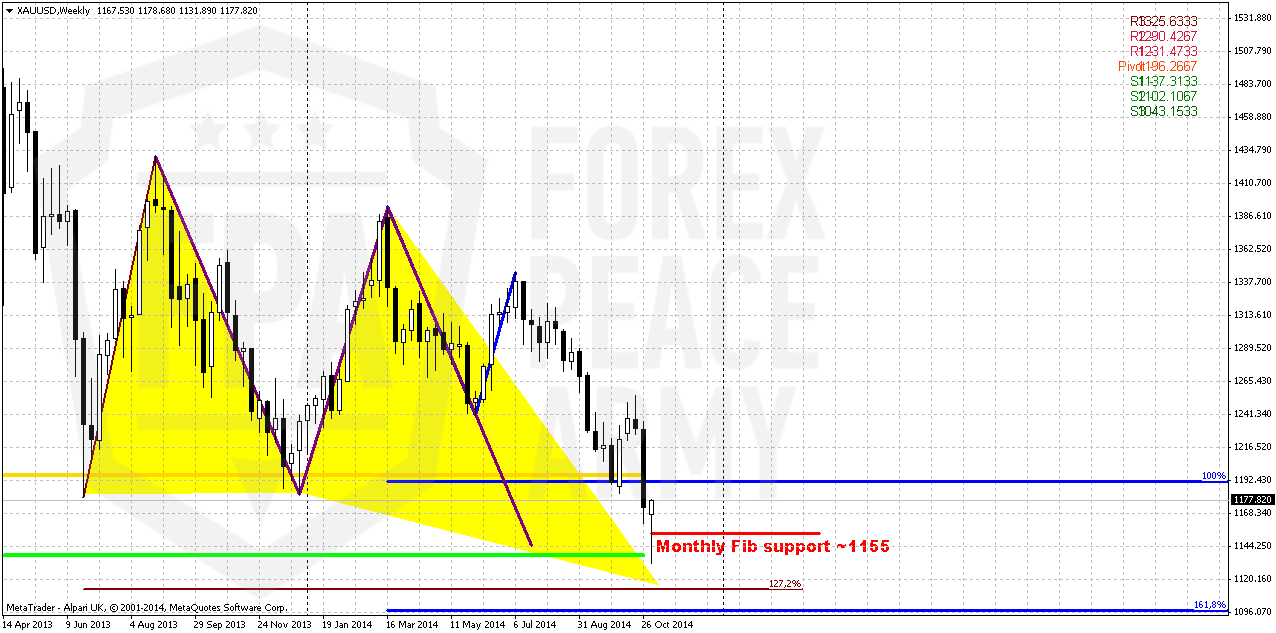
Weekly
As NFP data was mostly flat gold has turned to retracement, that probably should continue on next week. Thus, problem that we will discuss here will be important sometime later. As you can see market has reached significant support area that includes monthly Fib level, inner butterfly AB=CD target and MPS1. Although we’ve said above that gold has completed butterfly, but weekly chart shows that not quite. Besides, market has not reached 1.618 extension target of smaller AB=CD pattern. This makes us think that if even some really big rally will start here, if will start after completion of butterfly target. Right now upside action could happen, but it probably will be not very extended and we really could get another leg down before this game will be over.
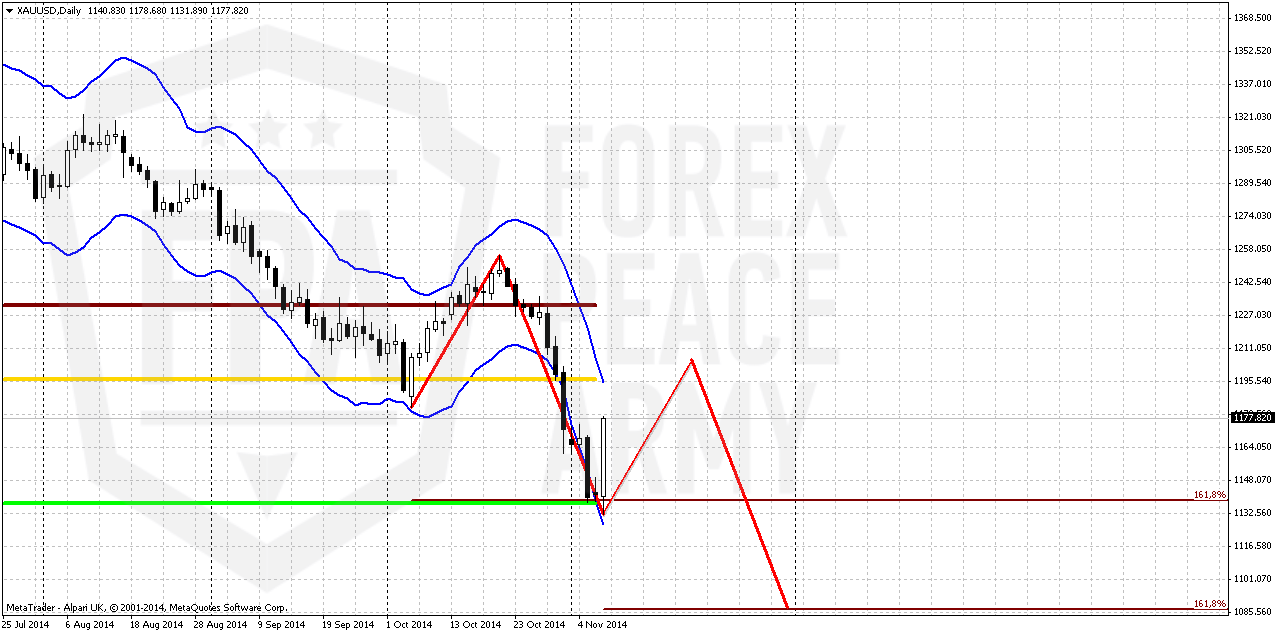
Daily
Daily picture shows culmination of all questions that we’ve talked about today. First we’ve said about 1180 level and that it will be important whether market will hold above it or not. Right now we see that it could happen, but probably not on coming week. 1180 coincides with daily overbought and MPP. Hardly market will move through it without any problems. It means that if even this will happen – action up will take AB-CD shape.
If we suggest that market will fail somewhere around 1180 and turn down, since it has some uncompleted targets lower – we could get 1.618 3-Drive “Buy” pattern among other possibilities. Applying here harmonic swing we can say that current retracement should be over somewhere around 1210$ area.
And now take a look at this another daily chart:
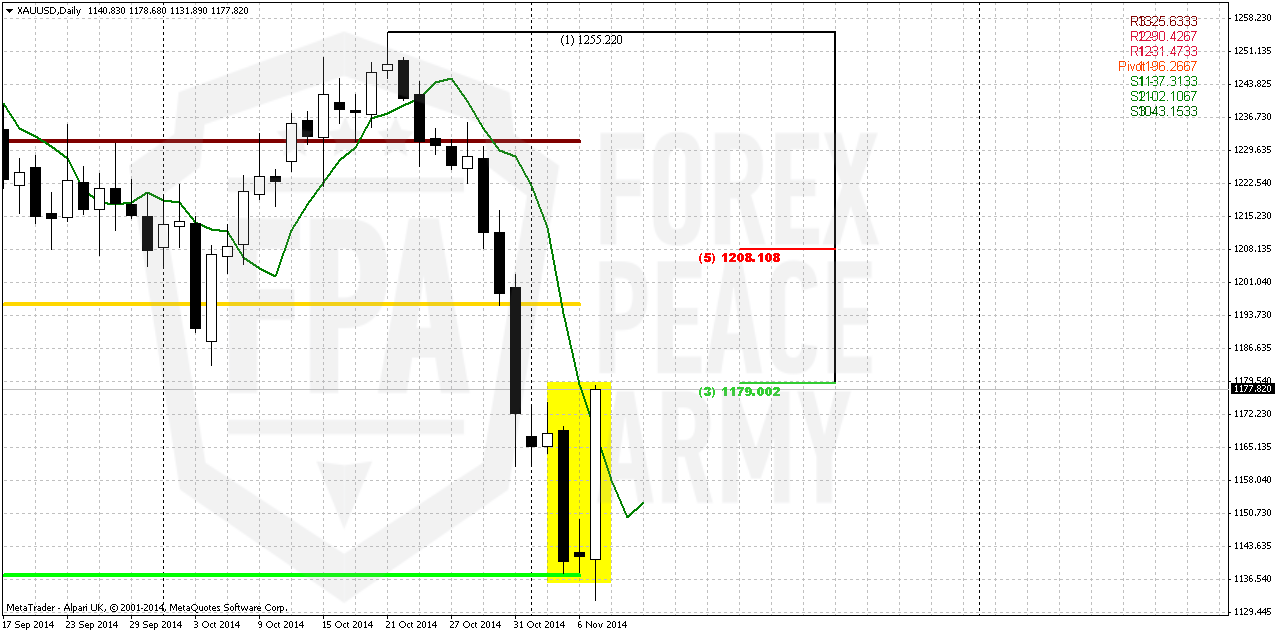
See – this upside action could become simultaneously B&B “Sell” right from 1208 Fib resistance. Chances that market will reach this level seems solid, because we have huge and perfect morning star candlestick pattern. It’s minimum target stands precisely around 1210 area.
As you can see gold provides a lot of oportunities for trading at any taste. Combining these moments let us to create trading plan for next week. It suggests watching for upside action to 1210 area, taking short position on potential B&B “Sell”. When market will reach B&B target – closing 50% of position and tighting stops on the rest half to breakeven and looking whether we will get 3-Drive Buy pattern. Depending on what we will get and what we will not – we will adjust our plan.
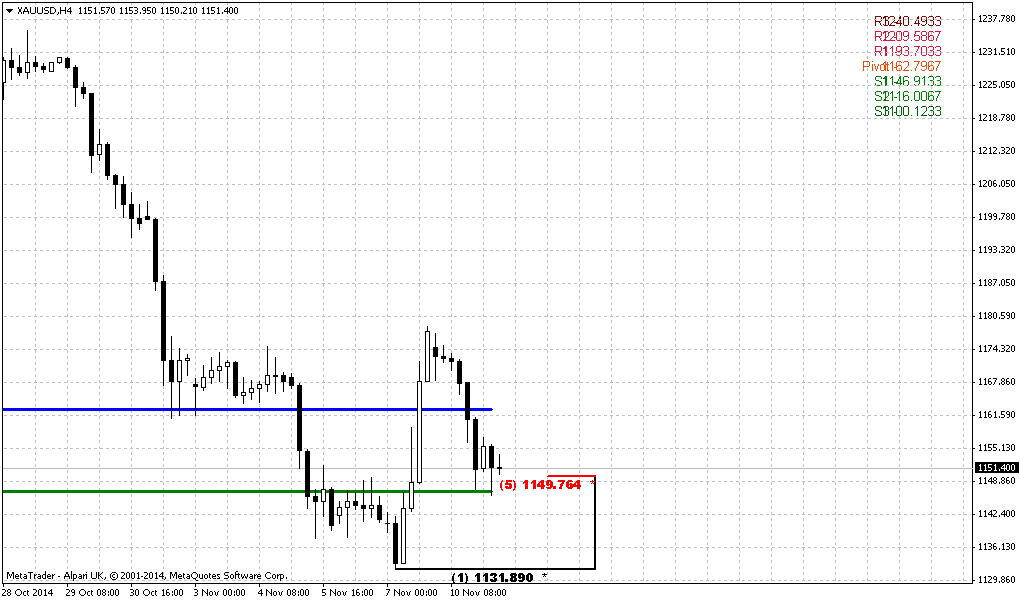
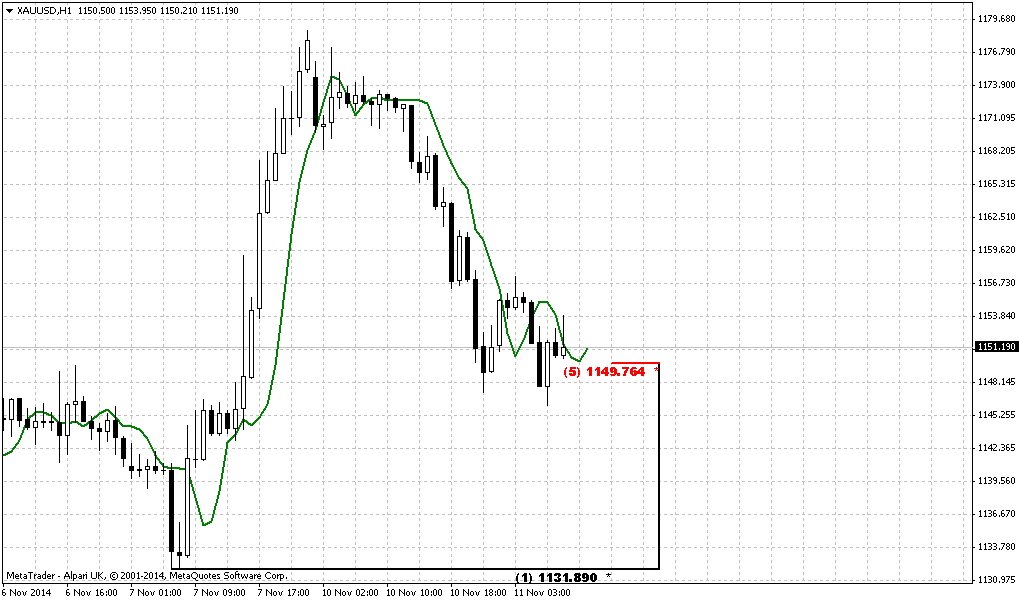
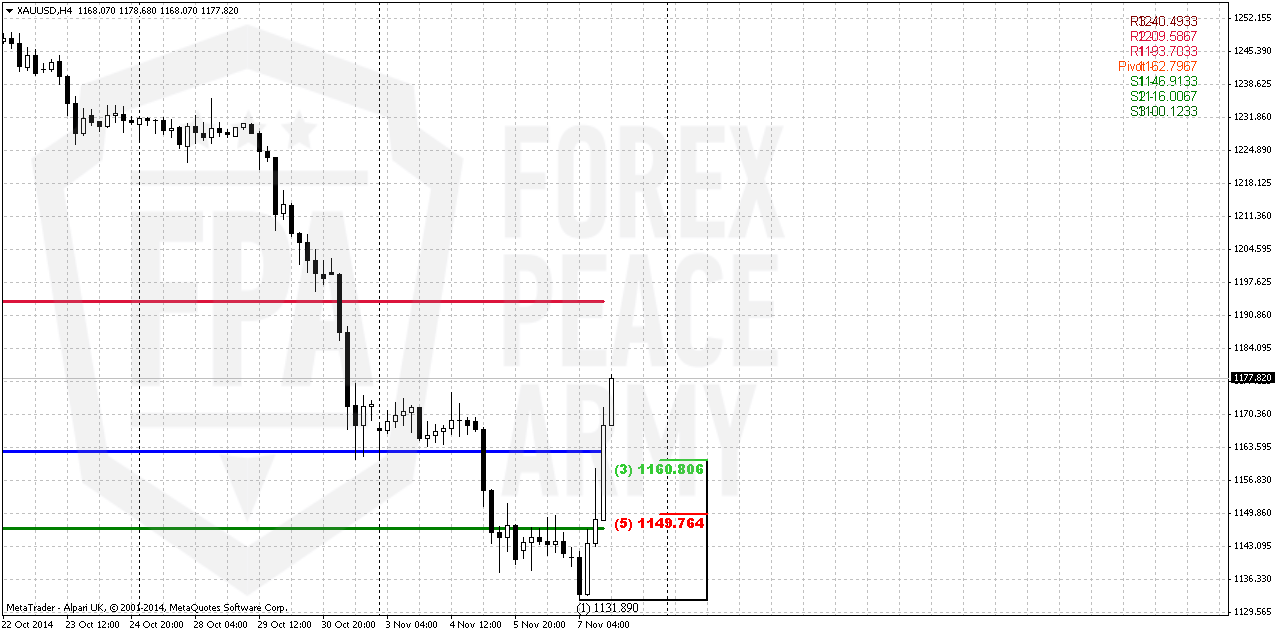
4-hour
This setup mostly will be interesting for scalp traders. As we have strong bullish candlestick pattern, odds are significant that shy upside continuation should happen. By taking a look at this pattern from perspective on intraday charts – we see that market has formed reversal swing up. As this is first reversal swing after long drop – retracement down probably will be deep and if you would like to take long position here – better to look for 1150 Fib support+WPS1. Your target of this action will be around 1193-1196 area – combination of WPR1 and MPR1. May be market will take shape of AB=CD up here.
Conclusion:
Gold market has accomplished our “must” target and washed out 1180$ lows. Now we have last strategical question – how deep market could drop. To answer on this question market needs time. The driving factor for gold is money of institutional investors. Despite what Asian traders tell about physical demand on holidays and festivals – this is not sufficient power to hold market. Now investors will re-assess situation on gold market and we need to understand what decision they will take. The only source of information that we have here is CFTC report and SPDR fund data. This is clue to solution. No changes in data – market will continue to creep lower. Technically, we will be watch for potential November bullish grabber. If market will confirm it – market could turn to deep upside retracement or even reversal.
In short-term market has reached solid support area and oversold on daily chart. As gold has formed clear bullish pattern there - upside retracement could continue on the week. Most probable target of short-term rally is 1210 area – broken lows, WPR1, MPP and daily Fib level. But as gold still has uncompleted targets on higher time frames, probably we should get another move down before any drastical changes will start.
The technical portion of Sive's analysis owes a great deal to Joe DiNapoli's methods, and uses a number of Joe's proprietary indicators. Please note that Sive's analysis is his own view of the market and is not endorsed by Joe DiNapoli or any related companies.
Weekly Gold Tading Report prepared by Sive Morten exclusively for ForexPeaceArmy.com
As Reuters reports Gold rose 2.6 percent on Friday, its biggest one-day gain in nearly five months, as a retreat in the U.S. dollar and heavy short-covering lifted bullion from a 4-1/2-year low.
The metal notched a third straight week of losses, however, having dropped to its lowest since April 2010 at $1,131.85 an ounce earlier on Friday.
The dollar slipped after a solid but below-expectation October U.S. jobs report as investors took profits on the greenback's months-long rally, which has seen it reach multi-year highs in anticipation of tighter U.S. monetary policy next year.
Market watchers said bullion could still extend its slide after tumbling below key technical support at $1,180 an ounce, the low reached during gold's 28 percent plunge last year.
"After we've had such a big sell-off, some speculators are covering their shorts after the worse-than-expected non farm number. I think that's all it is at this point," said Thomas Capalbo, precious metals trader at brokerage Newedge.
U.S. COMEX gold futures for December delivery settled up $27.20 an ounce at $1,169.80, with volume nearly double its 30-day average, preliminary Reuters data shows.
Asian trading was choppy. After subdued early trading, U.S. gold futures slid 1 percent to $1,130.40 an ounce, their lowest since March 2010, on high volume. In only five minutes, nearly 5,000 lots changed hands, but an hour and a half later, prices popped up about $10, again on high volume.
Gold had been under pressure for a week from a rising dollar, which has benefited from expectations the Federal Reserve will move before other central banks to tighten monetary policy.
Despite coming in below expectations, the U.S. payrolls report showed the unemployment rate fell to a fresh six-year low, suggesting the economy remains on a strengthening path.
In other market news, SPDR Gold Trust, the world's largest gold-backed exchange-traded fund, said its holdings fell 0.41 percent to 732.83 tonnes on Thursday, a six-year low.
First, guys we thought that SDPR shows a bit slower downside dynamic compares to market itself. Actually such divergences are very important before real long-term reversals. Take a look at our chart of SPDR holding and gold price. See, in 2011 before turning down market has shown significant divergence as gold climbed higher while SPDR holding remained flat. We expect to see something of that sort again. When gold will continue move down and SPDR holdings will stop to falling – this probably will be very important moment. But right now, by taking a look at recent changes it seems that they move harmonic by far:
Besides, recent CFTC report shows solid jump in open interest with simultaneous decreasing of net long position. This combination supports downward action:
Monthly
So, right now we definitely see that this was not W&R of 1180 lows. Two of our patterns have been completed, I mean bearish grabber @ 1400 and recent dynamic pressure that have led market to 1180 lows and clear them out. Still we have another one pattern in progress that is Volatility breakout (VOB). It suggests at least 0.618 AB-CD down. And this target is 1050$.
Right now we have completed 1.27 Butterfly pattern. And here we could get interesting surprise. Particularly speaking it is important right now how market will react on this pattern. Reaction will be bearish if market will show just 3/8 retracement and re-test broken 1180. This will be clear signal that market will proceed lower, to 1.618 point that coincides with VOB 0.618 AB-CD target.
But if market will move above 1180 this could be bullish sign. Let’s not call it as reversal by far, but anyway retracement that could be triggered will be very deep. And reason for that stands due potential monthly bullish grabber. Take a note that November MACDP=1183,04. That’s why moving above 1180 will be important from this point of view as well. This could be comfirmation of the grabber. In this case market at least will return right back to 1360 Yearly Pivot point. As you can see situation is really thrilling.
As market has turned to retracement up and until we will not know results of it (whether we will get grabber or not) currently it is not big sense to discuss on second question – how deep market could drop below 1180.
So here we just repeat what we’ve said previously on this subject. Currently we only can try to get hints here and there. Although some traders point on growing individual demand on gold and hope that this could trigger rally on gold. We would say that individual demand is just a part of global annual demand and this demand mostly planned and expected. If even as it was reported has grown for 20%, this is nothing compares to money of institutional investors with big part in futures market. It is not annual well known demand ~5-6K tonnes drives market, it is futures positions. Just imagine how big they are 75 K contracts in net long position. This is 75 K* 100 Oz per contract = 7,5 Mln Oz. ~ 2,3K tonnes. This is 50% of annual demand. But this is just net position. Open interest is 10 times greater. Thus, 20% increase in individual demand stands around 500-600 tonnes within a year and just dissolves in huge institutional volumes. Thus, to understand what will happen and how far gold could fall we need keep a close eye on CFTC and SPDR data because it will warn us about possible changing.
Another factor that could impact on gold market is possible gold buying from SNB. We’ve said about it on previous week:
Swiss gold referendum's support falls short of majority: poll | Reuters
Finally the major driving factor for Gold is inflation and particularly here US economy has problem. All stats are improving across the board but wages and wealth of middle class stagnates. Although this is typical for first stage of grow in economical cycle, but this does not support gold appreciation by far. Still, it seems that situation slightly starts to change here. Our ultimate target stands at 1050 and this is just 80 bucks above recent 1130 lows… ABN AMRO recently told about 800$ at the end of 2015, but we have solid doubts on this forecast. The point is that Fed “plans” to change rate somewhere in 2015. It means that inflation probably will become visible somehow. And in these conditions gold will react even earlier, as well as Treasury bond market.
Weekly
As NFP data was mostly flat gold has turned to retracement, that probably should continue on next week. Thus, problem that we will discuss here will be important sometime later. As you can see market has reached significant support area that includes monthly Fib level, inner butterfly AB=CD target and MPS1. Although we’ve said above that gold has completed butterfly, but weekly chart shows that not quite. Besides, market has not reached 1.618 extension target of smaller AB=CD pattern. This makes us think that if even some really big rally will start here, if will start after completion of butterfly target. Right now upside action could happen, but it probably will be not very extended and we really could get another leg down before this game will be over.
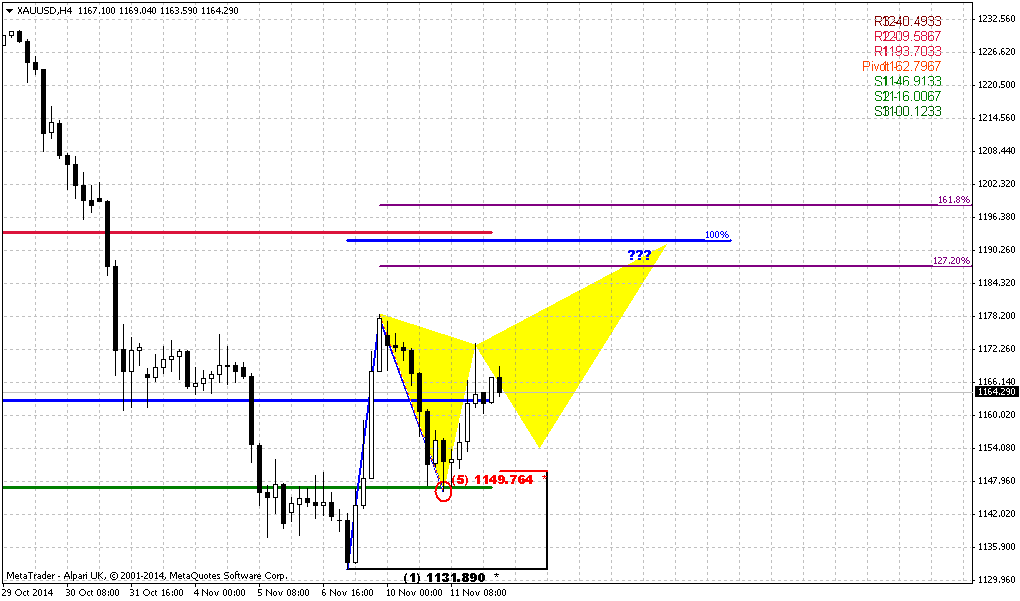
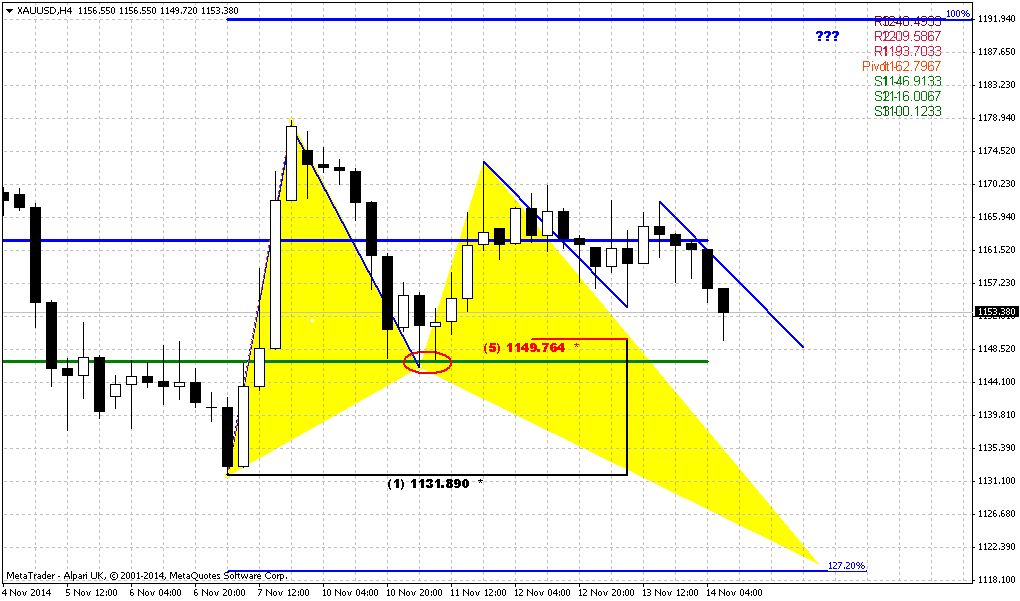
Daily
Daily picture shows culmination of all questions that we’ve talked about today. First we’ve said about 1180 level and that it will be important whether market will hold above it or not. Right now we see that it could happen, but probably not on coming week. 1180 coincides with daily overbought and MPP. Hardly market will move through it without any problems. It means that if even this will happen – action up will take AB-CD shape.
If we suggest that market will fail somewhere around 1180 and turn down, since it has some uncompleted targets lower – we could get 1.618 3-Drive “Buy” pattern among other possibilities. Applying here harmonic swing we can say that current retracement should be over somewhere around 1210$ area.
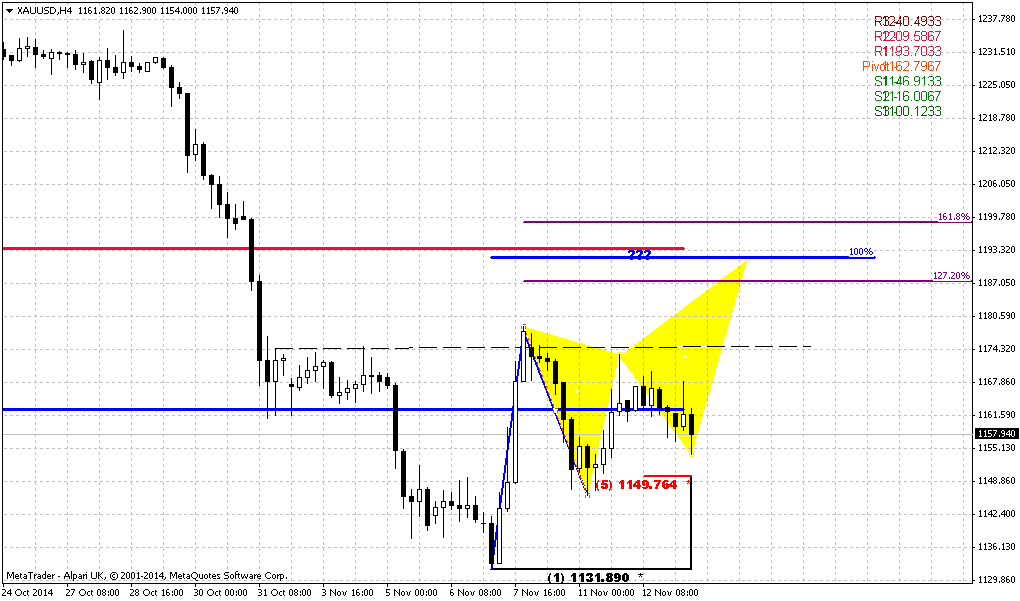
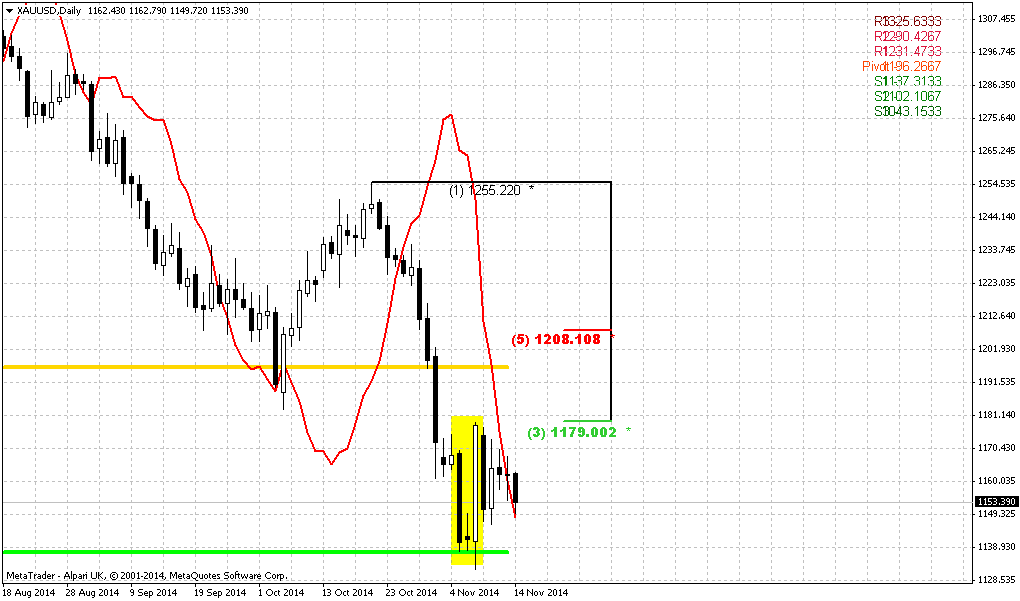
And now take a look at this another daily chart:
See – this upside action could become simultaneously B&B “Sell” right from 1208 Fib resistance. Chances that market will reach this level seems solid, because we have huge and perfect morning star candlestick pattern. It’s minimum target stands precisely around 1210 area.
As you can see gold provides a lot of oportunities for trading at any taste. Combining these moments let us to create trading plan for next week. It suggests watching for upside action to 1210 area, taking short position on potential B&B “Sell”. When market will reach B&B target – closing 50% of position and tighting stops on the rest half to breakeven and looking whether we will get 3-Drive Buy pattern. Depending on what we will get and what we will not – we will adjust our plan.
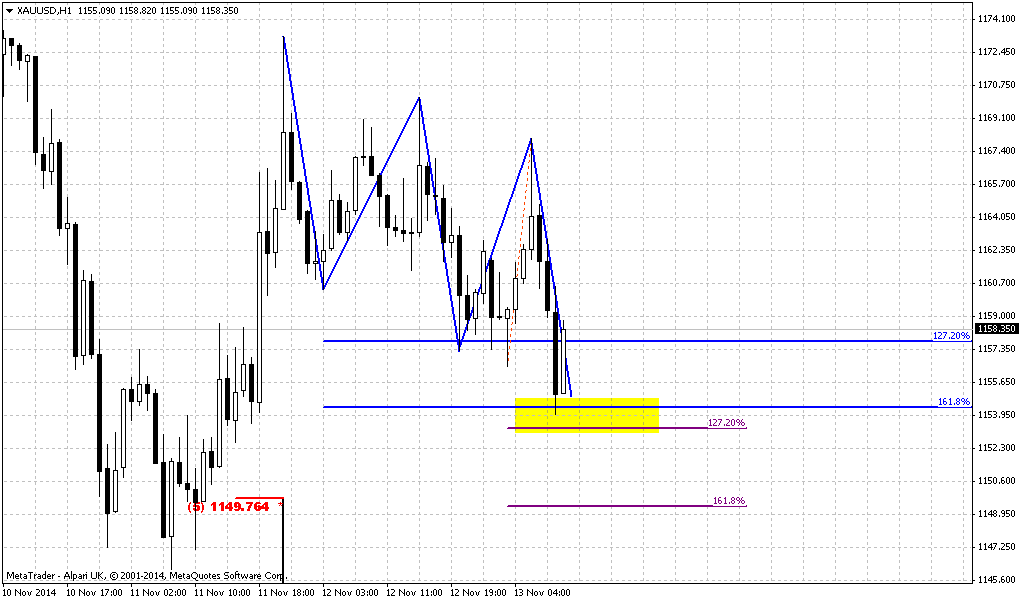
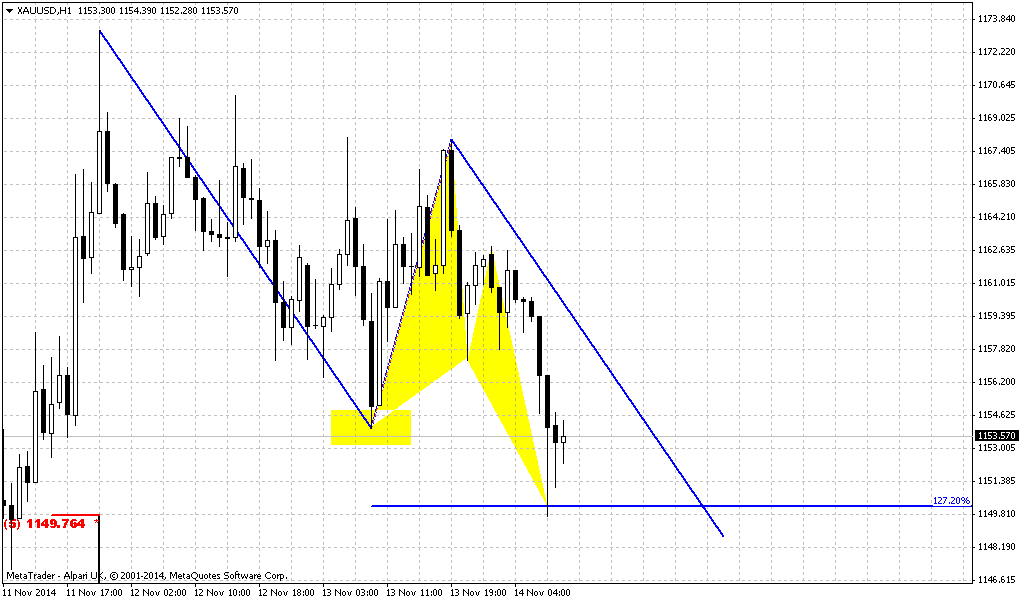
4-hour
This setup mostly will be interesting for scalp traders. As we have strong bullish candlestick pattern, odds are significant that shy upside continuation should happen. By taking a look at this pattern from perspective on intraday charts – we see that market has formed reversal swing up. As this is first reversal swing after long drop – retracement down probably will be deep and if you would like to take long position here – better to look for 1150 Fib support+WPS1. Your target of this action will be around 1193-1196 area – combination of WPR1 and MPR1. May be market will take shape of AB=CD up here.
Conclusion:
Gold market has accomplished our “must” target and washed out 1180$ lows. Now we have last strategical question – how deep market could drop. To answer on this question market needs time. The driving factor for gold is money of institutional investors. Despite what Asian traders tell about physical demand on holidays and festivals – this is not sufficient power to hold market. Now investors will re-assess situation on gold market and we need to understand what decision they will take. The only source of information that we have here is CFTC report and SPDR fund data. This is clue to solution. No changes in data – market will continue to creep lower. Technically, we will be watch for potential November bullish grabber. If market will confirm it – market could turn to deep upside retracement or even reversal.
In short-term market has reached solid support area and oversold on daily chart. As gold has formed clear bullish pattern there - upside retracement could continue on the week. Most probable target of short-term rally is 1210 area – broken lows, WPR1, MPP and daily Fib level. But as gold still has uncompleted targets on higher time frames, probably we should get another move down before any drastical changes will start.
The technical portion of Sive's analysis owes a great deal to Joe DiNapoli's methods, and uses a number of Joe's proprietary indicators. Please note that Sive's analysis is his own view of the market and is not endorsed by Joe DiNapoli or any related companies.