Sive Morten
Special Consultant to the FPA
- Messages
- 18,699
Fundamentals
Gold climbed above $1,200 an ounce on Friday to its highest in three weeks, helped by short-covering and after a surprise interest rate cut by China fueled hopes that demand would rise in the world's biggest consumer of the metal.
Also underpinning gold's inflation-hedge appeal were remarks by European Central Bank President Mario Draghi that opened the door for more drastic measures to prevent deflation. In addition, the ECB said it had started buying asset-backed securities, in a move to encourage banks to lend and revive the economy.
"China adding stimulus, the Draghi comments and ECB buying some debt all mean that traders are especially keen on covering shorts before week end and ahead of next week's OPEC meeting," said George Gero, vice president of RBC Capital Markets.
China cut its benchmark interest rates for the first time in more than two years to lower borrowing costs and lift a cooling economy. "Any measures that accelerate the spending power of the Chinese public are bound to be positive for gold," Mitsubishi analyst Jonathan Butler said.
Traders also digested news of central bank sales and purchases. Ukraine cut its gold reserves by more than a third in October, data from the International Monetary Fund showed, while Russia raised its gold holdings for a seventh straight month.
On previous week we’ve said that we need to check CFTC report to understand what recent rally was... And, guys, this really was big change in positions. Not just shorts were covered, but longs opened and this was accompanied by change in open interest. This is first change on of such value for long time. Now is a question wether it will get any continuation and support, for example from SPDR fund statistics.
Open interest:
 Shorts:
 Longs:
 It looks supportive factor for our long-term nearest target at1.22. Market gradually but stably continue to approach to it and right now it stands not too far from current levels.
Technicals
Monthly
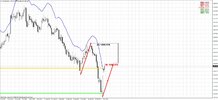
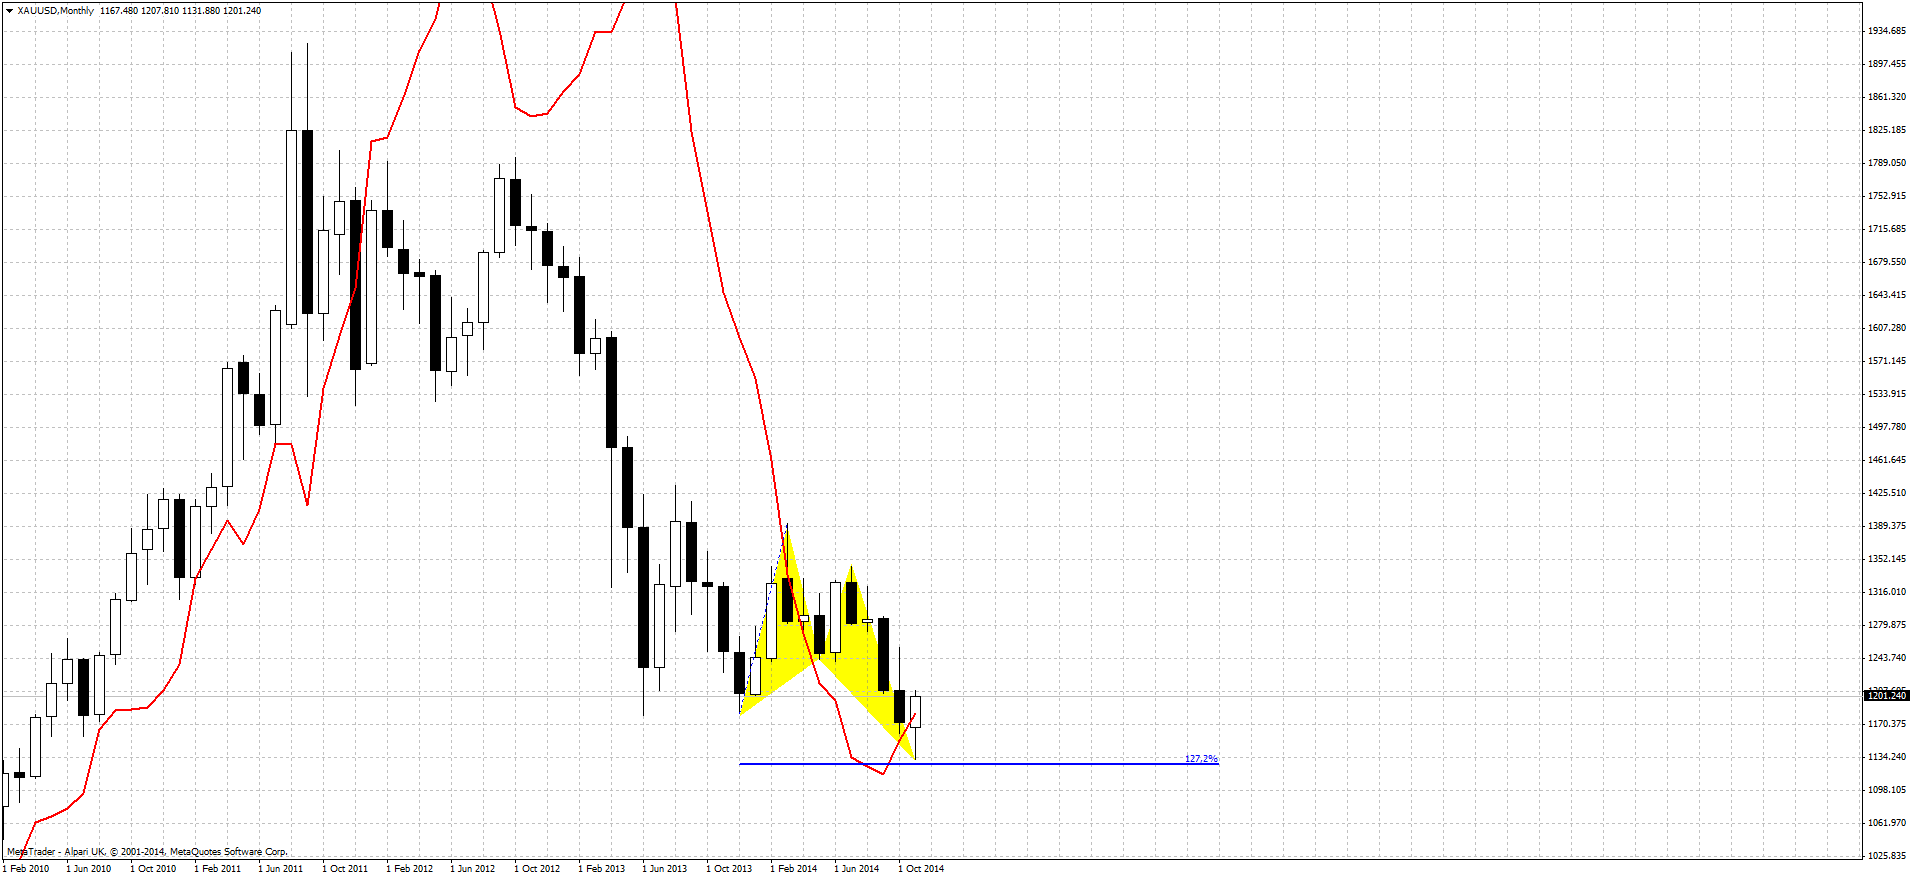
As we’ve said two of our patterns have been completed - bearish grabber @ 1400 and recent dynamic pressure that have led market to 1180 lows and clear them out. Still we have another one pattern in progress that is Volatility breakout (VOB). It suggests at least 0.618 AB-CD down. And this target is 1050$. But this is long-term perspective and in a light of recent CFTC data and possible bullish grabber it becomes not as flawless as it was couple of months ago.
On previous week we’ve mentioned potential bullish grabber on gold market and recent rally could have absoutely special meaning for us. As less and less time till the end of November, chances on confirmation of this pattern are increasing. Grabber could become a reaction on butterfly pattern that we have here. Also, as we’ve mentioned previously, the depth of the reaction is also important.
As market now stands above 1180 this could be bullish sign. Let’s not call it as reversal by far, but anyway retracement that could be triggered will be very deep. And reason for that stands due potential monthly bullish grabber. Take a note that November MACDP=1183,04. That’s why moving above 1180 will be important from this point of view as well. This could be comfirmation of the grabber. In this case market at least will return right back to 1360 Yearly Pivot point. As you can see situation is really thrilling and Friday’s rally on China’s rate cut just has added chances for success.
As market has turned to retracement up and until we will not know results of it (whether we will get grabber or not) currently it is not big sense to discuss on second question – how deep market could drop below 1180.
So here we just repeat what we’ve said previously on this subject. Thus, to understand what will happen and how far gold could fall we need keep a close eye on CFTC and SPDR data because it will warn us about possible changing.
Another factor that could impact on gold market is possible gold buying from SNB. We’ve said about it on previous week:
Swiss gold referendum's support falls short of majority: poll | Reuters
But last public opinion poll points on decreasing of supporters of this measure from 44 to 38%. Thus, currently the chances on SNB purchases are not very significant.
Finally the major driving factor for Gold is inflation and particularly here US economy has problem. All stats are improving across the board but wages and wealth of middle class stagnates. Although this is typical for first stage of grow in economical cycle, but this does not support gold appreciation by far. Still, it seems that situation slightly starts to change here. Our ultimate target stands at 1050 and this is just 80 bucks above recent 1130 lows… ABN AMRO recently told about 800$ at the end of 2015, but we have solid doubts on this forecast. The point is that Fed “plans” to change rate somewhere in 2015. It means that inflation probably will become visible somehow. And in these conditions gold will react even earlier, as well as Treasury bond market. Conclusion here is as follows. If we will get grabber we will start to think about 1360 until it will be valid. We could return back to thoughts on 1050, only if grabber will fail and market drop below 1130 again.
Weekly
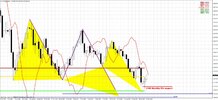
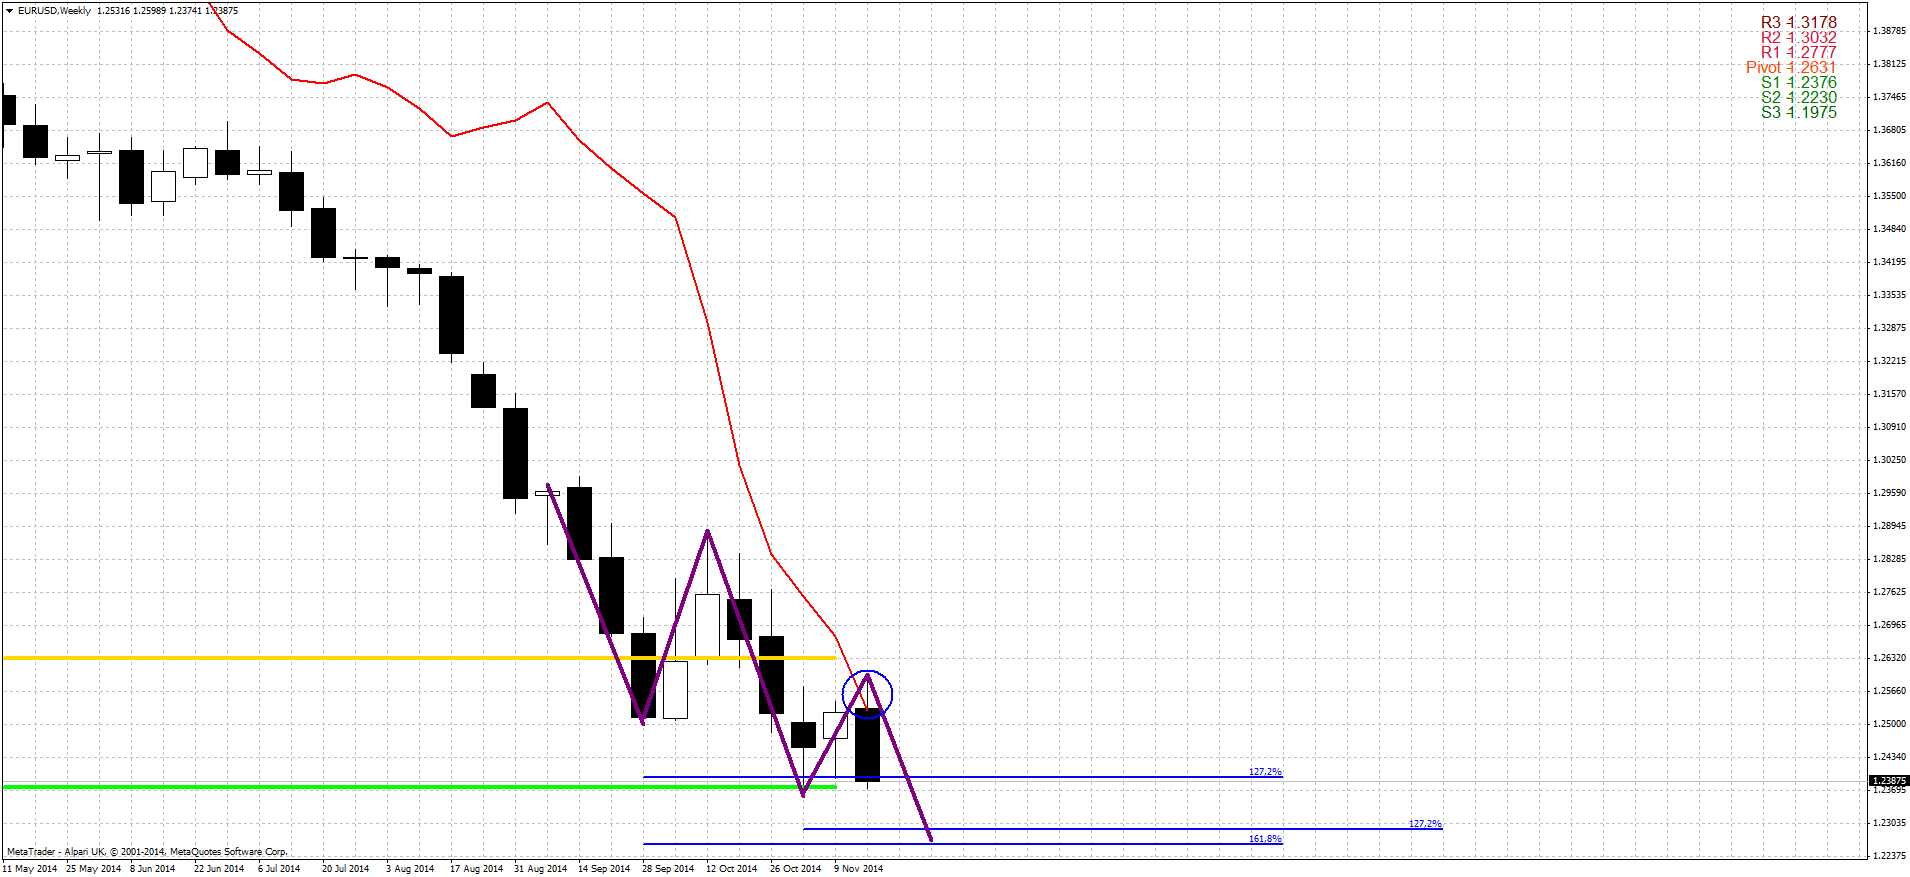
Last week as reason for possible bounce we’ve mentioned significant support area that includes monthly Fib level, inner butterfly AB=CD target and MPS1. Although we’ve said above that gold has completed butterfly, but weekly chart shows that not quite. Actually we have two side-by-side butterfies here and both of them were not been completed yet normally.
Besides, market has not reached 1.618 extension target of smaller AB=CD pattern. This makes us to be worry on perspectives of this rally. May be on intraday charts 40$ explosion looks outstanding – on weekly chart market just re-tested broken 1180’s lows and formed another hammer pattern. In short-term perspective rally could continue and it will be interesting what we will get around MPP and 1200-1210 area. Existence of untouched 1.27 butterfly target is a cloud on horizon of possible upside action. Now culmination has come on weekly chart. The point is, although on Friday market has shown growth, but still it stands inside of normal retracement range and gold has not exceed 1210 area when retracement could be treated a bit overextended. At the same time CFTC shows splash in bullish activity.
That’s why we will be watching over MACDP around MPP on coming week, because gold could form bearish grabber here. If it will fail – then definitely something is changing in long-term sentiment, while if market will confirm it and it will start to work then nothing will be lost yet for bears...
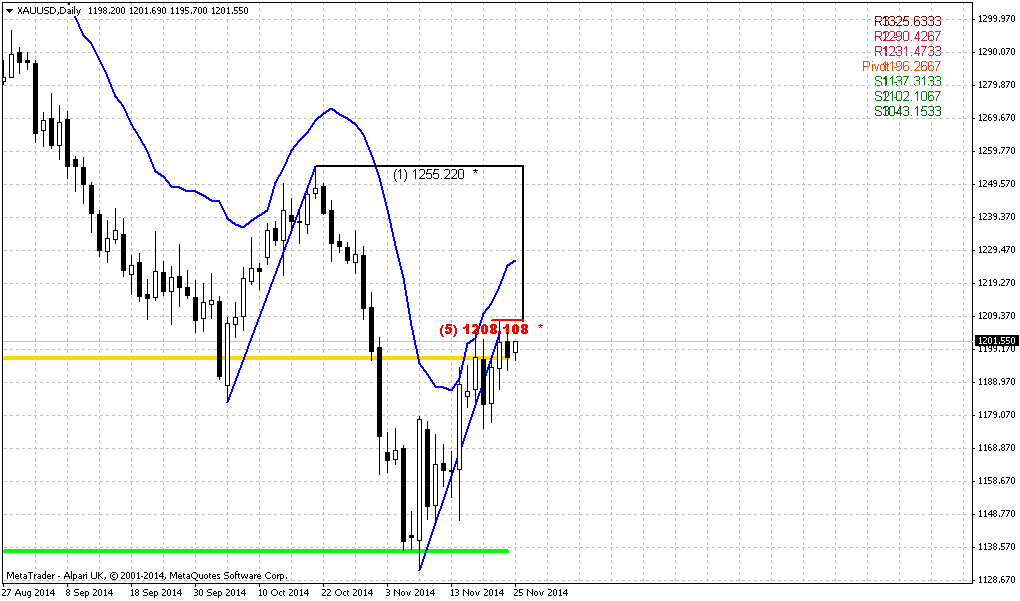
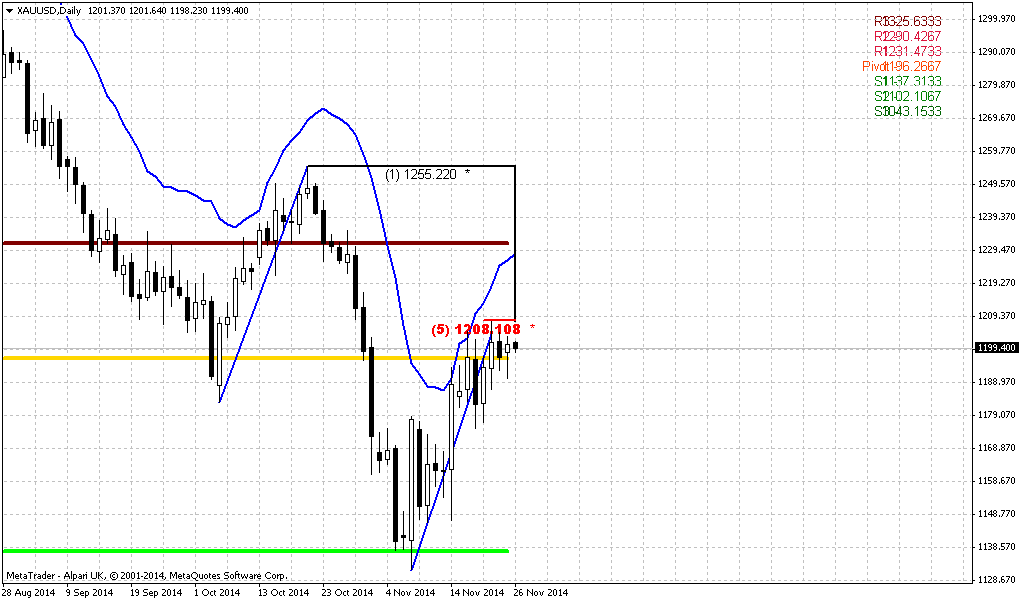
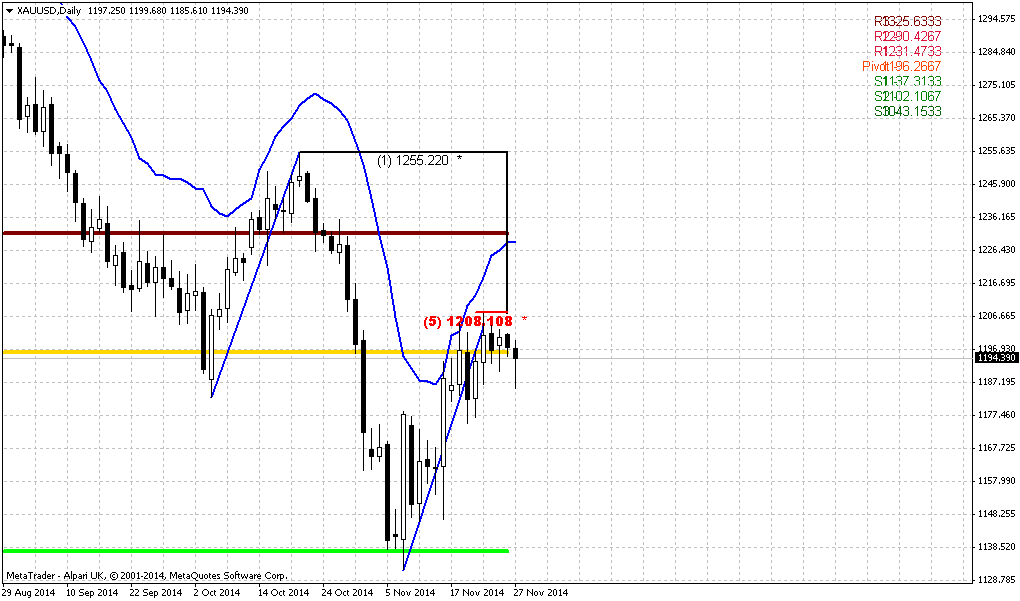
Daily
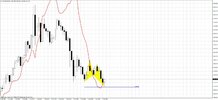
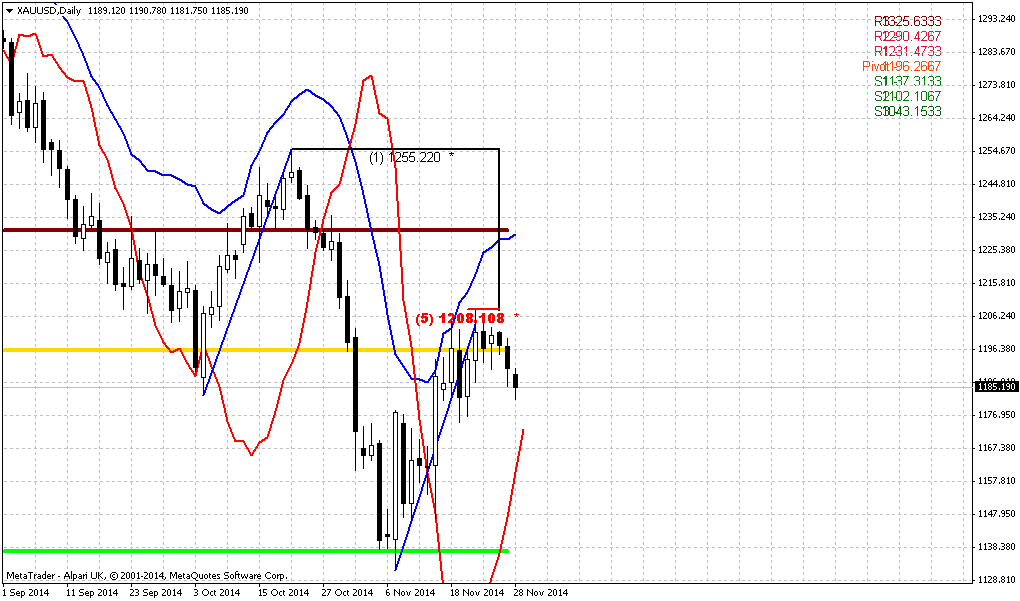
Alpari UK shows a bit curious chart with missing of 2-3 candles... Anyway this is not a big problem for our analysis right now. Despite on recent rally up market has not broken through major resistance. Now it stands and completion point of harmonic swing, daily overbought and Fib resistance. Thus, we have DiNapoli bearish “Stretch pattern”. It means that this is not good time for taking long position right now if you would like to do it. Stretch probably will not cancel possibility of bullish action, but it just warns you “don’t take long right now, wait for retracement”.
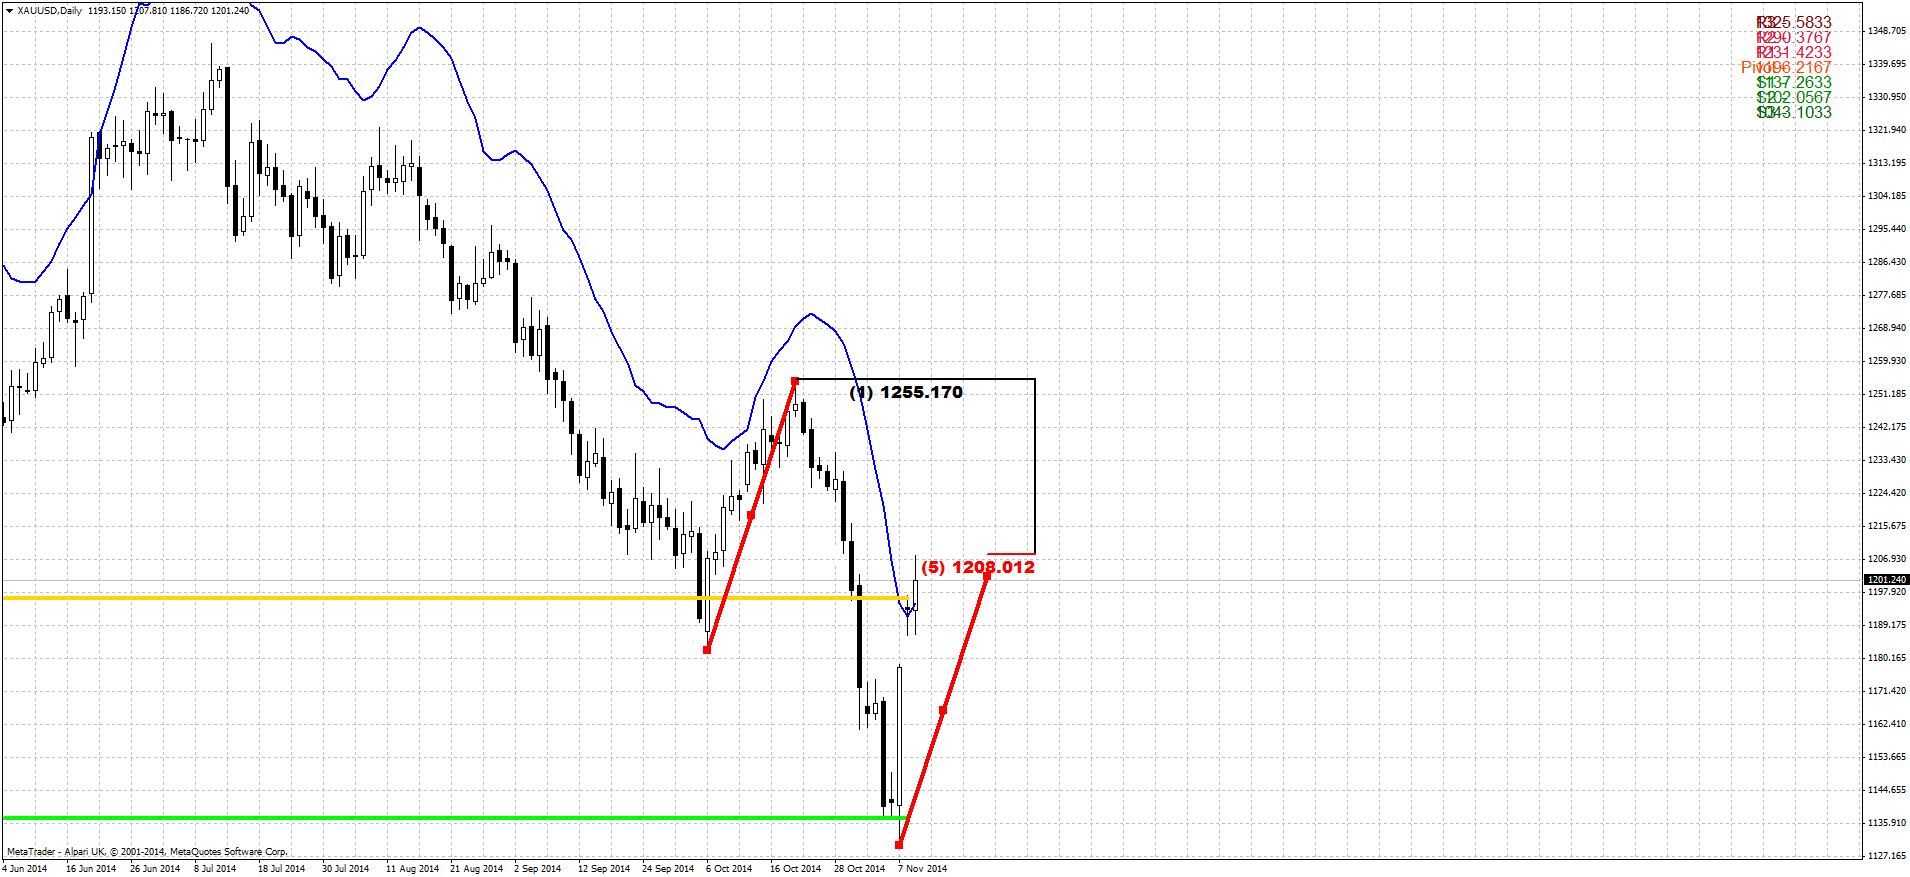
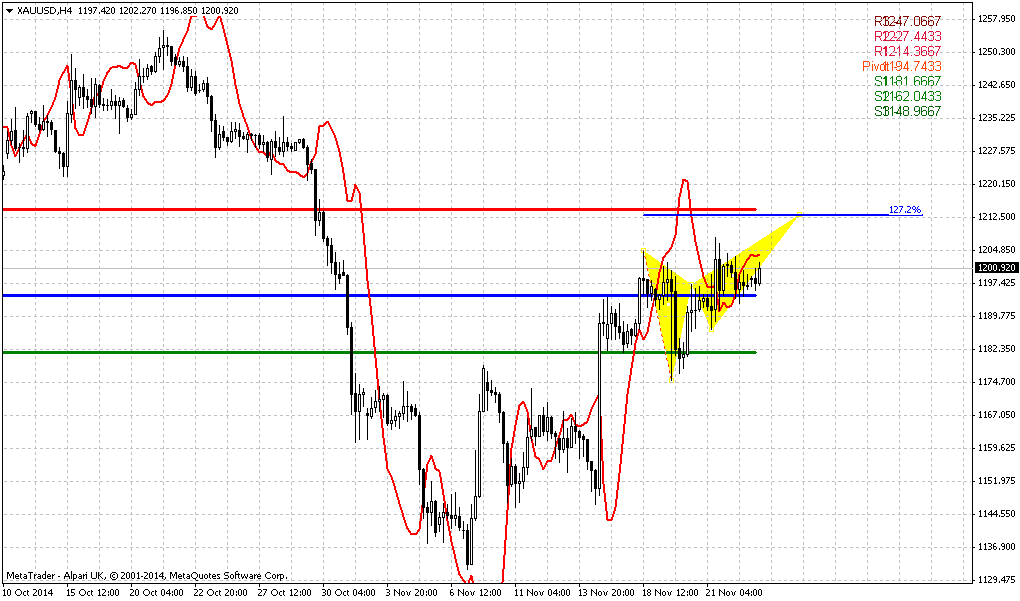
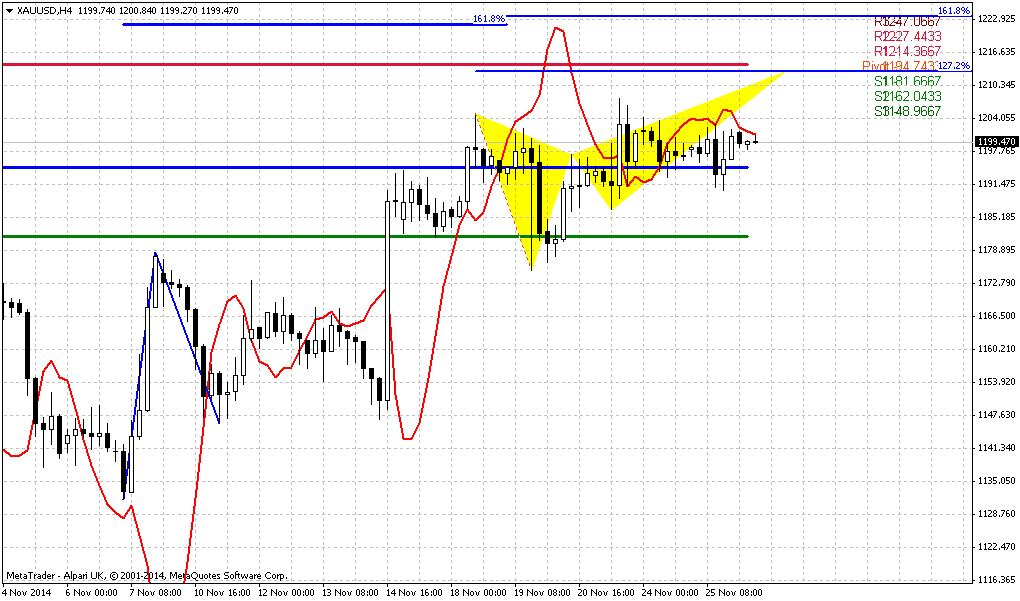
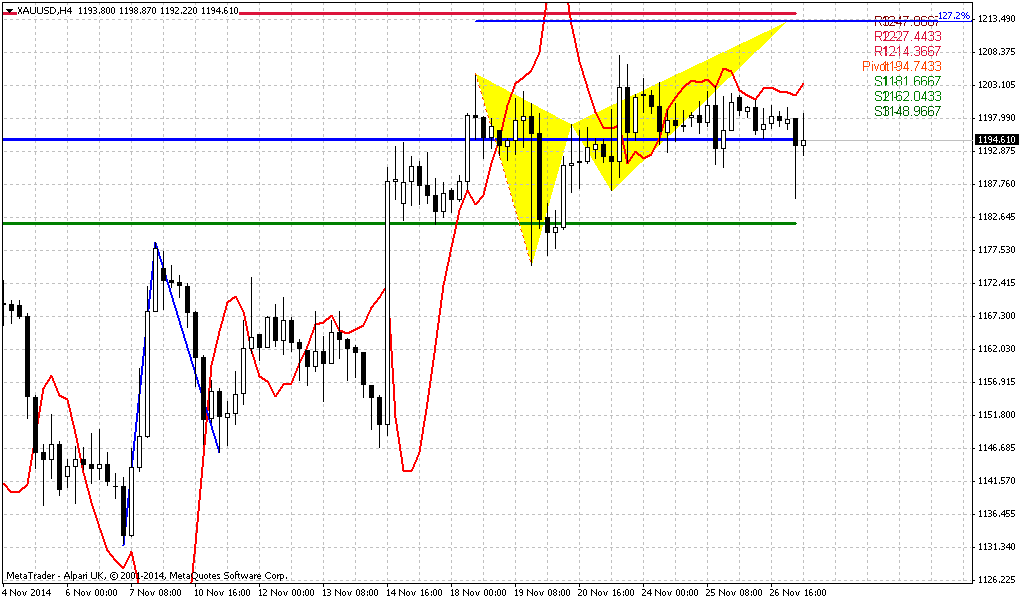
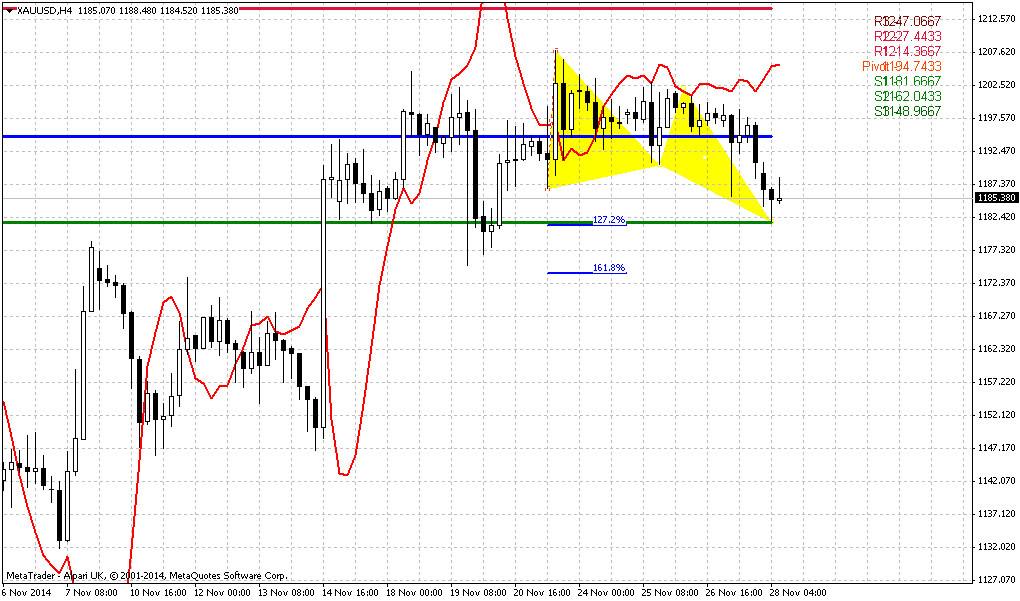
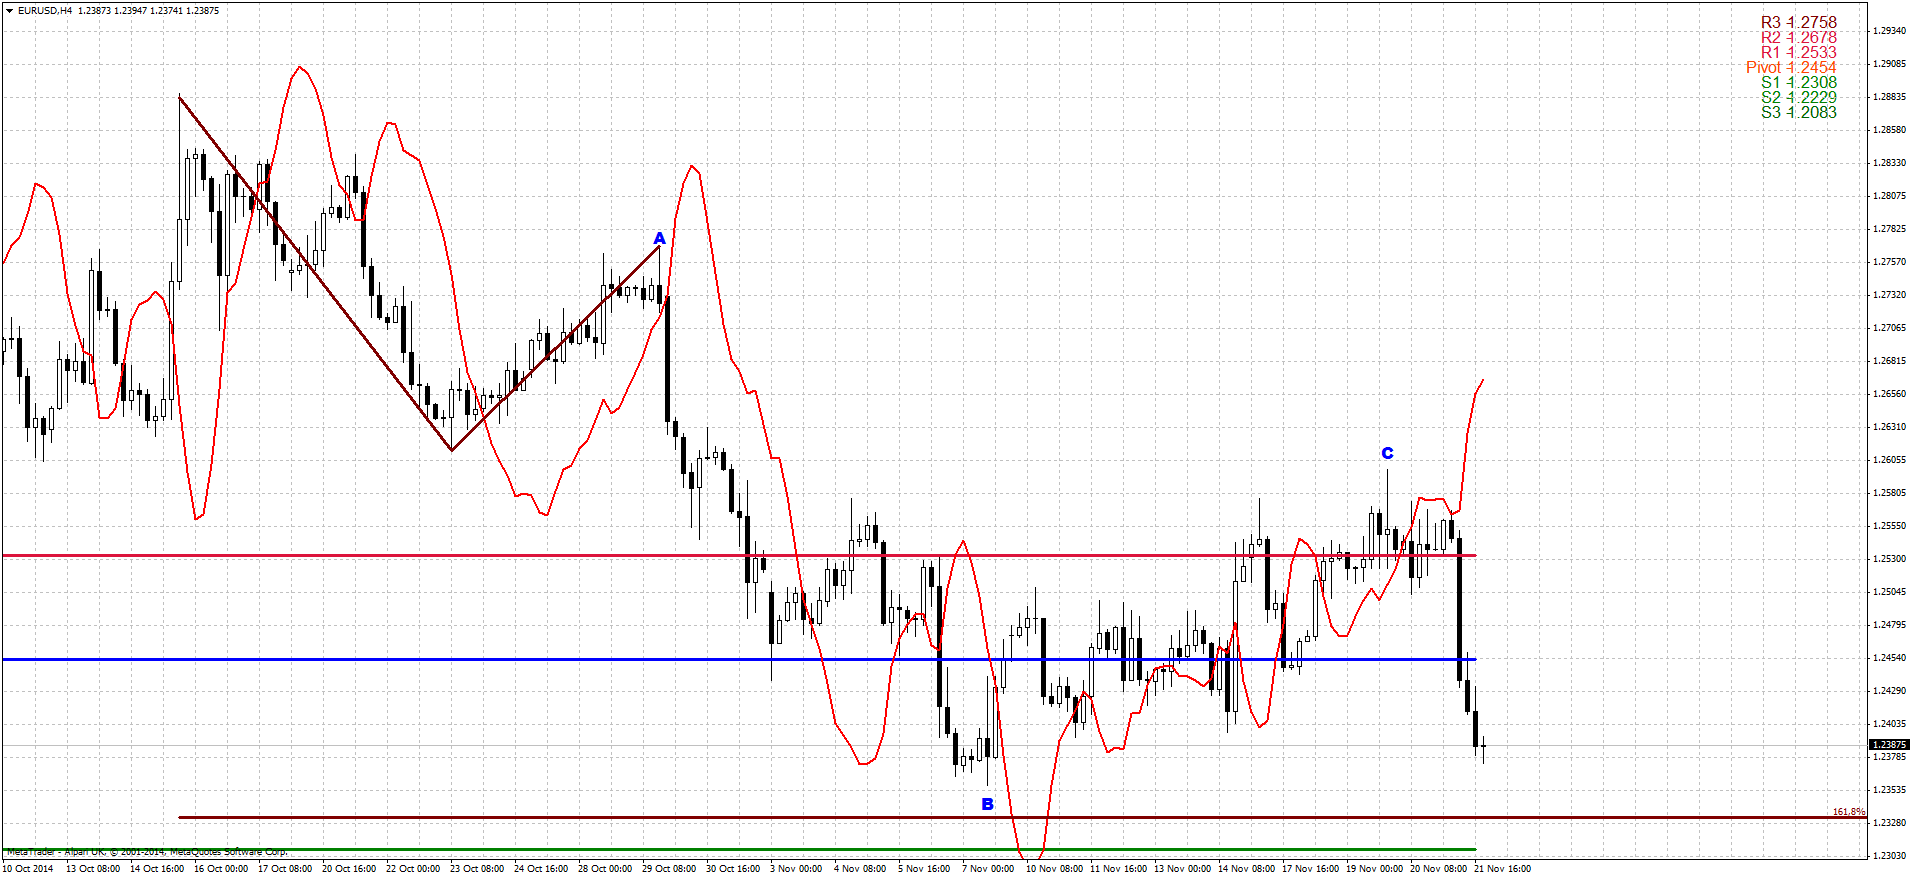
4-hour
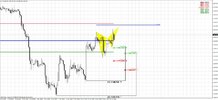
Since market is forming butterfly here, it is logical to suggest that if any retracement will happen, it will happen probably after market will reach 1210 area. Daily Stretch pattern could lead market at least to strong support area – 1181-1188. It includes former tops, WPS1 and K-support area. So if you really would like to take long position, but do not want to struggle with Stretch – think about this level.
Still, we do not sure yet, do we really have to enter long already. CFTC data looks pretty, but technically market has not shown yet drastical changes that we would like to see as confirmation of bullish strength.
Conclusion:
CFTC data looks impressive and from time to time market tries to challenge resistance. But major event still yet to happens – breakout of 1210 area or failure. In long term perpective we will be watching for bearish grabber on weekly chart. While in short-term perspective – week probably will start from some retracement due bearish Stretch on daily.
Gold climbed above $1,200 an ounce on Friday to its highest in three weeks, helped by short-covering and after a surprise interest rate cut by China fueled hopes that demand would rise in the world's biggest consumer of the metal.
Also underpinning gold's inflation-hedge appeal were remarks by European Central Bank President Mario Draghi that opened the door for more drastic measures to prevent deflation. In addition, the ECB said it had started buying asset-backed securities, in a move to encourage banks to lend and revive the economy.
"China adding stimulus, the Draghi comments and ECB buying some debt all mean that traders are especially keen on covering shorts before week end and ahead of next week's OPEC meeting," said George Gero, vice president of RBC Capital Markets.
China cut its benchmark interest rates for the first time in more than two years to lower borrowing costs and lift a cooling economy. "Any measures that accelerate the spending power of the Chinese public are bound to be positive for gold," Mitsubishi analyst Jonathan Butler said.
Traders also digested news of central bank sales and purchases. Ukraine cut its gold reserves by more than a third in October, data from the International Monetary Fund showed, while Russia raised its gold holdings for a seventh straight month.
On previous week we’ve said that we need to check CFTC report to understand what recent rally was... And, guys, this really was big change in positions. Not just shorts were covered, but longs opened and this was accompanied by change in open interest. This is first change on of such value for long time. Now is a question wether it will get any continuation and support, for example from SPDR fund statistics.
Open interest:
Technicals
Monthly
As we’ve said two of our patterns have been completed - bearish grabber @ 1400 and recent dynamic pressure that have led market to 1180 lows and clear them out. Still we have another one pattern in progress that is Volatility breakout (VOB). It suggests at least 0.618 AB-CD down. And this target is 1050$. But this is long-term perspective and in a light of recent CFTC data and possible bullish grabber it becomes not as flawless as it was couple of months ago.
On previous week we’ve mentioned potential bullish grabber on gold market and recent rally could have absoutely special meaning for us. As less and less time till the end of November, chances on confirmation of this pattern are increasing. Grabber could become a reaction on butterfly pattern that we have here. Also, as we’ve mentioned previously, the depth of the reaction is also important.
As market now stands above 1180 this could be bullish sign. Let’s not call it as reversal by far, but anyway retracement that could be triggered will be very deep. And reason for that stands due potential monthly bullish grabber. Take a note that November MACDP=1183,04. That’s why moving above 1180 will be important from this point of view as well. This could be comfirmation of the grabber. In this case market at least will return right back to 1360 Yearly Pivot point. As you can see situation is really thrilling and Friday’s rally on China’s rate cut just has added chances for success.
As market has turned to retracement up and until we will not know results of it (whether we will get grabber or not) currently it is not big sense to discuss on second question – how deep market could drop below 1180.
So here we just repeat what we’ve said previously on this subject. Thus, to understand what will happen and how far gold could fall we need keep a close eye on CFTC and SPDR data because it will warn us about possible changing.
Another factor that could impact on gold market is possible gold buying from SNB. We’ve said about it on previous week:
Swiss gold referendum's support falls short of majority: poll | Reuters
But last public opinion poll points on decreasing of supporters of this measure from 44 to 38%. Thus, currently the chances on SNB purchases are not very significant.
Finally the major driving factor for Gold is inflation and particularly here US economy has problem. All stats are improving across the board but wages and wealth of middle class stagnates. Although this is typical for first stage of grow in economical cycle, but this does not support gold appreciation by far. Still, it seems that situation slightly starts to change here. Our ultimate target stands at 1050 and this is just 80 bucks above recent 1130 lows… ABN AMRO recently told about 800$ at the end of 2015, but we have solid doubts on this forecast. The point is that Fed “plans” to change rate somewhere in 2015. It means that inflation probably will become visible somehow. And in these conditions gold will react even earlier, as well as Treasury bond market. Conclusion here is as follows. If we will get grabber we will start to think about 1360 until it will be valid. We could return back to thoughts on 1050, only if grabber will fail and market drop below 1130 again.
Weekly
Last week as reason for possible bounce we’ve mentioned significant support area that includes monthly Fib level, inner butterfly AB=CD target and MPS1. Although we’ve said above that gold has completed butterfly, but weekly chart shows that not quite. Actually we have two side-by-side butterfies here and both of them were not been completed yet normally.
Besides, market has not reached 1.618 extension target of smaller AB=CD pattern. This makes us to be worry on perspectives of this rally. May be on intraday charts 40$ explosion looks outstanding – on weekly chart market just re-tested broken 1180’s lows and formed another hammer pattern. In short-term perspective rally could continue and it will be interesting what we will get around MPP and 1200-1210 area. Existence of untouched 1.27 butterfly target is a cloud on horizon of possible upside action. Now culmination has come on weekly chart. The point is, although on Friday market has shown growth, but still it stands inside of normal retracement range and gold has not exceed 1210 area when retracement could be treated a bit overextended. At the same time CFTC shows splash in bullish activity.
That’s why we will be watching over MACDP around MPP on coming week, because gold could form bearish grabber here. If it will fail – then definitely something is changing in long-term sentiment, while if market will confirm it and it will start to work then nothing will be lost yet for bears...
Daily
Alpari UK shows a bit curious chart with missing of 2-3 candles... Anyway this is not a big problem for our analysis right now. Despite on recent rally up market has not broken through major resistance. Now it stands and completion point of harmonic swing, daily overbought and Fib resistance. Thus, we have DiNapoli bearish “Stretch pattern”. It means that this is not good time for taking long position right now if you would like to do it. Stretch probably will not cancel possibility of bullish action, but it just warns you “don’t take long right now, wait for retracement”.
4-hour
Since market is forming butterfly here, it is logical to suggest that if any retracement will happen, it will happen probably after market will reach 1210 area. Daily Stretch pattern could lead market at least to strong support area – 1181-1188. It includes former tops, WPS1 and K-support area. So if you really would like to take long position, but do not want to struggle with Stretch – think about this level.
Still, we do not sure yet, do we really have to enter long already. CFTC data looks pretty, but technically market has not shown yet drastical changes that we would like to see as confirmation of bullish strength.
Conclusion:
CFTC data looks impressive and from time to time market tries to challenge resistance. But major event still yet to happens – breakout of 1210 area or failure. In long term perpective we will be watching for bearish grabber on weekly chart. While in short-term perspective – week probably will start from some retracement due bearish Stretch on daily.