Sive Morten
Special Consultant to the FPA
- Messages
- 18,673
Fundamentals
As Reuters reports gold ended little changed on Friday but the metal posted its sharpest weekly drop in more than two months as strong U.S. economic data raised uncertainty over the timing of a slowdown in stimulus measures. Bullion investors remained cautious. On Wednesday, gold tumbled 2.5 percent after minutes of the Federal Reserve's October meeting showed U.S. central bankers could start scaling back monetary stimulus at one of their next few meetings. Disappointing physical demand from Asia and continued outflow in gold exchange-traded fund also pressured bullion prices. "Investors are in a wait-and-see mode with no urgency to buy gold. The import restrictions imposed by India also curbs demand when seasonal buying is the strongest there," said Rohit Savant, senior commodity analyst at CPM Group.
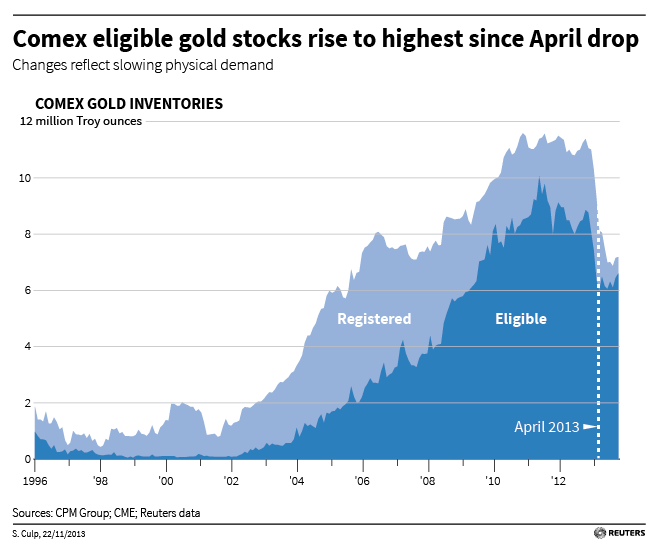
Eligible gold stocks sitting inside U.S. exchange warehouses have risen to a seven-month high, a sign physical demand has weakened after the pent-up buying seen following April's historic price drop, Comex exchange data showed. The return of some of the gold to the warehouses after an earlier outflow suggested the wave of physical buying might have run its course, removing a key support to prices. CME Group's Comex warehouse stocks are seen as a reflection of the supply-demand picture, since bullion owners tend to move their stockpile to gold markets where demand is the strongest and customers are willing to pay the highest premium above spot. Eligible" gold stocks are the exchange-approved 100-ounce gold bars held inside the five New York Comex warehouses and can be readily converted into "registered" stocks - the gold used to meet physical delivery requests from the buyers of CME gold futures. While eligible gold stocks swelled to 6.6 million ounces after hitting a near 4-year low of 5.8 million in April, registered stocks have continued to shrink since April to less than 600,000 ounces, the smallest since April 1998, exchange data showed.
 After a two-day $225 drop in mid-April, huge premiums in China and India for physical gold prompted participants to draw on their gold stocks to ship bullion into Asia for a much higher price compared to other parts of the world. "We can certainly see that the trend has deteriorated in terms of the flow of metals going from the West to the East," said Suki Cooper, precious metals analyst at Barclays Capital in New York. "We have seen the sharp decrease in Comex stocks has stabilized, implying that the metal is not needed to be drawn." In late October, Chinese gold prices fell to a discount to spot for the first time this year, as fears of a credit tightening prompted investors to sell bullion for cash. In India, gold excise tax hikes and import restrictions sharply undermined the country's gold demand, even though premiums remained lofty there due to the supply crunch. India is set to lose its top-gold-consumer status to China this year. Meanwhile, reduced trading interest among funds and institutional investors, combined with long liquidation since April, sent registered stocks to a 15-year low. Gold was in the middle of a bear market in the 1990s last time registered stocks were trading at these levels," said Jeffrey Christian, a veteran gold analyst and founder of commodities consultant CPM Group.
A spike in the ratio showing the total ounces of gold in Comex open interest divided by its registered stocks has unnerved some market participants. The gauge has surged, to a record high 68 on Friday from just 14 in March, data showed, indicating in theory there is only one ounce of gold in the warehouse to cover 68 ounces claimed by the total sum of all outstanding gold contracts. Christian said that dwindling registered stocks should not affect prices because most bullion traders want their futures cash settled. Historically, not even 5 percent of futures holders take physical deliveries, he said.
Year to date, gold was down 26 percent, on track to snap a streak of 12 consecutive yearly gains. A sharp rally in U.S. equities, an improved economic outlook and the absence of inflation have sapped gold's safe-haven appeal.
Asian dealers said there was a small pick-up in demand but they were doubtful that would last as consumers may be waiting for the market to go even lower. "The gold price drop seen earlier this week has weakened the technical picture and the next important level to watch is obviously $1,200," said Bernard Dahdah, precious metals analyst at Natixis.
Data from the International Monetary Fund on Friday showed that Germany cut its bullion holdings for the second time in five months in October. The Bundesbank said it sold 3.421 tonnes of gold for federal coin minting. Holdings of SPDR Gold Trust , the world's largest gold-backed exchange-traded fund, fell 3.6 tonnes to their lowest since early 2009 at 856.71 tonnes on Thursday. Outflows have totalled 450 tonnes this year. HSBC cut its 2013 platinum price forecast to $1,500 an ounce from $1,580, saying weaker gold prices and a shift of investment into equities had hurt platinum this year.
CFTC data shows the same picture as on previous week – small increase in open interest with mass contraction of net long positions. If open interest will show greater support to bearish net position trend, it could be a sign that long-term downward trend has continued.
Monthly
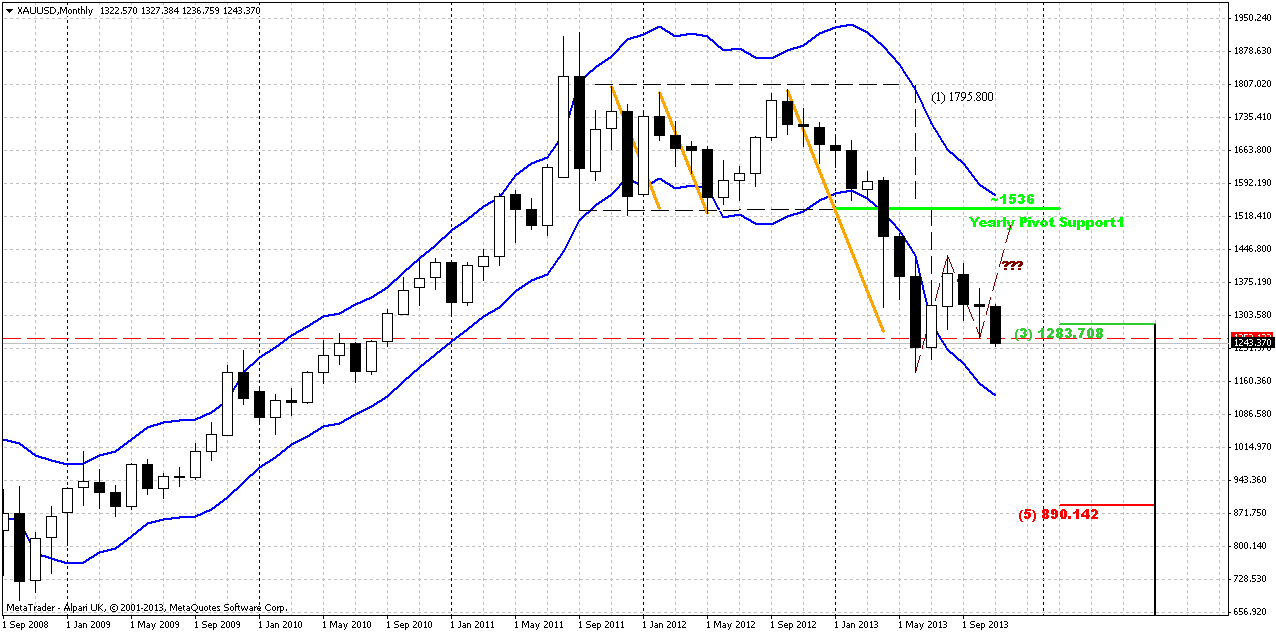
Whether we will get upward retracement and possible BC leg of larger AB=CD down move or not – that was our question for previous months and not much has changed here by far. And looks like bullish sunshine was not as long as it could. Market has moved and closed below October lows. Fundamental situation and CFTC data stand not in favor of possible appreciation. Seasonal trend is still bullish, but it is not always lead to growth. Sometimes, it could just hold depreciation and now we see something of this kind, since market stands in some range since August.
Our previous analysis (recall volatility breakout - VOB) suggests upward retracement. As market has significantly hit oversold we’ve suggested that retracement up should be solid, may be not right to overbought, but still significant. Take a look at previous bounces out from oversold – everytime retracement was significant. Thus, we’ve made an assumption of possible deeper upward retracement that could take a shape of AB=CD, and invalidation for this setup is previous lows around 1170s. If market will pass through it, then, obviously we will not see any AB=CD up. And now, as market has broken through 1250, next target is precisely previous lows around 1180. In fact this will be the last chance for possible upward bounce, if, say, market will shows something like double bottom. Price is not at oversold right now and not at major support, so really bearish market should reach previous lows level.
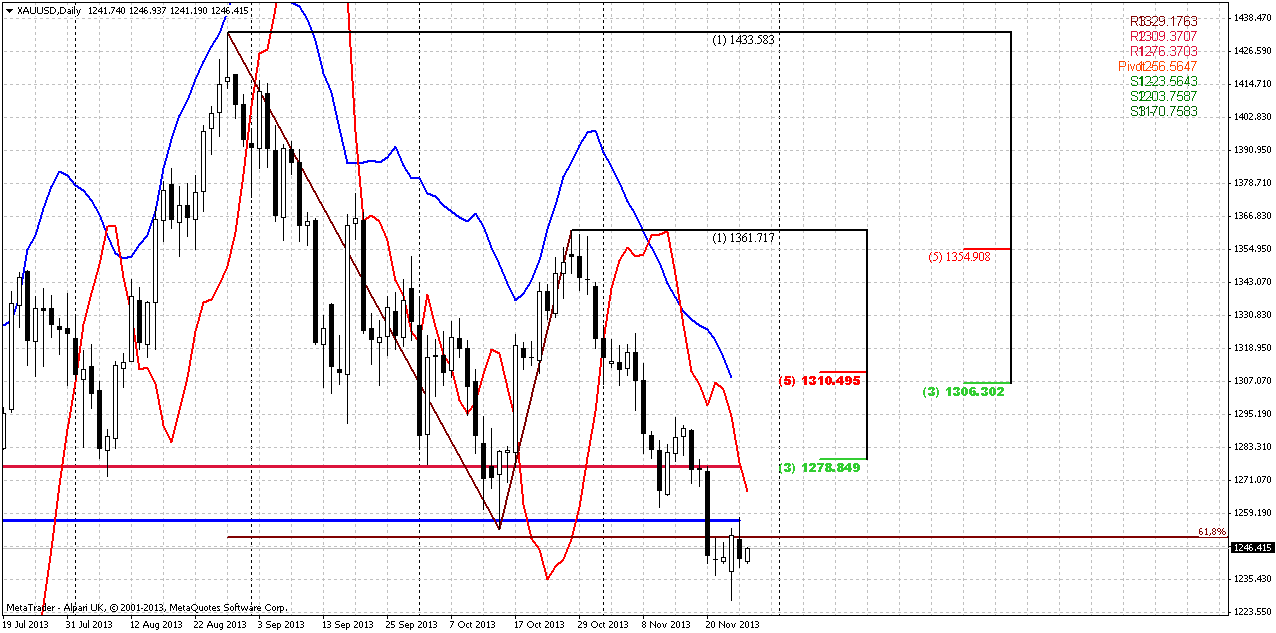
Weekly
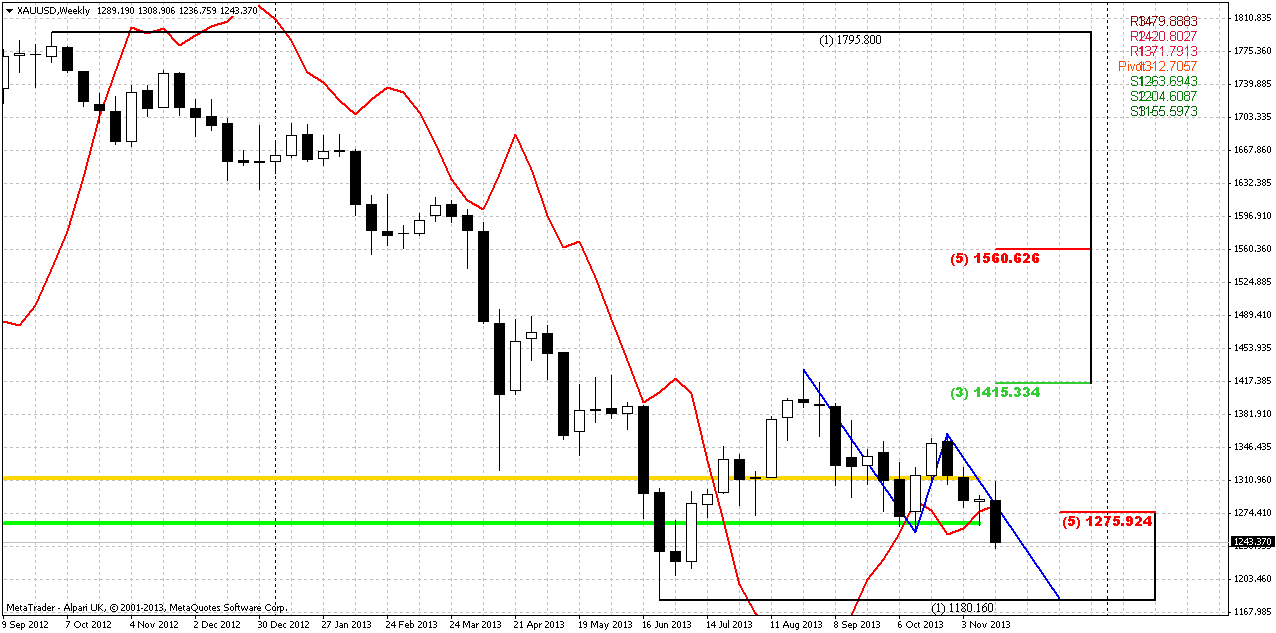
Last week has clarified situation very well. Trend has turned bearish and market has erased potential bullish stop grabber. This moment by itself shows bearish sentiment. Previous week was solid move down, price has passed through major 5/8 resistance and has closed near the lows. Another significant moment is that market has closed below MPS1. This tells that we can’t treat current move as retracement anymore. Also, interestingly that after such solid move down right from 1810 area – market has shown only small major 3/8 retracement although was strongly oversold. As market is not at oversold right now, it has good chances to proceed lower.
Currently I do not see many patterns here. The short term one that we probably will focus on is AB-CD that has target precisely at previous lows. Second, this pattern could shift later to Butterfly “Buy” if it will break through 1180.
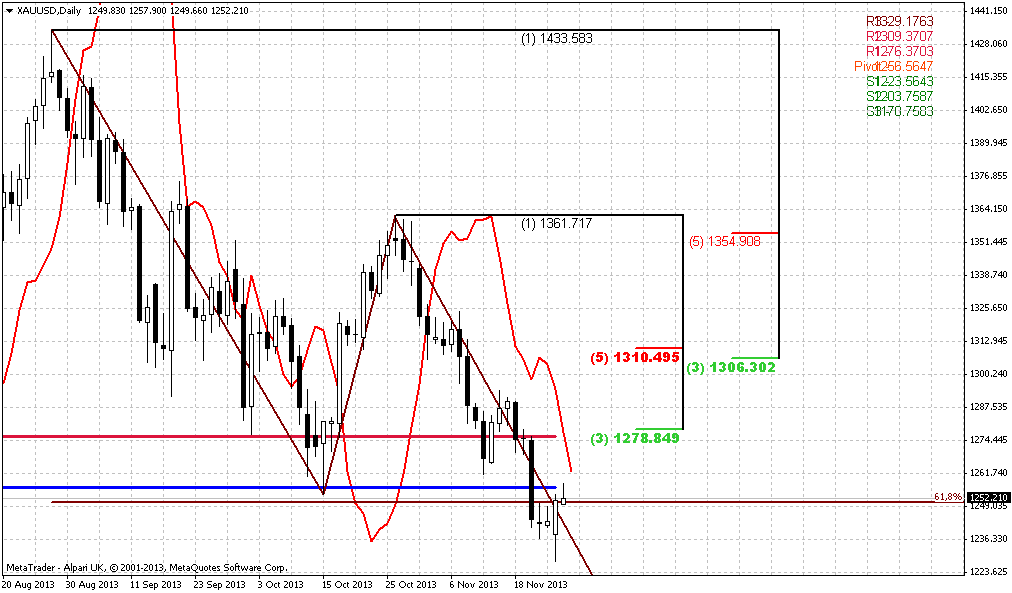
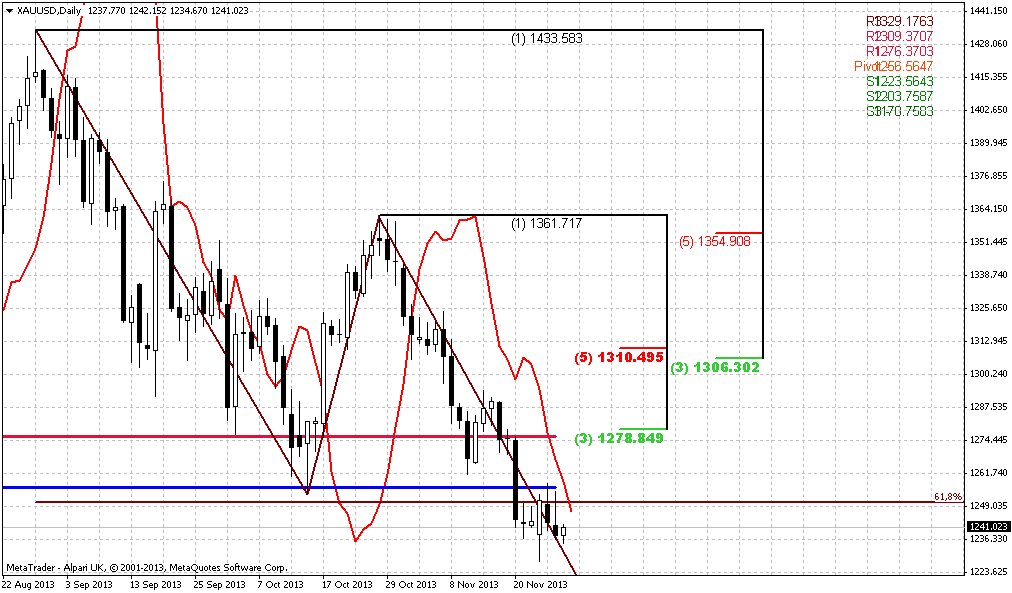
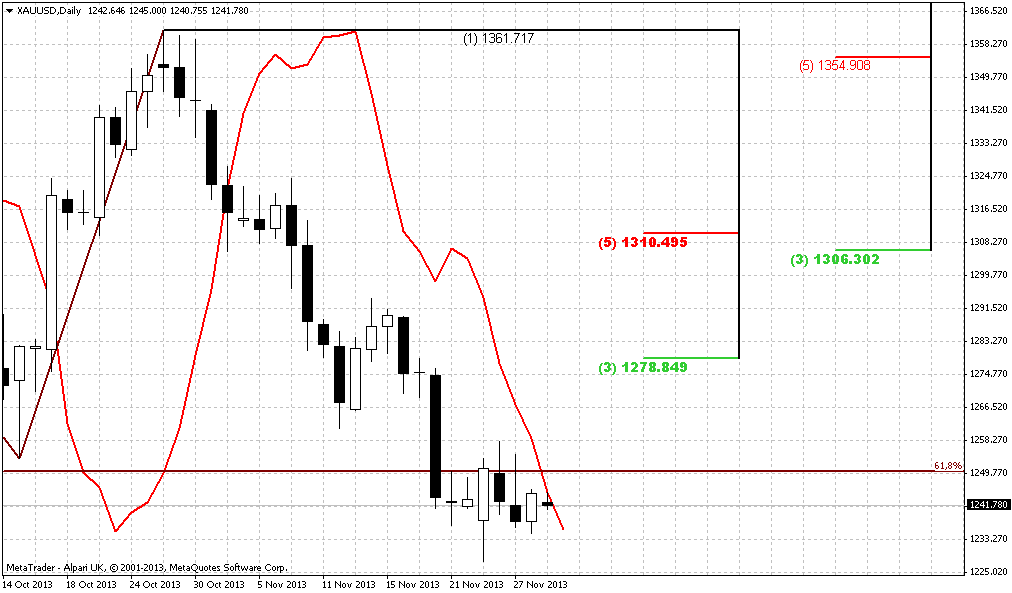
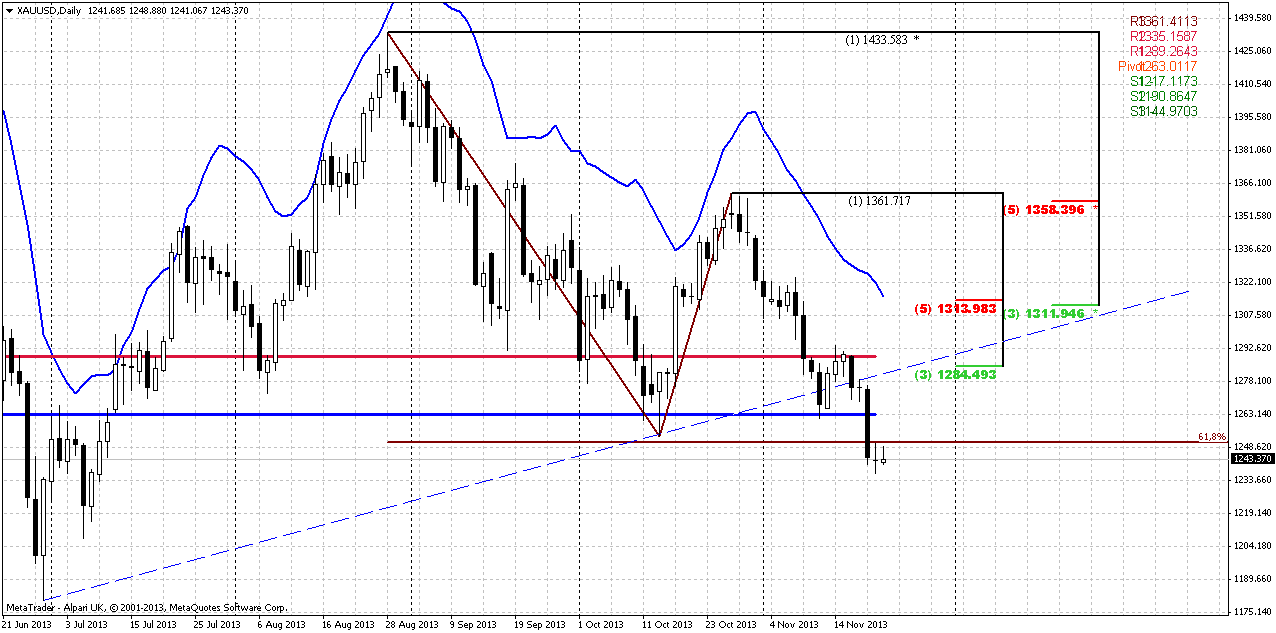
Daily
On daily time frame trend is bearish as well, and again – price is not at oversold. Here we see the same AB-CD as on weekly – market has reached minor 0.618 target and clear out previous lows. These lows are not as significant as, say, 1180 lows, since they in fact (I mean 1250) just a reaction on major 5/8 support. But still to hold absolute bearishness, I prefer to see retracement only to 1284-1289 level – combination of 3/8 Fib resistance and WPR1. First is because market is not at oversold and has hit just minor target – the less retracement will be all the better. Besides, I do not want see if bearish market will pass through WPR1 – this will point on some hidden weakness, even if we will not find any weakness signs on surface. But theoretically, if even price will retrace right up to 1311-1313 K-resistance area and overbought – that will be acceptable, but it should not go any further. If it will – this will be too much for retracement in current circumstances. Thus, two levels to watch for potential sell entry – 1284-1289 and 1311-1313 K-area. But as market already has pass through major resistance and 1250 lows, hit 0.618 target and holds there – I do not want to say that any retracement will definitely happen. It could, and if it will – we know what levels to watch for. If it will not – then we will have to prepare different trading plan on Tuesday. Also, guys, here we can’t talk about DRPO or B&B, because recent retracement up was greater than 3/8 level. It means that most part of steam was out of the pot.
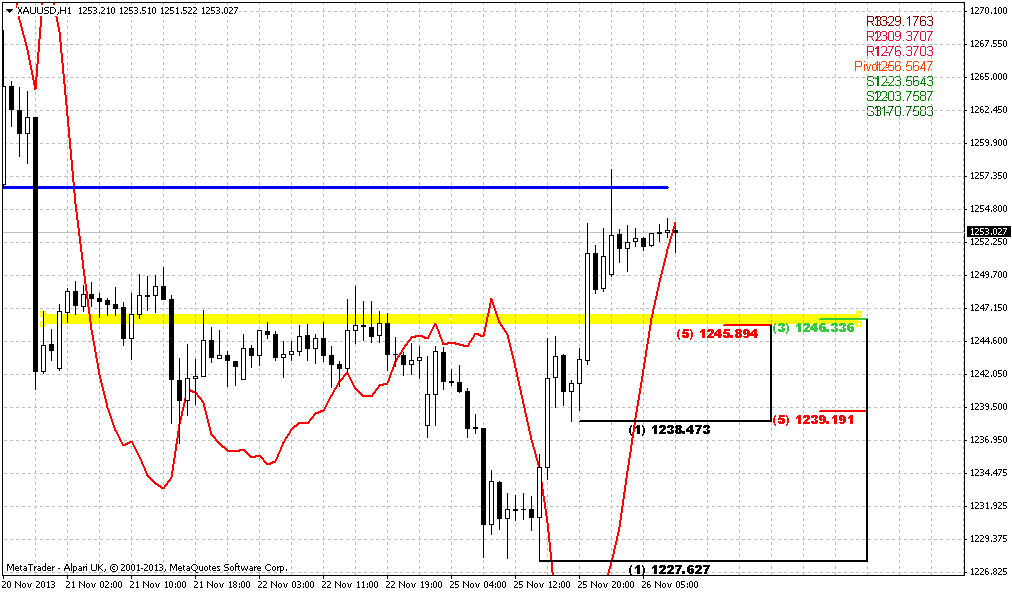
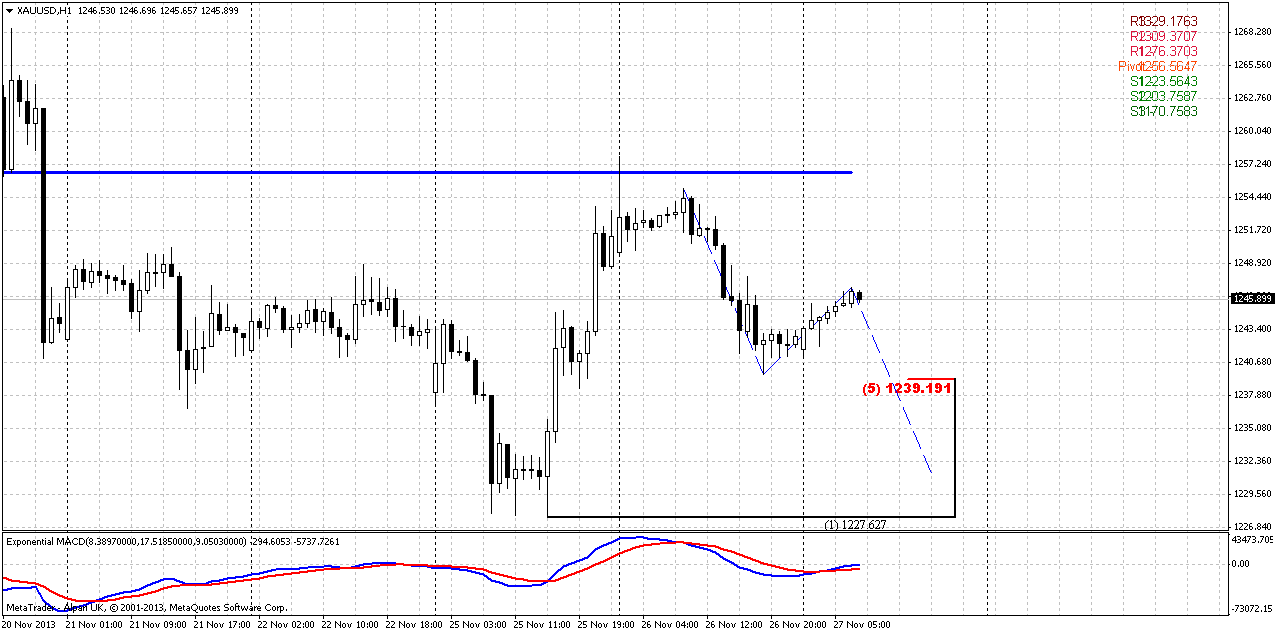
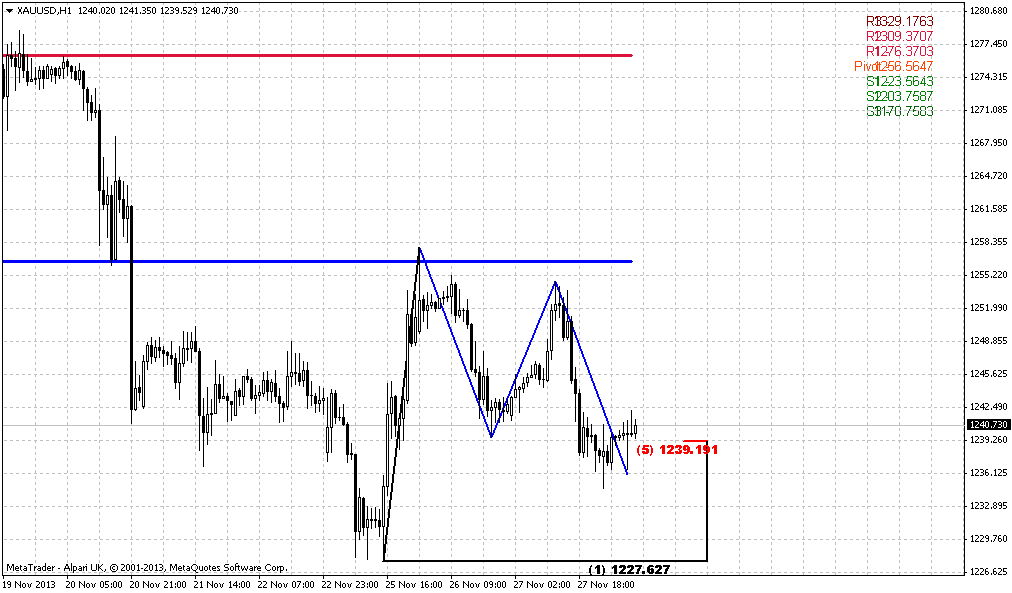
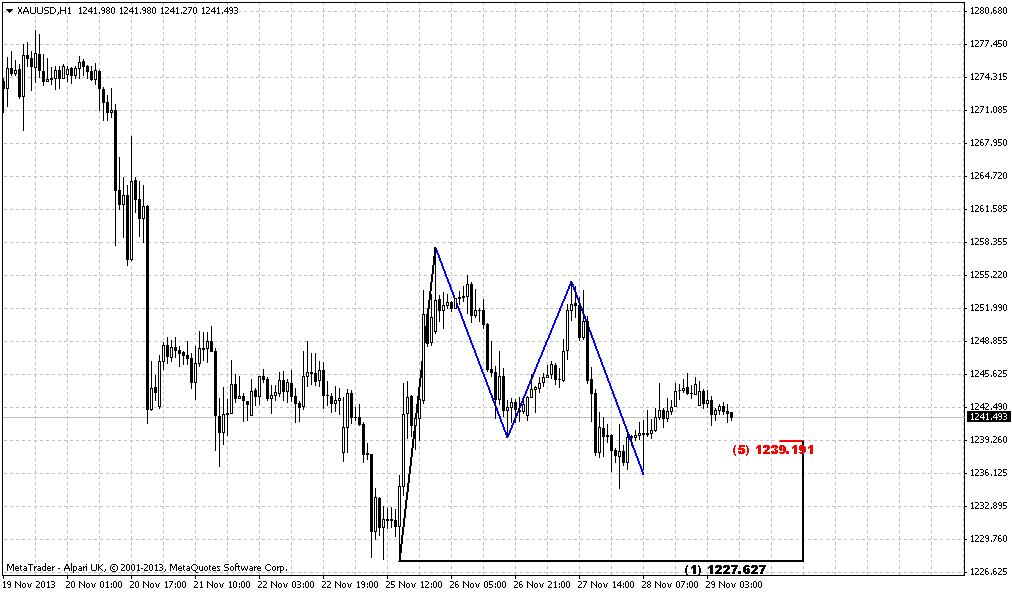
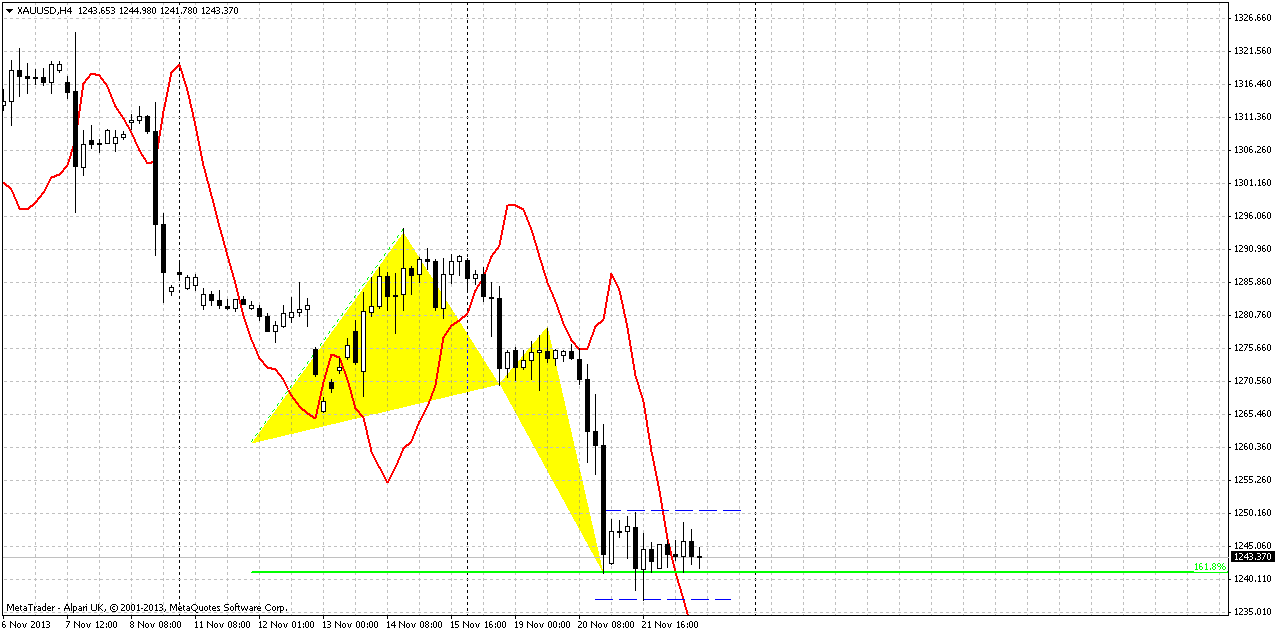
4-hour
Here we have butterfly, but it is not very reliable. Mostly by 2-3 reasons. First is very small right wing retracement. Typical butterfly level should be 0.618 – 0.88, but here it is 0.382 at best. This tells about strength of the bears. Second reason – too fast move to the 1.618 point, long nasty candle. When butterfly has such finish it has more chances to fail and carries a lot of risk, that made it not very reliable. Finally, third reason, but it stands not particular with butterfly. Take a look how market response on completion point – by no means, curious right. It seems like somebody has put someting heavy on the price and it can’t show even small bounce, very tight action. Combining that with MACDP we could get a bearish dynamic pressure, since trend has turned to bullish but price action is not. This overall situation makes shy chances on possible bounce even smaller. On hourly chart I also do not see any bullish signs or patterns right now. This makes me think that we really could get continuation without bounce, but lets do not be too hasty. If it really will be the case – we will try to enter on small bounce somewhere between 1250 and 1180 level...
Conclusion:
Currently market is not at oversold, trend on all major time frames is bearish. Recent action shows real weakness that could lead to situation when we will not see any bounce up and market will just continue move down. But let’s first work out the plan with possible bounce, but only if it will not happen – try to enter short somewhere between 1180-1250 second.
The technical portion of Sive's analysis owes a great deal to Joe DiNapoli's methods, and uses a number of Joe's proprietary indicators. Please note that Sive's analysis is his own view of the market and is not endorsed by Joe DiNapoli or any related companies.
As Reuters reports gold ended little changed on Friday but the metal posted its sharpest weekly drop in more than two months as strong U.S. economic data raised uncertainty over the timing of a slowdown in stimulus measures. Bullion investors remained cautious. On Wednesday, gold tumbled 2.5 percent after minutes of the Federal Reserve's October meeting showed U.S. central bankers could start scaling back monetary stimulus at one of their next few meetings. Disappointing physical demand from Asia and continued outflow in gold exchange-traded fund also pressured bullion prices. "Investors are in a wait-and-see mode with no urgency to buy gold. The import restrictions imposed by India also curbs demand when seasonal buying is the strongest there," said Rohit Savant, senior commodity analyst at CPM Group.
Eligible gold stocks sitting inside U.S. exchange warehouses have risen to a seven-month high, a sign physical demand has weakened after the pent-up buying seen following April's historic price drop, Comex exchange data showed. The return of some of the gold to the warehouses after an earlier outflow suggested the wave of physical buying might have run its course, removing a key support to prices. CME Group's Comex warehouse stocks are seen as a reflection of the supply-demand picture, since bullion owners tend to move their stockpile to gold markets where demand is the strongest and customers are willing to pay the highest premium above spot. Eligible" gold stocks are the exchange-approved 100-ounce gold bars held inside the five New York Comex warehouses and can be readily converted into "registered" stocks - the gold used to meet physical delivery requests from the buyers of CME gold futures. While eligible gold stocks swelled to 6.6 million ounces after hitting a near 4-year low of 5.8 million in April, registered stocks have continued to shrink since April to less than 600,000 ounces, the smallest since April 1998, exchange data showed.
A spike in the ratio showing the total ounces of gold in Comex open interest divided by its registered stocks has unnerved some market participants. The gauge has surged, to a record high 68 on Friday from just 14 in March, data showed, indicating in theory there is only one ounce of gold in the warehouse to cover 68 ounces claimed by the total sum of all outstanding gold contracts. Christian said that dwindling registered stocks should not affect prices because most bullion traders want their futures cash settled. Historically, not even 5 percent of futures holders take physical deliveries, he said.
Year to date, gold was down 26 percent, on track to snap a streak of 12 consecutive yearly gains. A sharp rally in U.S. equities, an improved economic outlook and the absence of inflation have sapped gold's safe-haven appeal.
Asian dealers said there was a small pick-up in demand but they were doubtful that would last as consumers may be waiting for the market to go even lower. "The gold price drop seen earlier this week has weakened the technical picture and the next important level to watch is obviously $1,200," said Bernard Dahdah, precious metals analyst at Natixis.
Data from the International Monetary Fund on Friday showed that Germany cut its bullion holdings for the second time in five months in October. The Bundesbank said it sold 3.421 tonnes of gold for federal coin minting. Holdings of SPDR Gold Trust , the world's largest gold-backed exchange-traded fund, fell 3.6 tonnes to their lowest since early 2009 at 856.71 tonnes on Thursday. Outflows have totalled 450 tonnes this year. HSBC cut its 2013 platinum price forecast to $1,500 an ounce from $1,580, saying weaker gold prices and a shift of investment into equities had hurt platinum this year.
CFTC data shows the same picture as on previous week – small increase in open interest with mass contraction of net long positions. If open interest will show greater support to bearish net position trend, it could be a sign that long-term downward trend has continued.
Monthly
Whether we will get upward retracement and possible BC leg of larger AB=CD down move or not – that was our question for previous months and not much has changed here by far. And looks like bullish sunshine was not as long as it could. Market has moved and closed below October lows. Fundamental situation and CFTC data stand not in favor of possible appreciation. Seasonal trend is still bullish, but it is not always lead to growth. Sometimes, it could just hold depreciation and now we see something of this kind, since market stands in some range since August.
Our previous analysis (recall volatility breakout - VOB) suggests upward retracement. As market has significantly hit oversold we’ve suggested that retracement up should be solid, may be not right to overbought, but still significant. Take a look at previous bounces out from oversold – everytime retracement was significant. Thus, we’ve made an assumption of possible deeper upward retracement that could take a shape of AB=CD, and invalidation for this setup is previous lows around 1170s. If market will pass through it, then, obviously we will not see any AB=CD up. And now, as market has broken through 1250, next target is precisely previous lows around 1180. In fact this will be the last chance for possible upward bounce, if, say, market will shows something like double bottom. Price is not at oversold right now and not at major support, so really bearish market should reach previous lows level.
Weekly
Last week has clarified situation very well. Trend has turned bearish and market has erased potential bullish stop grabber. This moment by itself shows bearish sentiment. Previous week was solid move down, price has passed through major 5/8 resistance and has closed near the lows. Another significant moment is that market has closed below MPS1. This tells that we can’t treat current move as retracement anymore. Also, interestingly that after such solid move down right from 1810 area – market has shown only small major 3/8 retracement although was strongly oversold. As market is not at oversold right now, it has good chances to proceed lower.
Currently I do not see many patterns here. The short term one that we probably will focus on is AB-CD that has target precisely at previous lows. Second, this pattern could shift later to Butterfly “Buy” if it will break through 1180.
Daily
On daily time frame trend is bearish as well, and again – price is not at oversold. Here we see the same AB-CD as on weekly – market has reached minor 0.618 target and clear out previous lows. These lows are not as significant as, say, 1180 lows, since they in fact (I mean 1250) just a reaction on major 5/8 support. But still to hold absolute bearishness, I prefer to see retracement only to 1284-1289 level – combination of 3/8 Fib resistance and WPR1. First is because market is not at oversold and has hit just minor target – the less retracement will be all the better. Besides, I do not want see if bearish market will pass through WPR1 – this will point on some hidden weakness, even if we will not find any weakness signs on surface. But theoretically, if even price will retrace right up to 1311-1313 K-resistance area and overbought – that will be acceptable, but it should not go any further. If it will – this will be too much for retracement in current circumstances. Thus, two levels to watch for potential sell entry – 1284-1289 and 1311-1313 K-area. But as market already has pass through major resistance and 1250 lows, hit 0.618 target and holds there – I do not want to say that any retracement will definitely happen. It could, and if it will – we know what levels to watch for. If it will not – then we will have to prepare different trading plan on Tuesday. Also, guys, here we can’t talk about DRPO or B&B, because recent retracement up was greater than 3/8 level. It means that most part of steam was out of the pot.
4-hour
Here we have butterfly, but it is not very reliable. Mostly by 2-3 reasons. First is very small right wing retracement. Typical butterfly level should be 0.618 – 0.88, but here it is 0.382 at best. This tells about strength of the bears. Second reason – too fast move to the 1.618 point, long nasty candle. When butterfly has such finish it has more chances to fail and carries a lot of risk, that made it not very reliable. Finally, third reason, but it stands not particular with butterfly. Take a look how market response on completion point – by no means, curious right. It seems like somebody has put someting heavy on the price and it can’t show even small bounce, very tight action. Combining that with MACDP we could get a bearish dynamic pressure, since trend has turned to bullish but price action is not. This overall situation makes shy chances on possible bounce even smaller. On hourly chart I also do not see any bullish signs or patterns right now. This makes me think that we really could get continuation without bounce, but lets do not be too hasty. If it really will be the case – we will try to enter on small bounce somewhere between 1250 and 1180 level...
Conclusion:
Currently market is not at oversold, trend on all major time frames is bearish. Recent action shows real weakness that could lead to situation when we will not see any bounce up and market will just continue move down. But let’s first work out the plan with possible bounce, but only if it will not happen – try to enter short somewhere between 1180-1250 second.
The technical portion of Sive's analysis owes a great deal to Joe DiNapoli's methods, and uses a number of Joe's proprietary indicators. Please note that Sive's analysis is his own view of the market and is not endorsed by Joe DiNapoli or any related companies.