Sive Morten
Special Consultant to the FPA
- Messages
- 18,699
Fundamentals
Weekly Gold Tading Report prepared by Sive Morten exclusively for ForexPeaceArmy.com
As Reuters reports Gold edged lower on Friday and closed down for the week as rallying equity markets and strong U.S. economic data dented demand for the precious metal as an insurance against risk.
Sales of new U.S. single-family homes rose to a six-year high in September, but a sharp downward revision to August's sales pace indicated the housing recovery remains tentative.
Bullion notched a 0.5 percent weekly loss, after two consecutive weekly rises driven by renewed worries about global economic growth.
"A better run of U.S. data has calmed nerves about the wider economy, and that has put pressure on gold in the past few days, as it had been enjoying a safe-haven bid," said Matthew Turner, an analyst at Macquarie.
In gold's official-sector news, a proposal to prohibit the Swiss National Bank from selling any of its gold reserves has the support of 44 percent of the public, though that result falls short of the backing it needs to become law, a closely watched survey showed.
Holdings in SPDR Gold Trust , the world's top bullion exchange-traded fund, fell to their lowest level since late 2008 this week in a sign of lingering bearish sentiment in the bullion market. The fund this week recorded its biggest daily percentage drop in holdings in a year, despite a price jump to a six-week high.
The U.S. Federal Reserve's policy meeting on Tuesday and Wednesday will be the next major focus for the market. The consensus view is for the U.S. central bank to decide to wrap up asset purchases under its third round of quantitative easing. Investors will be looking for any clues on the possible timing of an interest rate increase.
 Source: CFTC, Reuters
CFTC Report shows growth in net long position but flat open interest data. It means that net long position has increased due closing of shorts rather then opening new long positions. This is important but does not confirm reversal yet. When true reversal comes – net long position should grow simultaneously with open interest.
Monthly
October month as you can see shows mostly flat action. Currently on long term gold we have, let’s call it two big clusters on of analysis. First cluster is “certainty”. It tells that we have two patterns in progress. Frist one is monthly bearish stop grabber, that has minimum target at 1180. Second one is Volatility breakout (VOB) that suggests at least 0.618 AB-CD down. And this target is 1050$. Butterfly pattern that we see on monthly chart is not very important and just shows how this downward action could happen. 1.618 extension of Butterfly coincides with VOB 0.618 AB-CD target.
Second cluster is “uncertainty”. This pack of information rises questions. Whether market will clear 1180, how far market could move below 1180 – 1100, 1050? We can’t answer on second question yet.
Why we still think that market should clear out 1180 lows? This expectation mostly is based on gold habits and overall fundamental situation. Gold habits suggest that market almost never leaves behind significant lows. Technically current retracement seems absolutely logical and not overextended. Market just re-tested 1240 lows – and this is also one of the habit of the gold market.
Fundamentally economy data is not really bad, right now is confirmed by US companies earning reports, weak physical demand and anemic inflation – all these moments prevent gold appreciation. Fall of crude oil prices also is supporting factor for economy in long term, because household and industry will get signficant economy on energy expenses, especially on coming winter. Also we have to say that active part seasonal bullish trend will finish in December. Currently it should be mostly active, but right now we see that Asian physical demand is not enough to push market higher, when instituational investors stand flat and do not put money in gold.
Technically during recent rally market was not able to re-test Yearly Pivot. In the beginning of the year market has tested YPP and failed, then continued move down. During recent attempt to move higher – has not even reached YPP again.
So may be we should have some concern on possible end of downward action and upside reversal, but right now we just do not see any foundation and reasons for that. As we’ve said million times – we do not believe much in current rally, because it is absolutely unclear what it is based on, except may be individual demand in Asia.
That’s why somehow we still think that we will get another leg down to 1180. After that the time will come to answer on second question – whether market will break this level and how deep it will fall.
That’s being said, situation on the monthly chart does not suggest yet taking long-term long positions on gold. Fundamental picture is moderately bearish in long-term.
Recent retracement on many markets – oil, equities, gold is mostly triggered not by sentiment changing but strong oversold. Markets probably overreacted a bit under pressure of Ebola fever spreading, surprisingly bad data from China and EU, sophisticated geopolitical situation. All these factors have coincided and hit markets. Right now situation has got some relief, but on Friday gold already has turned down.
Weekly
On weekly chart market has reached strong support area that includes targets, MPS1, butterfly extension and others. As you can see gold has confirmed this level by nicely looking weekly engulfing pattern that has led to upside retracement. We suggest that even action to 1260 will not lead to breaking bearish sentiment and will not mean that downward trend is over.
Even Vice versa, as we’ve said above taking in consideration gold’s habits, we could suggest that 1180 will be reached and washed out. We suggest that current move up is some sort of bulls’ trap to involve more traders in upside action and then grab their stops either. It does not mean that you can’t trade it up, but it means that you have to take profit fast.
We also know that until MPR1 holds upside retracement – bearish trend stands valid. It means that market could show retracement even into 1260 K-resistance area and WPR1 and this will not mean that bearish trend has been broken. Somewhere around stands the target of engulfing pattern. At the same time this level simultaneously will become an indicator of breakout. Any action above MPR1 will suggest that sentiment has changed and this is not just retracement already. But currently market just has reached nearest resistance and done this not very steadily. Last week market has bounced down from resistance and closed below MPP again. Two weeks in a row candles have long upper shadows. This indicates that market has not enough power to hold above this resistance. And this seems reasonable, since we do not have any real purchases that could give gold this power.
On coming week price will approach to MACDP and we will closely look for grabber. It could come because volatility probably will increase due Fed meeting.
That’s being said, weekly chart leads us to conclusion that right now as market has some upside reserve – it is too early to treat it as reversal and shift in long-term sentiment. Still, we can’t exclude this scenario totally, as we see some shifting in CFTC data, although it is mostly anemic by far. The key to success here is to keep watching on combination of action, patterns and CFTC/SPDR data around important 1260 area.
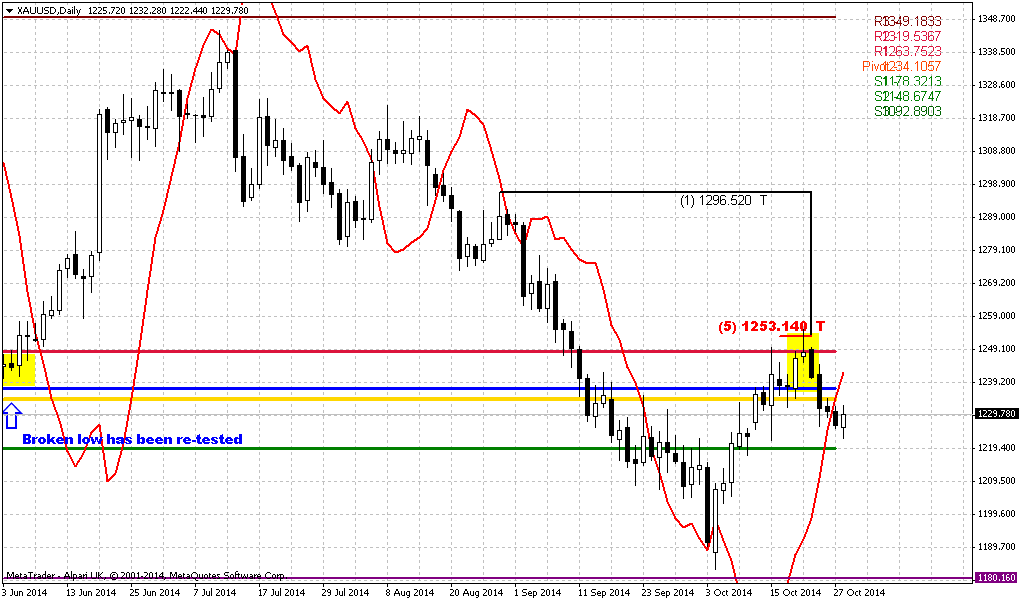
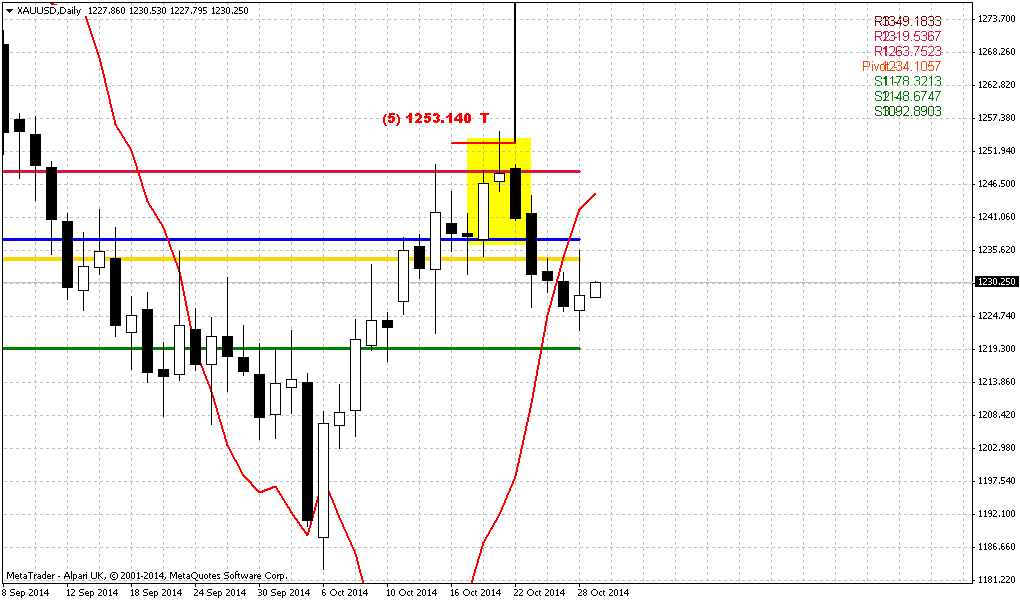
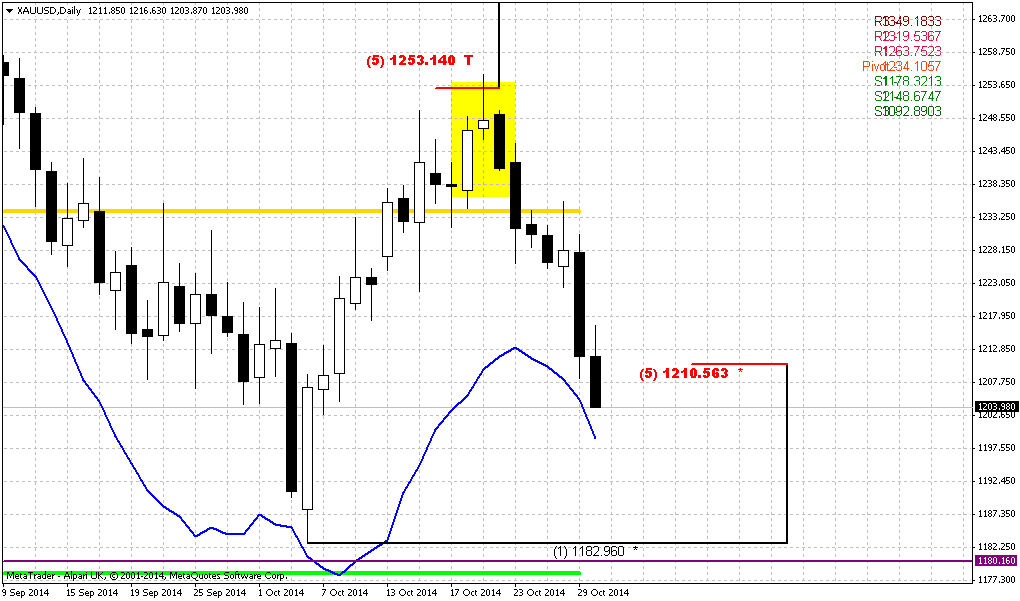
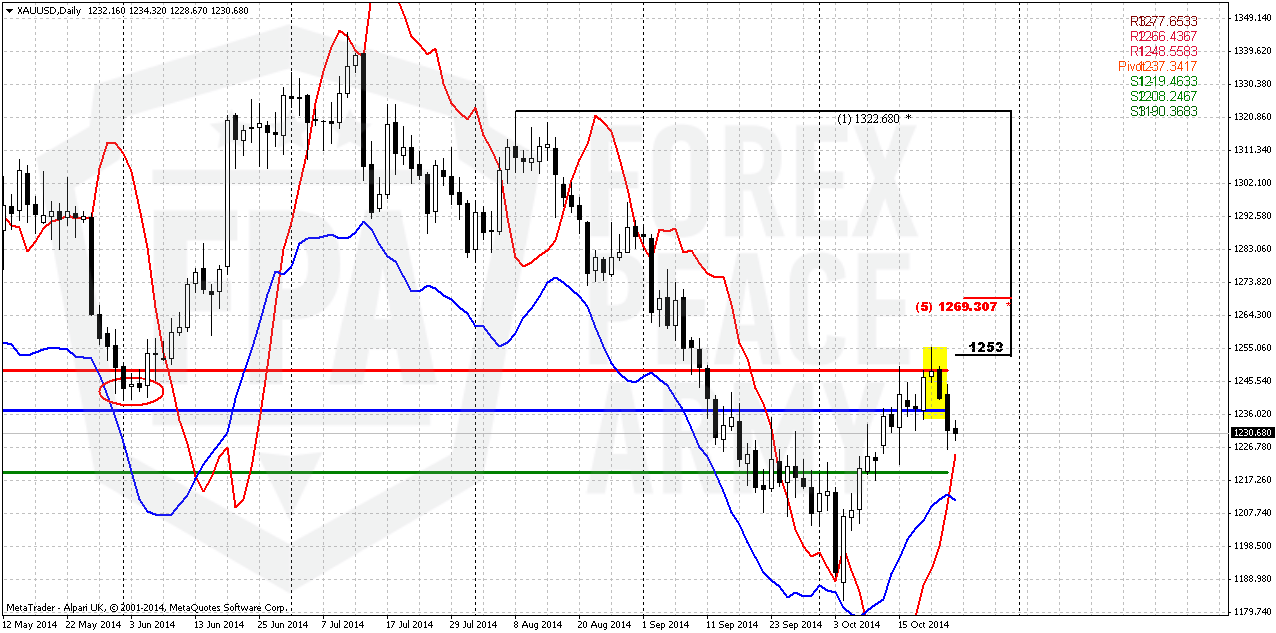
Daily
As we’ve mentioned on Friday – we’ve got evening star pattern right at daily resistance and former 1240 lows that were re-tested. Right now major question is whether market will show just retracement and then AB=CD up or this is really reversal and road to 1180. First of all, evening star pattern could lead to as first scenario as second one.
The only clue that we have here is WPS1 and daily oversold level. They stand above 1180. Hardly market will move lower immediately, and it means that for the next week we will not take into consideration 1180. Mostly our downside target will be WPS1, may be some fib support and daily oversold. This is probably maximum that gold will be able to reach, even having Fed meeting on the back.
Another pattern that could be formed within 1-2 trading sessions, and we’ve talked about it as well on Friday, is bullish grabber. It is interesting that bullish grabber here absolutely does not contradict with possible bearish one on weekly chart.
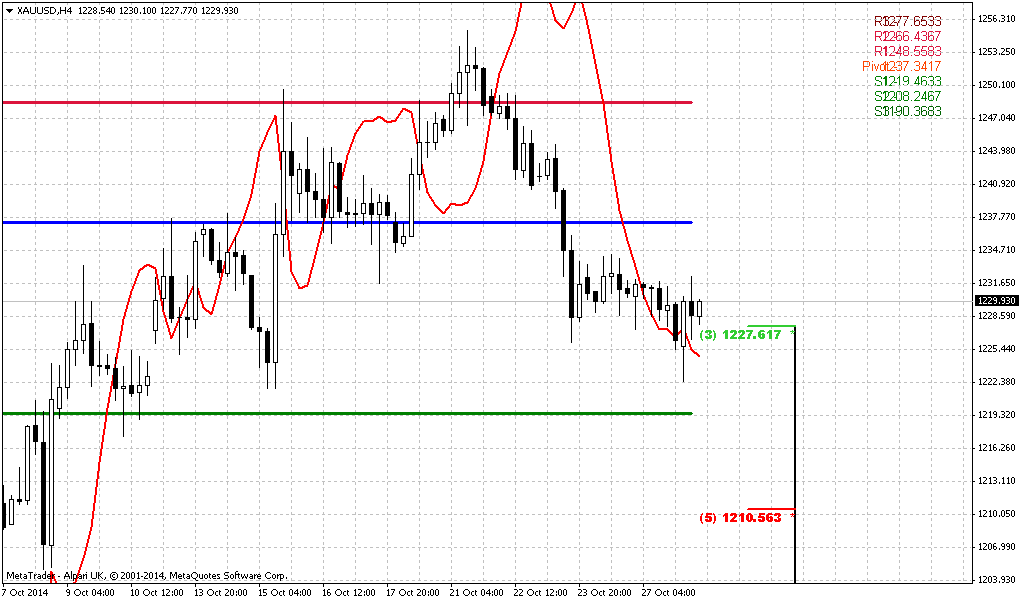
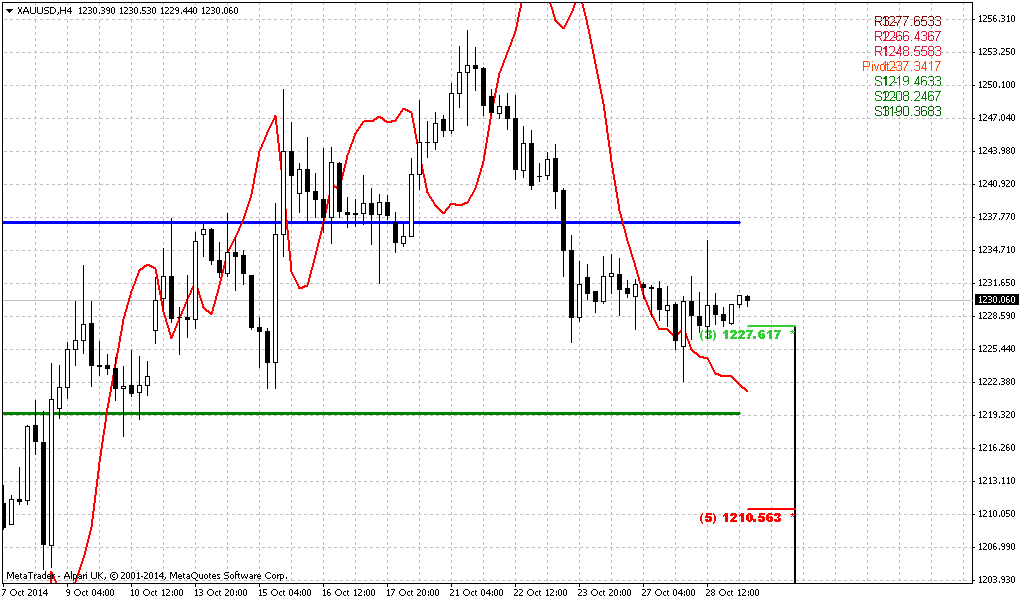
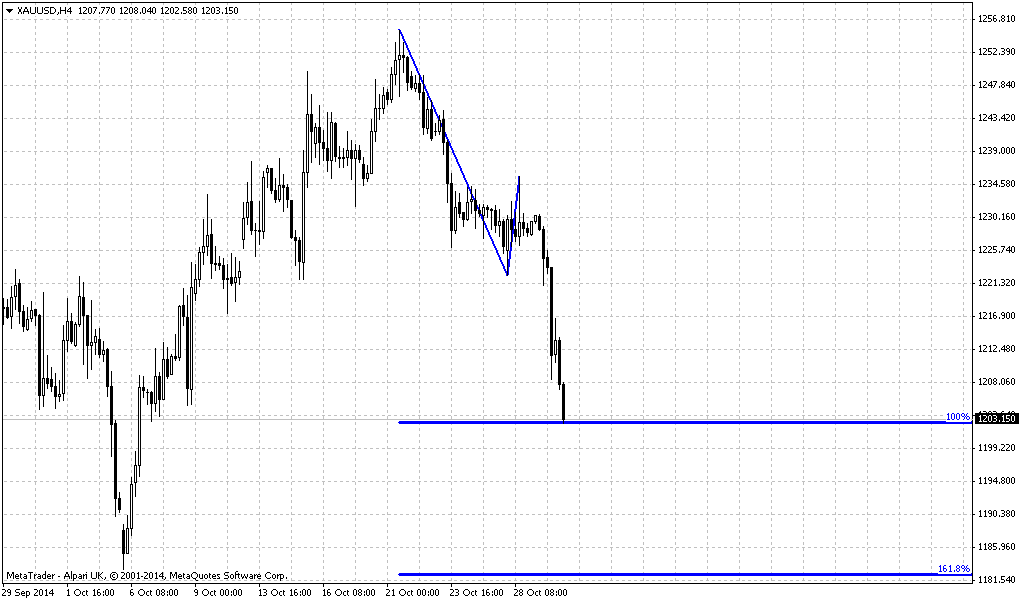
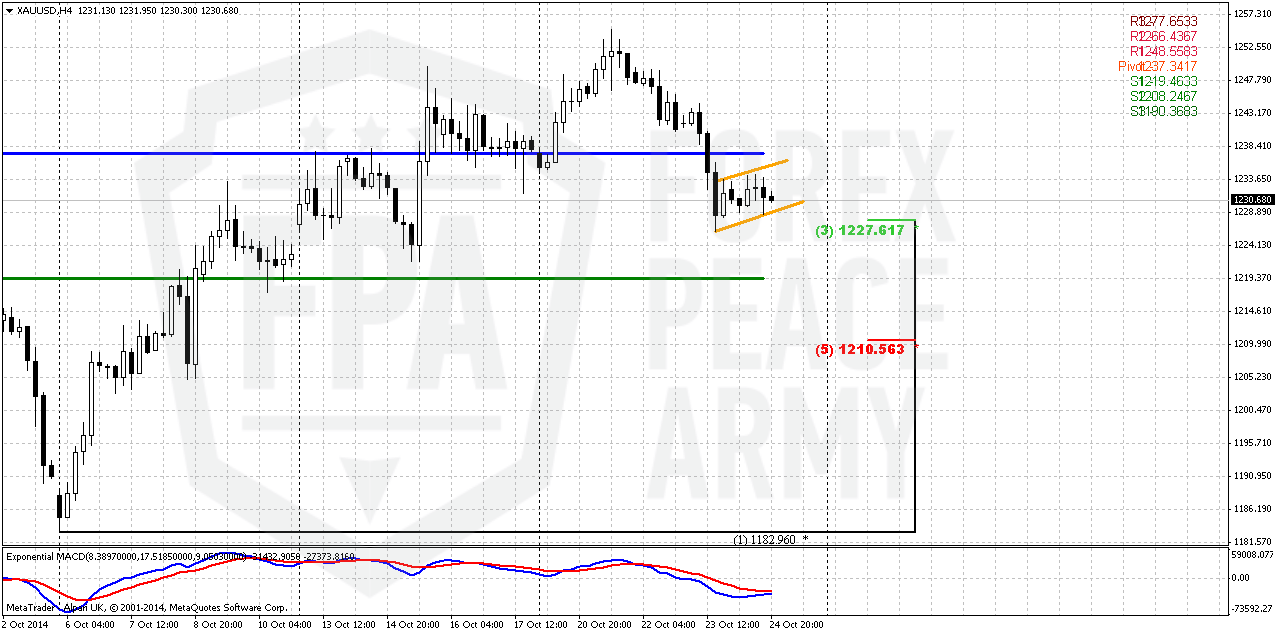
4-hour
This chart shows that harmonic retracement swing has been broken and market doubles it. In recent couple of sessions market was forming bearish flag pattern that suggests downward continuation. We do not have any tools here to estimate possible target clear, but based on flag’s mast – gold really should reach WPS1 and daily oversold.
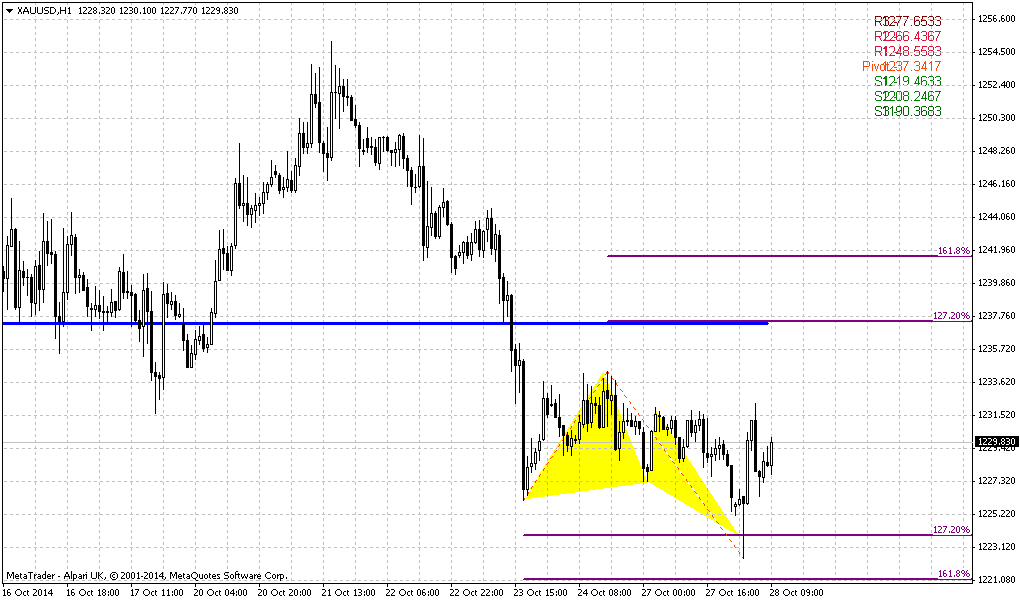
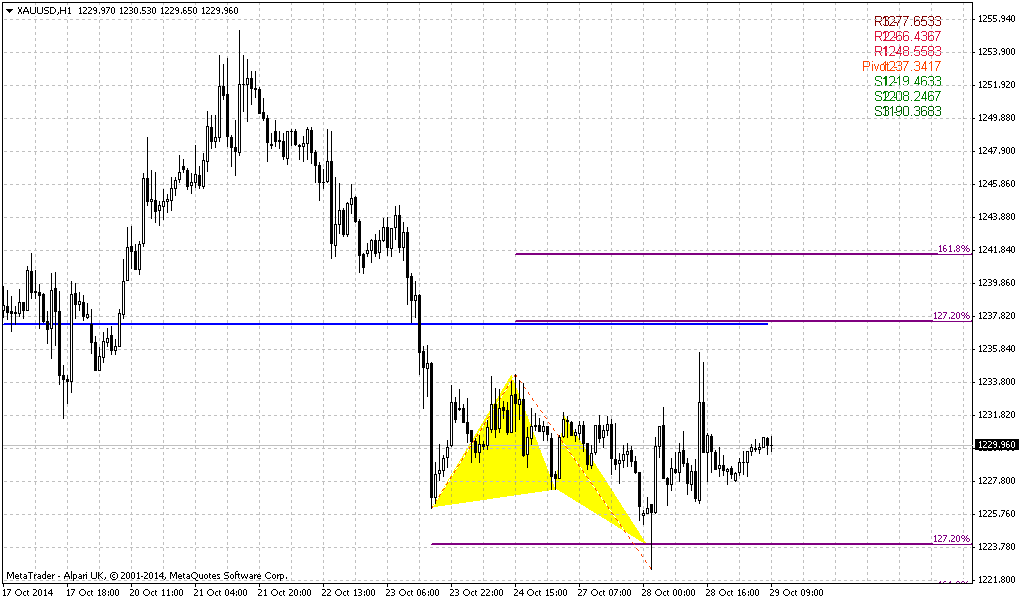
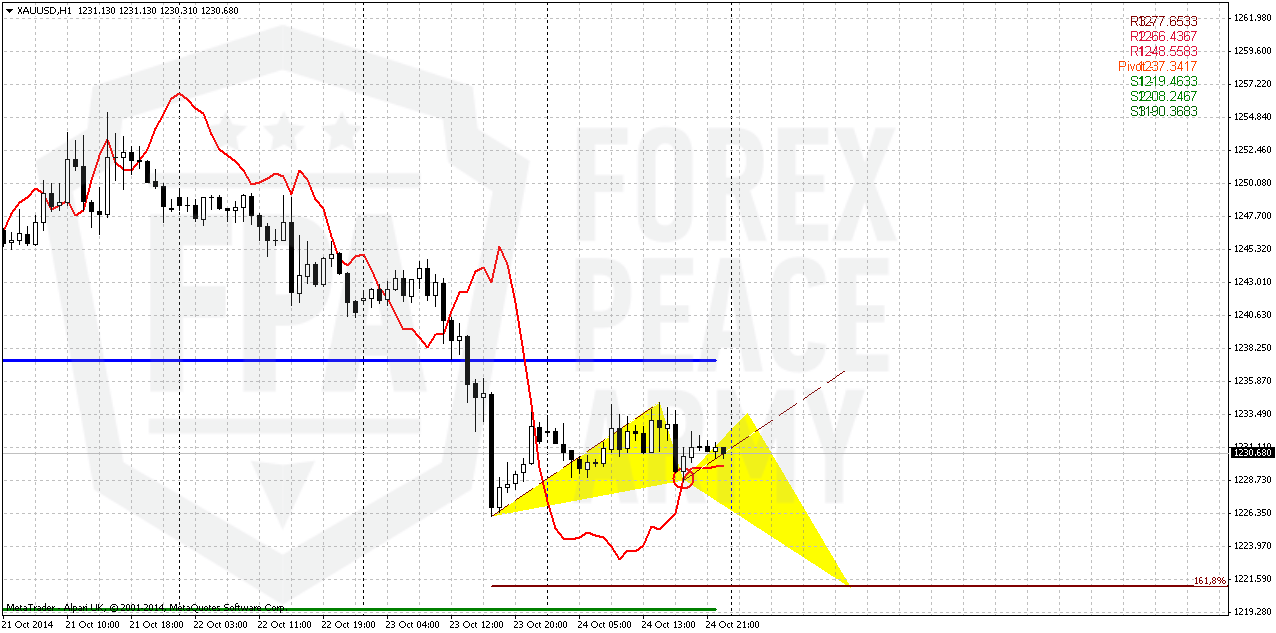
1-hour
Speaking about action inside flag here is two scenarios are possible. As ou can see we have bullish grabber that suggests taking out of recent highs. This could lead to some AB=CD pattern that will let market to touch WPP. This will not break overall situation on 4-hour chart with flag but just postone a bit downward action.
If grabber will fail, situation could turn to butterfly pattern. 1.618 level coincides with WPS1 area.
Conclusion:
Situation on gold market remains sophisticated. Due bearish moments, such as bullish USD sentiment, lack of physical demand, gold has re-established recently downward action. On a way down market could pass through multiple target and nearest one is 1180$. We even have setup on big picture that suggests moving to 1050 area.
In short term perspective gold hardly will move to 1180 directly due WPS1 and daily oversold. That’s why on coming week we mostly will keep an eye on downward continuation to 1215-1219 area. Also we can’t exclude situation when gold still could form AB-CD retracement up. This setup could come true if we will get bullish grabber on Mon-Tue and it will not fail.
The technical portion of Sive's analysis owes a great deal to Joe DiNapoli's methods, and uses a number of Joe's proprietary indicators. Please note that Sive's analysis is his own view of the market and is not endorsed by Joe DiNapoli or any related companies.
Weekly Gold Tading Report prepared by Sive Morten exclusively for ForexPeaceArmy.com
As Reuters reports Gold edged lower on Friday and closed down for the week as rallying equity markets and strong U.S. economic data dented demand for the precious metal as an insurance against risk.
Sales of new U.S. single-family homes rose to a six-year high in September, but a sharp downward revision to August's sales pace indicated the housing recovery remains tentative.
Bullion notched a 0.5 percent weekly loss, after two consecutive weekly rises driven by renewed worries about global economic growth.
"A better run of U.S. data has calmed nerves about the wider economy, and that has put pressure on gold in the past few days, as it had been enjoying a safe-haven bid," said Matthew Turner, an analyst at Macquarie.
In gold's official-sector news, a proposal to prohibit the Swiss National Bank from selling any of its gold reserves has the support of 44 percent of the public, though that result falls short of the backing it needs to become law, a closely watched survey showed.
Holdings in SPDR Gold Trust , the world's top bullion exchange-traded fund, fell to their lowest level since late 2008 this week in a sign of lingering bearish sentiment in the bullion market. The fund this week recorded its biggest daily percentage drop in holdings in a year, despite a price jump to a six-week high.
The U.S. Federal Reserve's policy meeting on Tuesday and Wednesday will be the next major focus for the market. The consensus view is for the U.S. central bank to decide to wrap up asset purchases under its third round of quantitative easing. Investors will be looking for any clues on the possible timing of an interest rate increase.
CFTC Report shows growth in net long position but flat open interest data. It means that net long position has increased due closing of shorts rather then opening new long positions. This is important but does not confirm reversal yet. When true reversal comes – net long position should grow simultaneously with open interest.
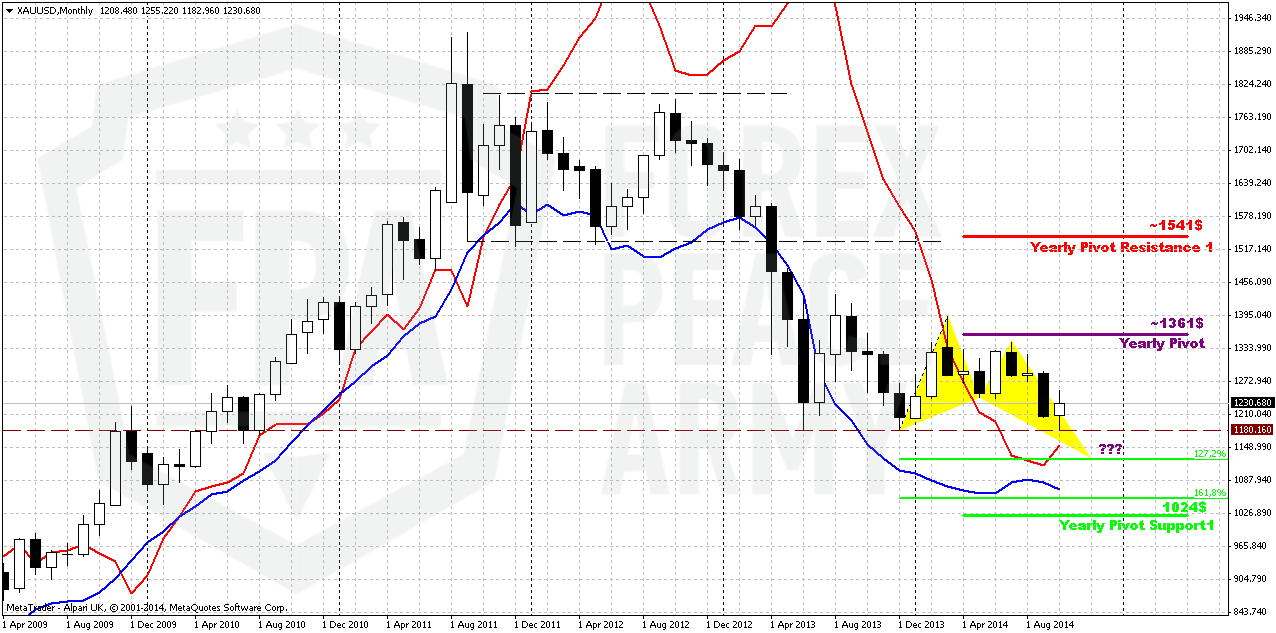
Monthly
October month as you can see shows mostly flat action. Currently on long term gold we have, let’s call it two big clusters on of analysis. First cluster is “certainty”. It tells that we have two patterns in progress. Frist one is monthly bearish stop grabber, that has minimum target at 1180. Second one is Volatility breakout (VOB) that suggests at least 0.618 AB-CD down. And this target is 1050$. Butterfly pattern that we see on monthly chart is not very important and just shows how this downward action could happen. 1.618 extension of Butterfly coincides with VOB 0.618 AB-CD target.
Second cluster is “uncertainty”. This pack of information rises questions. Whether market will clear 1180, how far market could move below 1180 – 1100, 1050? We can’t answer on second question yet.
Why we still think that market should clear out 1180 lows? This expectation mostly is based on gold habits and overall fundamental situation. Gold habits suggest that market almost never leaves behind significant lows. Technically current retracement seems absolutely logical and not overextended. Market just re-tested 1240 lows – and this is also one of the habit of the gold market.
Fundamentally economy data is not really bad, right now is confirmed by US companies earning reports, weak physical demand and anemic inflation – all these moments prevent gold appreciation. Fall of crude oil prices also is supporting factor for economy in long term, because household and industry will get signficant economy on energy expenses, especially on coming winter. Also we have to say that active part seasonal bullish trend will finish in December. Currently it should be mostly active, but right now we see that Asian physical demand is not enough to push market higher, when instituational investors stand flat and do not put money in gold.
Technically during recent rally market was not able to re-test Yearly Pivot. In the beginning of the year market has tested YPP and failed, then continued move down. During recent attempt to move higher – has not even reached YPP again.
So may be we should have some concern on possible end of downward action and upside reversal, but right now we just do not see any foundation and reasons for that. As we’ve said million times – we do not believe much in current rally, because it is absolutely unclear what it is based on, except may be individual demand in Asia.
That’s why somehow we still think that we will get another leg down to 1180. After that the time will come to answer on second question – whether market will break this level and how deep it will fall.
That’s being said, situation on the monthly chart does not suggest yet taking long-term long positions on gold. Fundamental picture is moderately bearish in long-term.
Recent retracement on many markets – oil, equities, gold is mostly triggered not by sentiment changing but strong oversold. Markets probably overreacted a bit under pressure of Ebola fever spreading, surprisingly bad data from China and EU, sophisticated geopolitical situation. All these factors have coincided and hit markets. Right now situation has got some relief, but on Friday gold already has turned down.
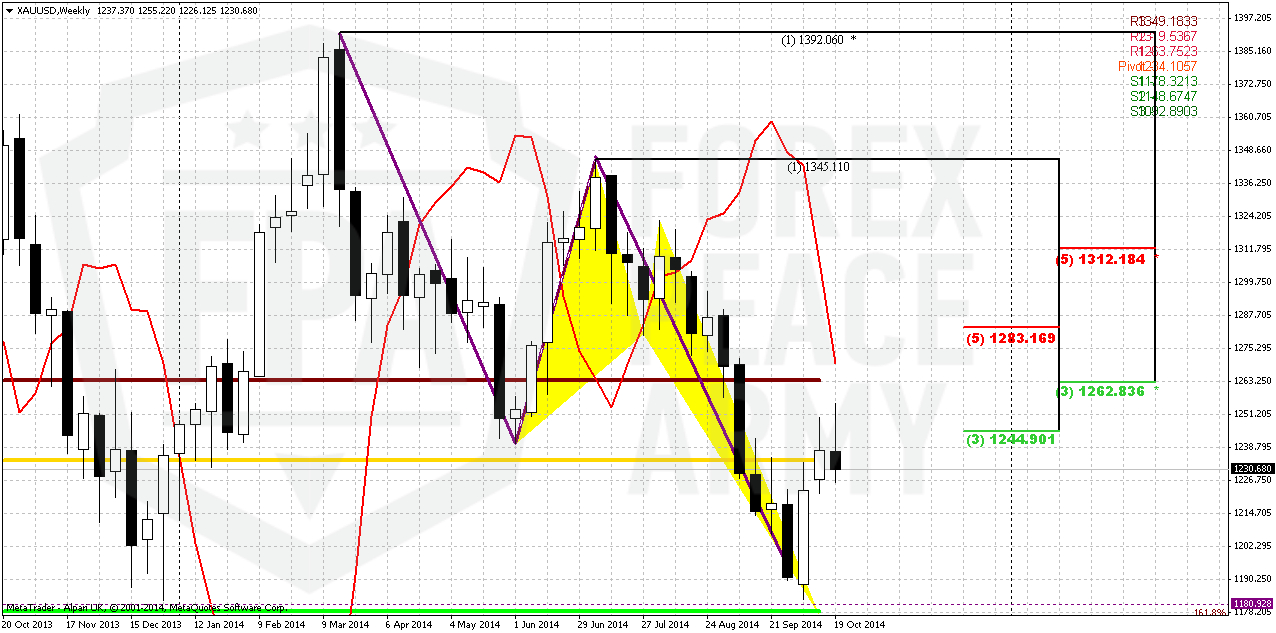
Weekly
On weekly chart market has reached strong support area that includes targets, MPS1, butterfly extension and others. As you can see gold has confirmed this level by nicely looking weekly engulfing pattern that has led to upside retracement. We suggest that even action to 1260 will not lead to breaking bearish sentiment and will not mean that downward trend is over.
Even Vice versa, as we’ve said above taking in consideration gold’s habits, we could suggest that 1180 will be reached and washed out. We suggest that current move up is some sort of bulls’ trap to involve more traders in upside action and then grab their stops either. It does not mean that you can’t trade it up, but it means that you have to take profit fast.
We also know that until MPR1 holds upside retracement – bearish trend stands valid. It means that market could show retracement even into 1260 K-resistance area and WPR1 and this will not mean that bearish trend has been broken. Somewhere around stands the target of engulfing pattern. At the same time this level simultaneously will become an indicator of breakout. Any action above MPR1 will suggest that sentiment has changed and this is not just retracement already. But currently market just has reached nearest resistance and done this not very steadily. Last week market has bounced down from resistance and closed below MPP again. Two weeks in a row candles have long upper shadows. This indicates that market has not enough power to hold above this resistance. And this seems reasonable, since we do not have any real purchases that could give gold this power.
On coming week price will approach to MACDP and we will closely look for grabber. It could come because volatility probably will increase due Fed meeting.
That’s being said, weekly chart leads us to conclusion that right now as market has some upside reserve – it is too early to treat it as reversal and shift in long-term sentiment. Still, we can’t exclude this scenario totally, as we see some shifting in CFTC data, although it is mostly anemic by far. The key to success here is to keep watching on combination of action, patterns and CFTC/SPDR data around important 1260 area.
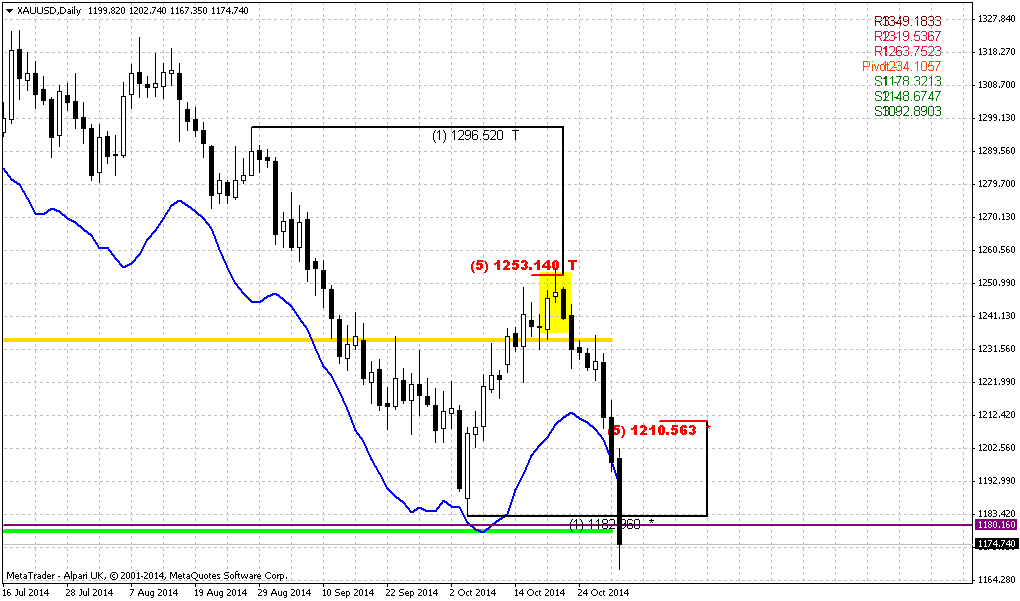
Daily
As we’ve mentioned on Friday – we’ve got evening star pattern right at daily resistance and former 1240 lows that were re-tested. Right now major question is whether market will show just retracement and then AB=CD up or this is really reversal and road to 1180. First of all, evening star pattern could lead to as first scenario as second one.
The only clue that we have here is WPS1 and daily oversold level. They stand above 1180. Hardly market will move lower immediately, and it means that for the next week we will not take into consideration 1180. Mostly our downside target will be WPS1, may be some fib support and daily oversold. This is probably maximum that gold will be able to reach, even having Fed meeting on the back.
Another pattern that could be formed within 1-2 trading sessions, and we’ve talked about it as well on Friday, is bullish grabber. It is interesting that bullish grabber here absolutely does not contradict with possible bearish one on weekly chart.
4-hour
This chart shows that harmonic retracement swing has been broken and market doubles it. In recent couple of sessions market was forming bearish flag pattern that suggests downward continuation. We do not have any tools here to estimate possible target clear, but based on flag’s mast – gold really should reach WPS1 and daily oversold.
1-hour
Speaking about action inside flag here is two scenarios are possible. As ou can see we have bullish grabber that suggests taking out of recent highs. This could lead to some AB=CD pattern that will let market to touch WPP. This will not break overall situation on 4-hour chart with flag but just postone a bit downward action.
If grabber will fail, situation could turn to butterfly pattern. 1.618 level coincides with WPS1 area.
Conclusion:
Situation on gold market remains sophisticated. Due bearish moments, such as bullish USD sentiment, lack of physical demand, gold has re-established recently downward action. On a way down market could pass through multiple target and nearest one is 1180$. We even have setup on big picture that suggests moving to 1050 area.
In short term perspective gold hardly will move to 1180 directly due WPS1 and daily oversold. That’s why on coming week we mostly will keep an eye on downward continuation to 1215-1219 area. Also we can’t exclude situation when gold still could form AB-CD retracement up. This setup could come true if we will get bullish grabber on Mon-Tue and it will not fail.
The technical portion of Sive's analysis owes a great deal to Joe DiNapoli's methods, and uses a number of Joe's proprietary indicators. Please note that Sive's analysis is his own view of the market and is not endorsed by Joe DiNapoli or any related companies.