Sive Morten
Special Consultant to the FPA
- Messages
- 18,673
Fundamentals
By Reuters news gold inched up slightly on Friday as disappointing U.S. economic data reinforced expectations that the U.S. Federal Reserve will keep its stimulus intact well into 2014. Bullion was headed for a 1.7 percent gain on the week, having hit four-week highs on Thursday as it benefited from weaker-than-expected U.S. non-farm payrolls data earlier in the week. The jobs data bolstered expectations the Fed will not start to rein its stimulus program until well into next year. "Things are sluggishly moving here," said Thomas Capalbo, a precious metals broker at New York futures brokerage New Edge, following weaker-than-expected consumer confidence and durable goods data on Friday morning. "There's no real indication that things are getting much better, and no indication saying that we are going to see tapering soon, so that's going to be beneficial for gold and probably silver too."
"The recent upward trend in gold and its volatile reaction to the most recent economic release show the market is still heavily data-dependent for price direction," HSBC said in a note.
As a gauge of investor sentiment, holdings in the world's largest gold-backed exchange-traded fund, New York's SPDR Gold Shares, fell 0.2 percent or 1.8 tonnes on Thursday. An outflow of more than 10 tonnes occurred on Monday followed by an increase of six tonnes on Tuesday.
The gain in spot prices has further deterred physical demand in most Asian countries.
Premiums on the Shanghai Gold Exchange fell to multi-month lows of $2 an ounce on Friday. That compares with highs of $30 in April-May. However, in India, premiums were at a record high of $120 an ounce as dealers struggled to meet demand amid tight supplies. "The sense is that premiums are elevated and are expected to rise further ... and the expectation is that they (stocks) are likely to run out completely around November," UBS said.
So, as you can see guys, not much really new since NFP release. Anything now is twisting and turning around data and FOMC meeting on next week. I do not know, but I somehow feel that negative reaction on weak NFP is too strong. In fact data was not as bad as reaction has followed. Actually we’ve got precise number of jobs that was forecasted. Yes, we’ve got 40K less in September, but we’ve got upward August revision for the same 40K. What’s the problem? And I suspect that probability of rhetoric changing in favor of QE tapering is not as shy as many people would like it to be. Surely we will take a look at Retail sales, CPI and mostly on GDP, but NFP itself is not bad…
On current week, we finally, have got CFTC report after shut down, almost whole month later. Chart is not easy to understand right now. Still net long position has decreased for 30K within a month, simultaneously with decreasing of Open Interest. This could mean either indecision, when traders reduce positions and this fact has no relation to market sentiment, or current trend up is not totally supported and stands fragile.
That’s being said current fundamental picture does significantly clarify situation on the market, and probably, indeed, some more transparency should come on 30th of October.
Monthly
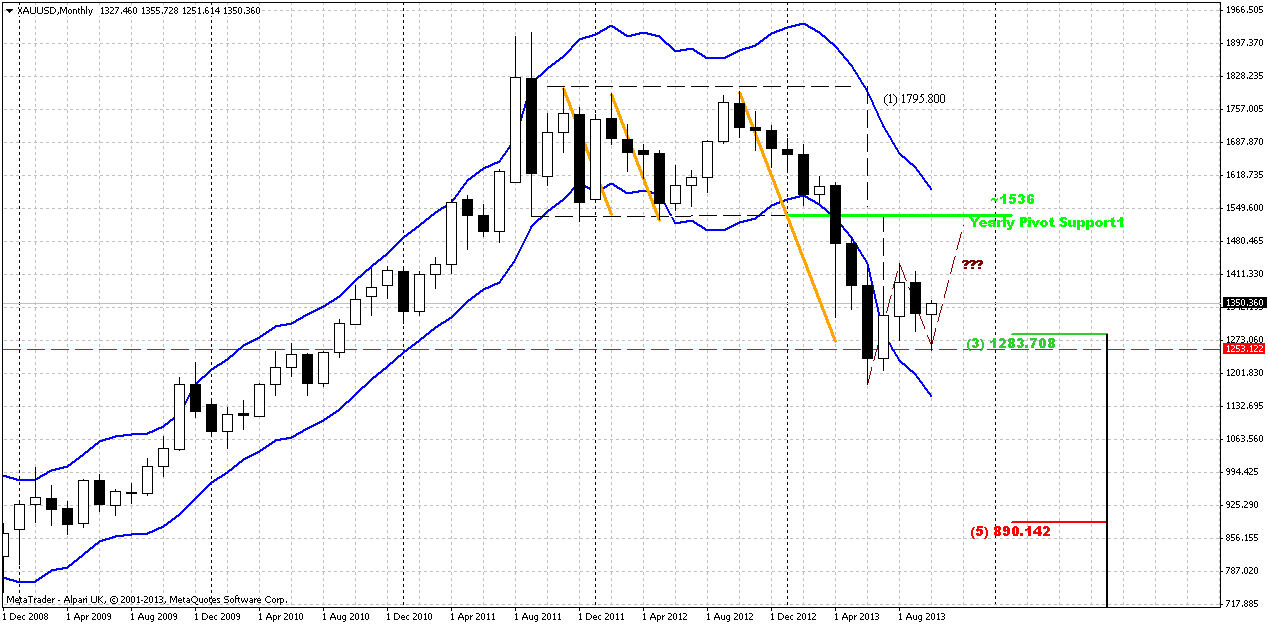
As you remember our major concern on monthly chart is about possible pattern. What current move up will be – either still AB=CD up or downward continuation? It is still difficult to make any forecasts, but I have to note that current October candle now looks better than on previous week and more in a row with possible upward move. But still, despite on rally and taking into consideration recent CFTC data, situation still unclear.
As you know our previous analysis (recall volatility breakout - VOB) suggests upward retracement. As market has significantly hit oversold we’ve suggested that retracement up should be solid, may be not right to overbought, but still significant. Take a look at previous bounces out from oversold – everytime retracement was significant. Thus, we’ve made an assumption of possible deeper upward retracement that could take a shape of AB=CD, and invalidation for this setup is previous lows around 1170s. If market will pass through it, then, obviously we will not see any AB=CD up.
So, as a conclusion on monthly chart we can say, that we have reasons to suggest some more upward action due strong oversold and some other moments and currently october candle looks better from this point of view. But having a lot data ahead anything could change fast.
Weekly
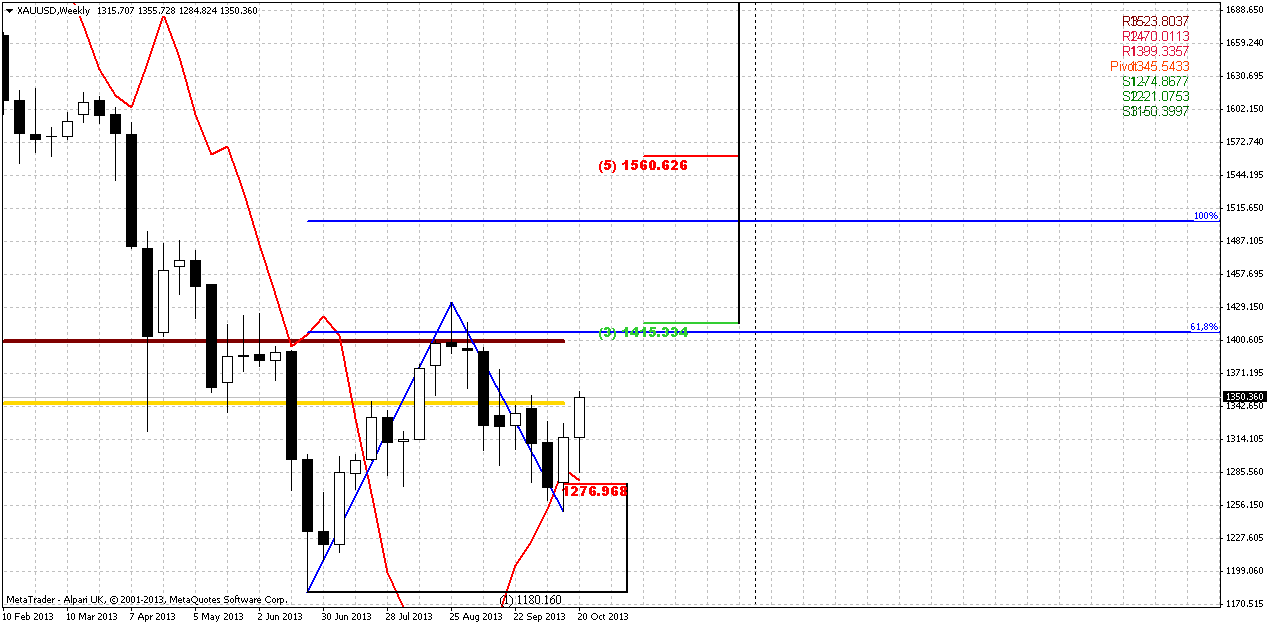
This chart is not as useful as it was on previous week. Price has hit our minimum target round MPP and also reached grabber’s minimum target. This is absolutely does not mean that market has no chances to continue move up, but if we would like to take long position, we need something more valuable that could assure us with this continuation, and now I see nothing except bullish trend and moment that price stands above MPP.
At the same time we can’t take short position here, since trend is bullish and we do not have any bearish directional patterns. If we assume that we’re right and sentiment is bullish, then next target stands at 1400-1410 – MPR1, AB-CD minor extension target and major 3/8 Fib resistance at 1415. So, as conclusion of weekly chart analysis we can say that trend here is bullish with invalidation point around 1250 lows and until they will hold we can focus on searching possibility for long entry, if we will not find something contrary on lower time frames.
Daily
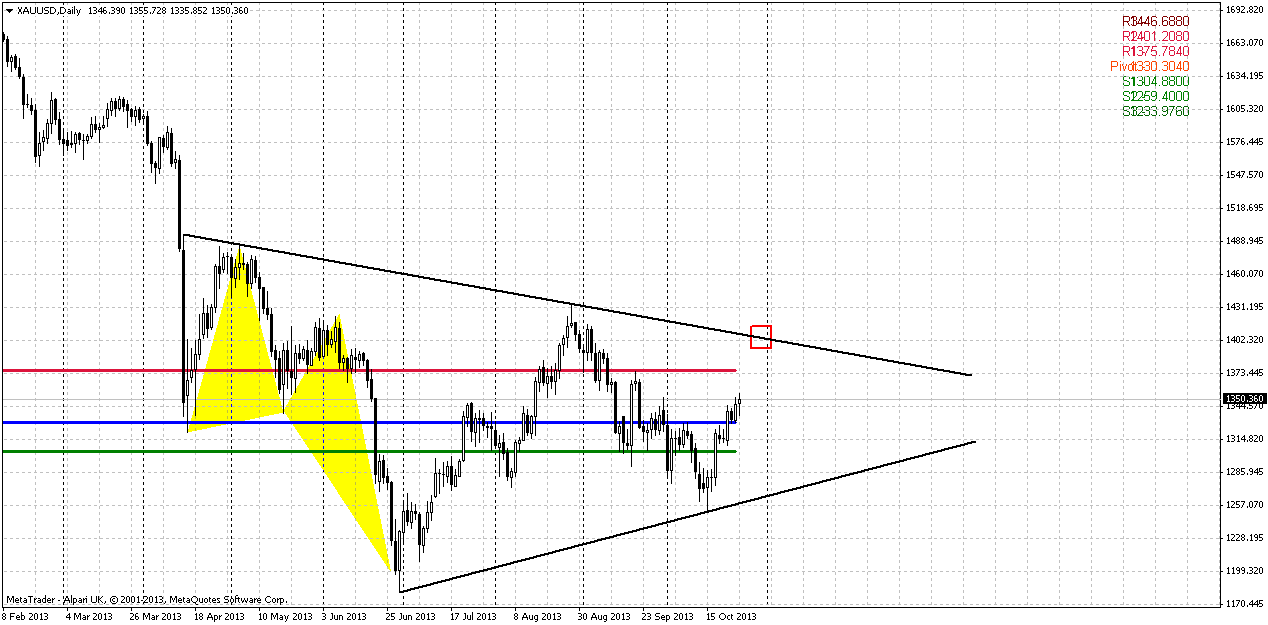
As clear directional patterns have been worked out, daily chart now creates more riddles than solutions. Here is what I mean. In short term perspective situation is bullish – trend is up and market is not at overbought. Price has closed above MPP. First pattern that we could find on picture below is possible reverse H&S with butterfly “buy” as a left shoulder. Why I think on H&S either is because of butterfly. Very often butterflies become a part particularly of H&S pattern.
But now we’re moving to most interesting. We could get either symmetrical triangle and it will look like pennant on monthly chart. This is continuation pattern. And even more – we could get weekly butterfly “buy”. Probably now you can recognize it – the left wing is based on head of H&S pattern. If this indeed will be butterfly, then 1.618 target will stand around 1000$. At the same time, if even market will continue to our 1400, it will not erase this possibility, because initial swing of big butterfly will remain intact. By these thoughts I come to following conclusions. We have to be extra careful with taking longs now, because right wing of butterfly could start at any resistance – WPR1, our 1400 area or even earlier. That’s why if we would take long position, it has to be based on some clear pattern on lower time frame. We can’t enter short yet, since we do not have reasons to do it right now.
Second moment, why I’m a bit worry about upward action – it reminds me retracement. It’s too choppy to call it as impulse move up. We do not see any solid white upward candles as we’ve seen on the way down. That’s why, may be it short-term scale we have real bullish context, it is not as stable in a bit longer perspective. Unfortunately we do not have clear patterns on daily and will have to wait when they will appear, before taking any position.
4-hour
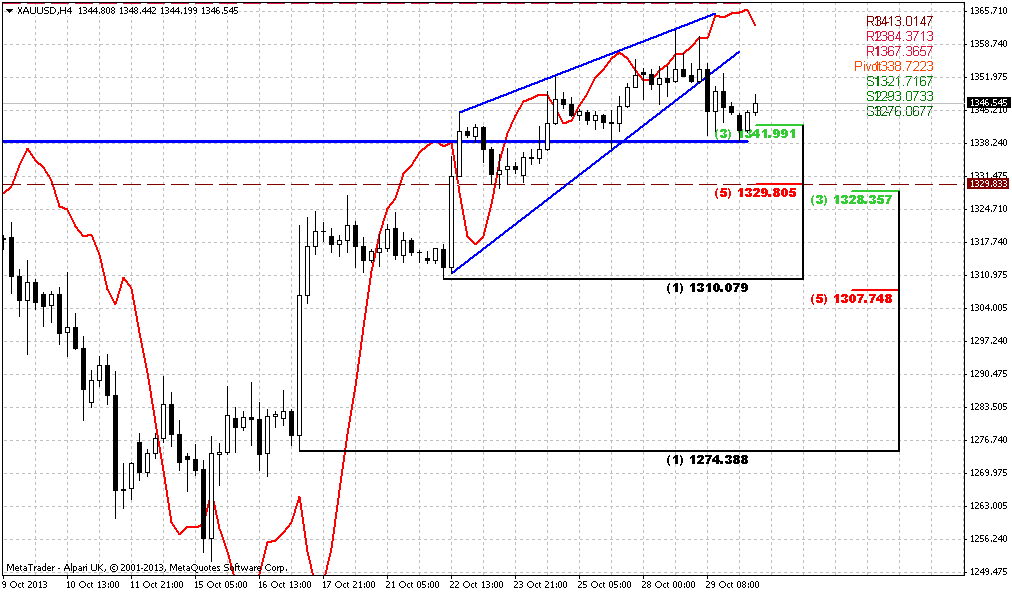
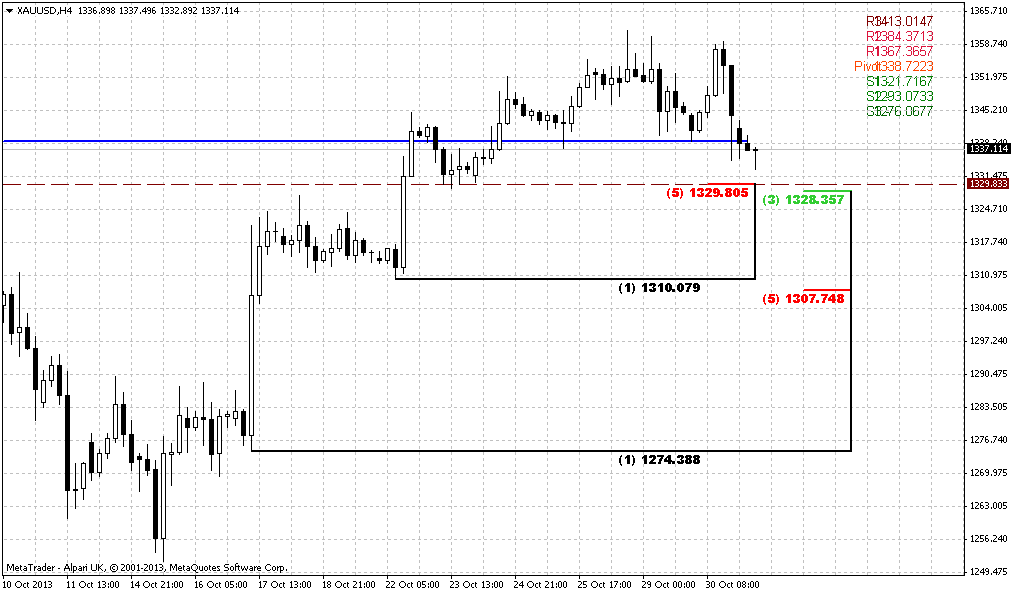
Here we have only short-term tactical issues, as well. Some signs of market’s exhausting. Action up takes the shape of wedge and if you will apply extensions, you’ll see that we probably could even qualify it as 3-Drive sell. Minimum move up should be below 1335 level. The same signal we have by stop grabber that was formed on Friday. Thus, minimum move down probably will reach 1324-1327 K-support and WPP. Also this level coincides with natural level and previous tops.
Conclusion:
CFTC data shows that probably many investors have decided to reduce positions at the eve of important data and FOMC meeting. May be due this reason or may be by some other one, but we do not have any setup that could let us to create more or less extended trading plan for the week. Unfortunately all that we have by far is just a tactical issue that suggests move down to 1325-1330 area. So, guys, decide by yourself, whether you will deal with gold market till 30th of October or not…
The technical portion of Sive's analysis owes a great deal to Joe DiNapoli's methods, and uses a number of Joe's proprietary indicators. Please note that Sive's analysis is his own view of the market and is not endorsed by Joe DiNapoli or any related companies.
By Reuters news gold inched up slightly on Friday as disappointing U.S. economic data reinforced expectations that the U.S. Federal Reserve will keep its stimulus intact well into 2014. Bullion was headed for a 1.7 percent gain on the week, having hit four-week highs on Thursday as it benefited from weaker-than-expected U.S. non-farm payrolls data earlier in the week. The jobs data bolstered expectations the Fed will not start to rein its stimulus program until well into next year. "Things are sluggishly moving here," said Thomas Capalbo, a precious metals broker at New York futures brokerage New Edge, following weaker-than-expected consumer confidence and durable goods data on Friday morning. "There's no real indication that things are getting much better, and no indication saying that we are going to see tapering soon, so that's going to be beneficial for gold and probably silver too."
"The recent upward trend in gold and its volatile reaction to the most recent economic release show the market is still heavily data-dependent for price direction," HSBC said in a note.
As a gauge of investor sentiment, holdings in the world's largest gold-backed exchange-traded fund, New York's SPDR Gold Shares, fell 0.2 percent or 1.8 tonnes on Thursday. An outflow of more than 10 tonnes occurred on Monday followed by an increase of six tonnes on Tuesday.
The gain in spot prices has further deterred physical demand in most Asian countries.
Premiums on the Shanghai Gold Exchange fell to multi-month lows of $2 an ounce on Friday. That compares with highs of $30 in April-May. However, in India, premiums were at a record high of $120 an ounce as dealers struggled to meet demand amid tight supplies. "The sense is that premiums are elevated and are expected to rise further ... and the expectation is that they (stocks) are likely to run out completely around November," UBS said.
So, as you can see guys, not much really new since NFP release. Anything now is twisting and turning around data and FOMC meeting on next week. I do not know, but I somehow feel that negative reaction on weak NFP is too strong. In fact data was not as bad as reaction has followed. Actually we’ve got precise number of jobs that was forecasted. Yes, we’ve got 40K less in September, but we’ve got upward August revision for the same 40K. What’s the problem? And I suspect that probability of rhetoric changing in favor of QE tapering is not as shy as many people would like it to be. Surely we will take a look at Retail sales, CPI and mostly on GDP, but NFP itself is not bad…
On current week, we finally, have got CFTC report after shut down, almost whole month later. Chart is not easy to understand right now. Still net long position has decreased for 30K within a month, simultaneously with decreasing of Open Interest. This could mean either indecision, when traders reduce positions and this fact has no relation to market sentiment, or current trend up is not totally supported and stands fragile.
That’s being said current fundamental picture does significantly clarify situation on the market, and probably, indeed, some more transparency should come on 30th of October.
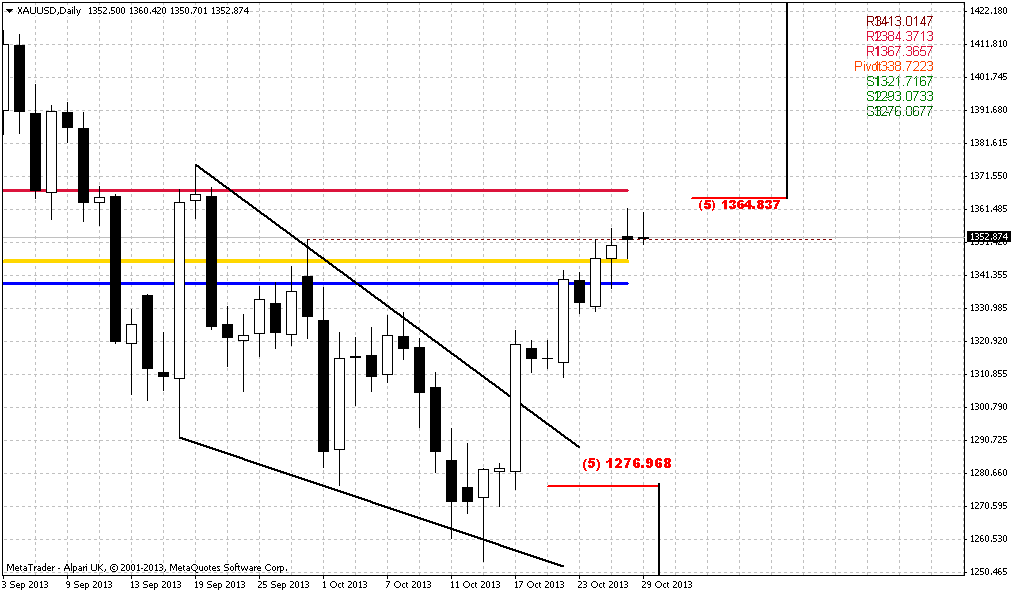
Monthly
As you remember our major concern on monthly chart is about possible pattern. What current move up will be – either still AB=CD up or downward continuation? It is still difficult to make any forecasts, but I have to note that current October candle now looks better than on previous week and more in a row with possible upward move. But still, despite on rally and taking into consideration recent CFTC data, situation still unclear.
As you know our previous analysis (recall volatility breakout - VOB) suggests upward retracement. As market has significantly hit oversold we’ve suggested that retracement up should be solid, may be not right to overbought, but still significant. Take a look at previous bounces out from oversold – everytime retracement was significant. Thus, we’ve made an assumption of possible deeper upward retracement that could take a shape of AB=CD, and invalidation for this setup is previous lows around 1170s. If market will pass through it, then, obviously we will not see any AB=CD up.
So, as a conclusion on monthly chart we can say, that we have reasons to suggest some more upward action due strong oversold and some other moments and currently october candle looks better from this point of view. But having a lot data ahead anything could change fast.
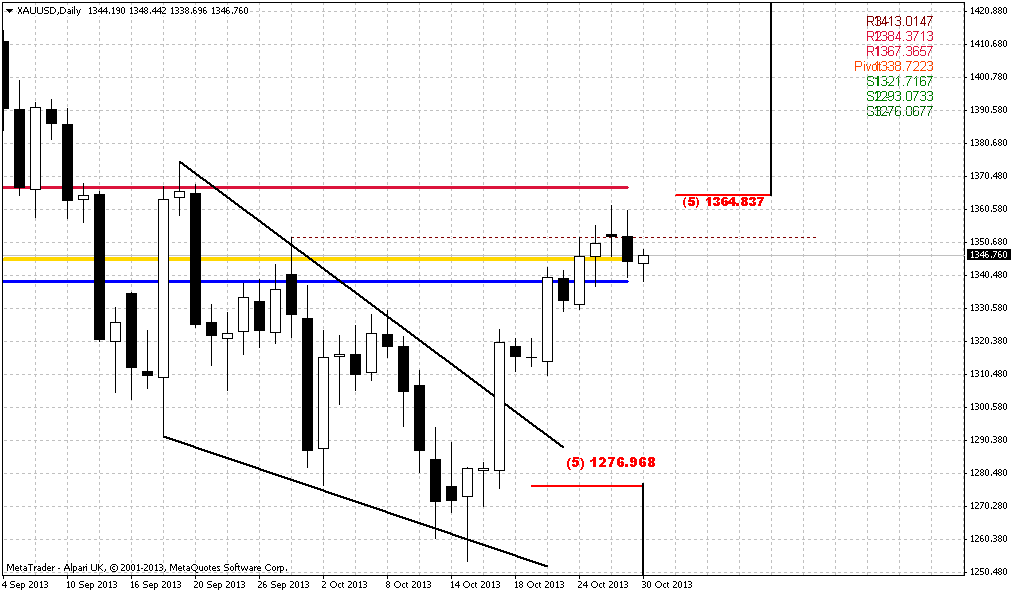
Weekly
This chart is not as useful as it was on previous week. Price has hit our minimum target round MPP and also reached grabber’s minimum target. This is absolutely does not mean that market has no chances to continue move up, but if we would like to take long position, we need something more valuable that could assure us with this continuation, and now I see nothing except bullish trend and moment that price stands above MPP.
At the same time we can’t take short position here, since trend is bullish and we do not have any bearish directional patterns. If we assume that we’re right and sentiment is bullish, then next target stands at 1400-1410 – MPR1, AB-CD minor extension target and major 3/8 Fib resistance at 1415. So, as conclusion of weekly chart analysis we can say that trend here is bullish with invalidation point around 1250 lows and until they will hold we can focus on searching possibility for long entry, if we will not find something contrary on lower time frames.
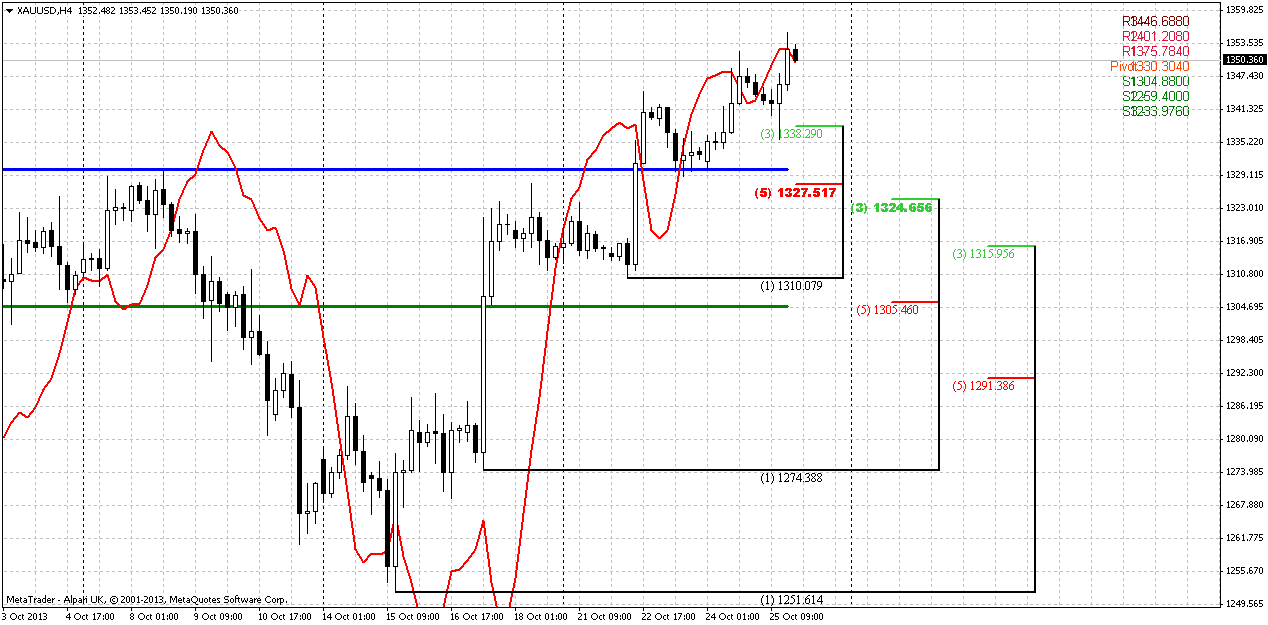
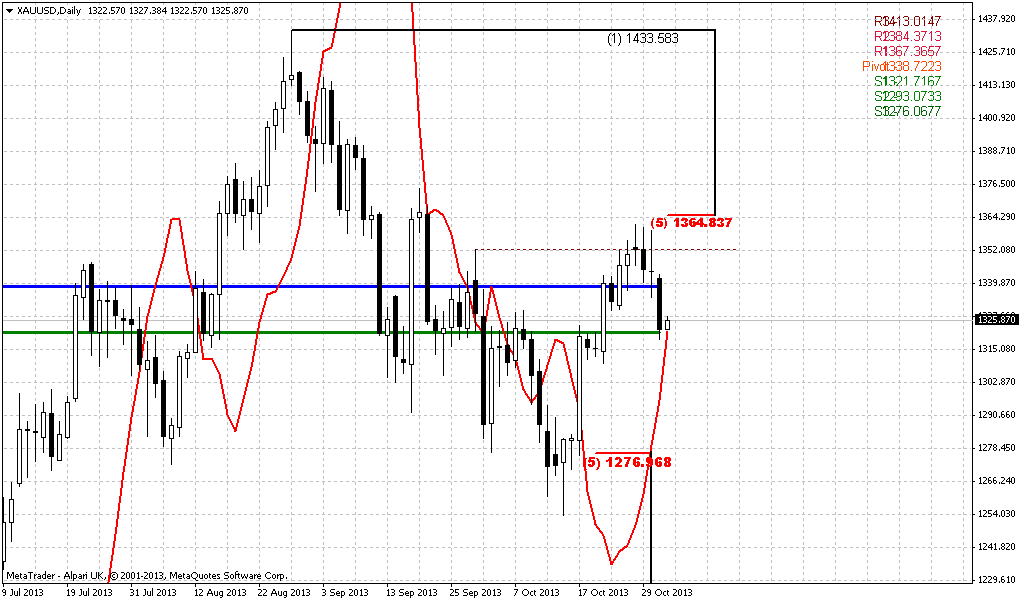
Daily
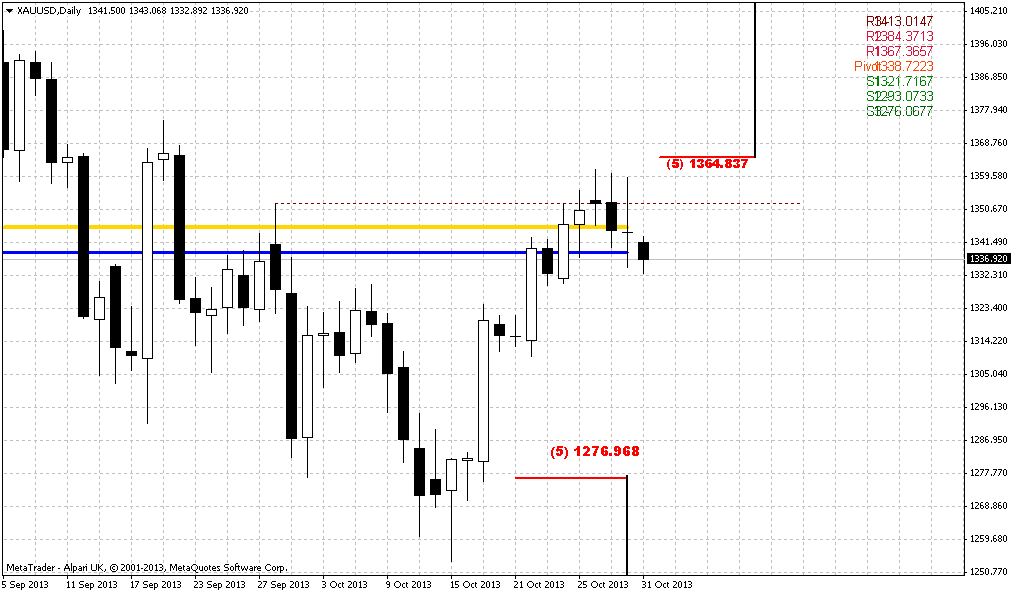
As clear directional patterns have been worked out, daily chart now creates more riddles than solutions. Here is what I mean. In short term perspective situation is bullish – trend is up and market is not at overbought. Price has closed above MPP. First pattern that we could find on picture below is possible reverse H&S with butterfly “buy” as a left shoulder. Why I think on H&S either is because of butterfly. Very often butterflies become a part particularly of H&S pattern.
But now we’re moving to most interesting. We could get either symmetrical triangle and it will look like pennant on monthly chart. This is continuation pattern. And even more – we could get weekly butterfly “buy”. Probably now you can recognize it – the left wing is based on head of H&S pattern. If this indeed will be butterfly, then 1.618 target will stand around 1000$. At the same time, if even market will continue to our 1400, it will not erase this possibility, because initial swing of big butterfly will remain intact. By these thoughts I come to following conclusions. We have to be extra careful with taking longs now, because right wing of butterfly could start at any resistance – WPR1, our 1400 area or even earlier. That’s why if we would take long position, it has to be based on some clear pattern on lower time frame. We can’t enter short yet, since we do not have reasons to do it right now.
Second moment, why I’m a bit worry about upward action – it reminds me retracement. It’s too choppy to call it as impulse move up. We do not see any solid white upward candles as we’ve seen on the way down. That’s why, may be it short-term scale we have real bullish context, it is not as stable in a bit longer perspective. Unfortunately we do not have clear patterns on daily and will have to wait when they will appear, before taking any position.
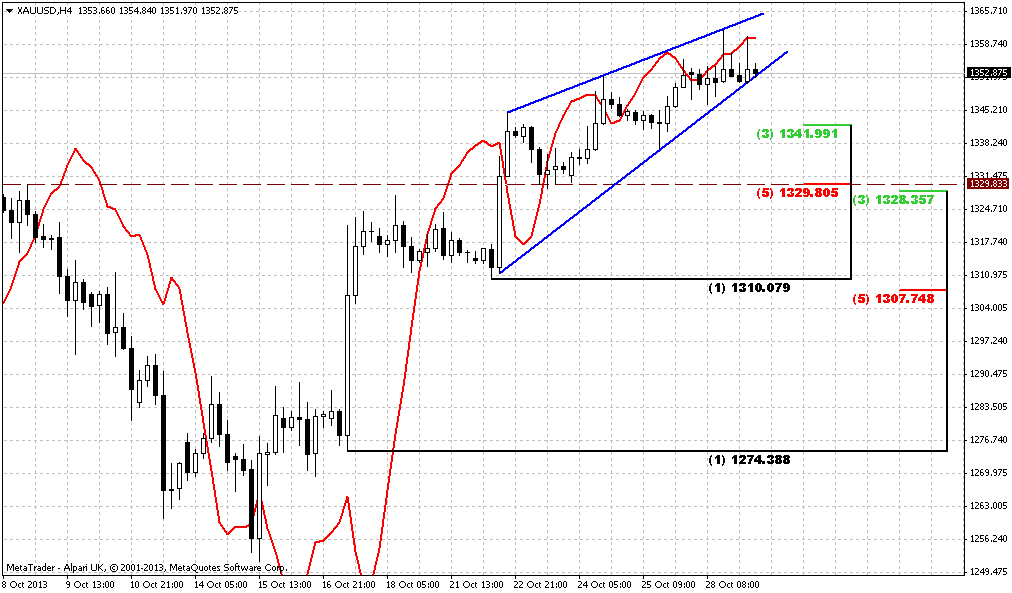
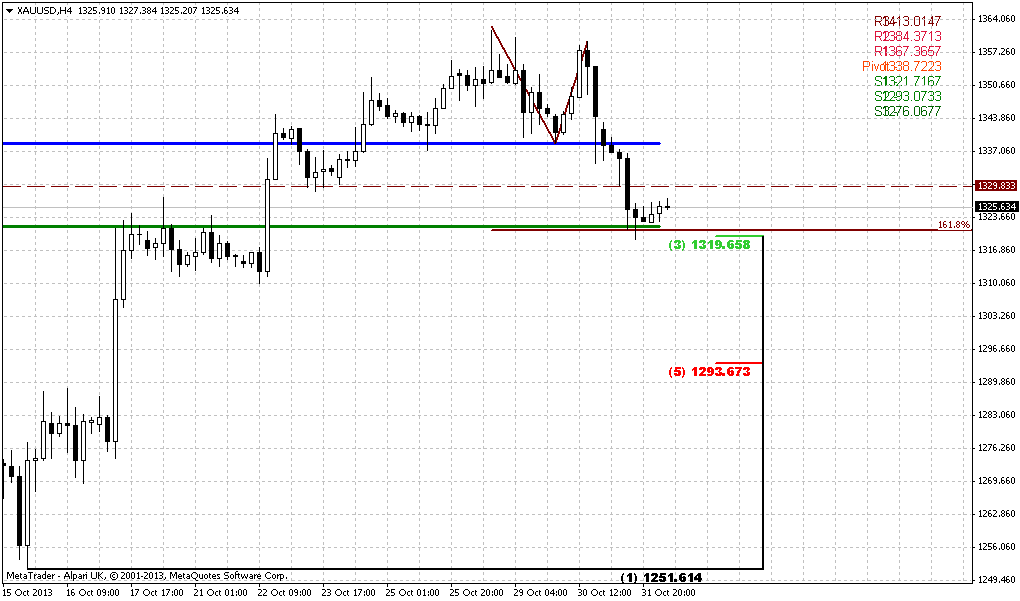
4-hour
Here we have only short-term tactical issues, as well. Some signs of market’s exhausting. Action up takes the shape of wedge and if you will apply extensions, you’ll see that we probably could even qualify it as 3-Drive sell. Minimum move up should be below 1335 level. The same signal we have by stop grabber that was formed on Friday. Thus, minimum move down probably will reach 1324-1327 K-support and WPP. Also this level coincides with natural level and previous tops.
Conclusion:
CFTC data shows that probably many investors have decided to reduce positions at the eve of important data and FOMC meeting. May be due this reason or may be by some other one, but we do not have any setup that could let us to create more or less extended trading plan for the week. Unfortunately all that we have by far is just a tactical issue that suggests move down to 1325-1330 area. So, guys, decide by yourself, whether you will deal with gold market till 30th of October or not…
The technical portion of Sive's analysis owes a great deal to Joe DiNapoli's methods, and uses a number of Joe's proprietary indicators. Please note that Sive's analysis is his own view of the market and is not endorsed by Joe DiNapoli or any related companies.

") with the highs and lows.
with the highs and lows.