Sive Morten
Special Consultant to the FPA
- Messages
- 18,673
Fundamentals
Nothing really drastical has happened since Friday, thus our fundamental part of comments will be short. In general we’ve placed daily news and rumors updates so and cover fundamental picture well. One thing that we want to do right here is to take a look at recent CFTC data. Currently it seems very important. If you remember from technical point of view we still had some concerns on possible upward action, because technical picture does not exclude this possibility yet.
Thus, CFTC data shows that in reality there are not many chances on this possible upward bounce. We do not know what will happen in geopolitical tensions because EU still wants to start some more sanctions within next week, while D. Cameron wants to cut Russia off from SWIFT banking system. But we do not know what particularly will happen.
Focusing only on financial situation due CFTC recent report shows very important issue – Open Interest has shown solid plunge down that means contraction of position on gold market. Simultaneously Net long position also has shown solid drop. Combining these two moments we can come to conclusion that traders close long positions and it means that they do not believe much in soon growth on gold market. Hence we have to be extra careful with any bullish technical picture that could appear on gold market on daily and higher time frames.
SPDR fund storage was flat on current week at 795 tonnes, but in general has decreased for 5 tonnes in August and returned to level of July. Still we have to acknowledge that this is not big volatility for the fund.
 Monthly
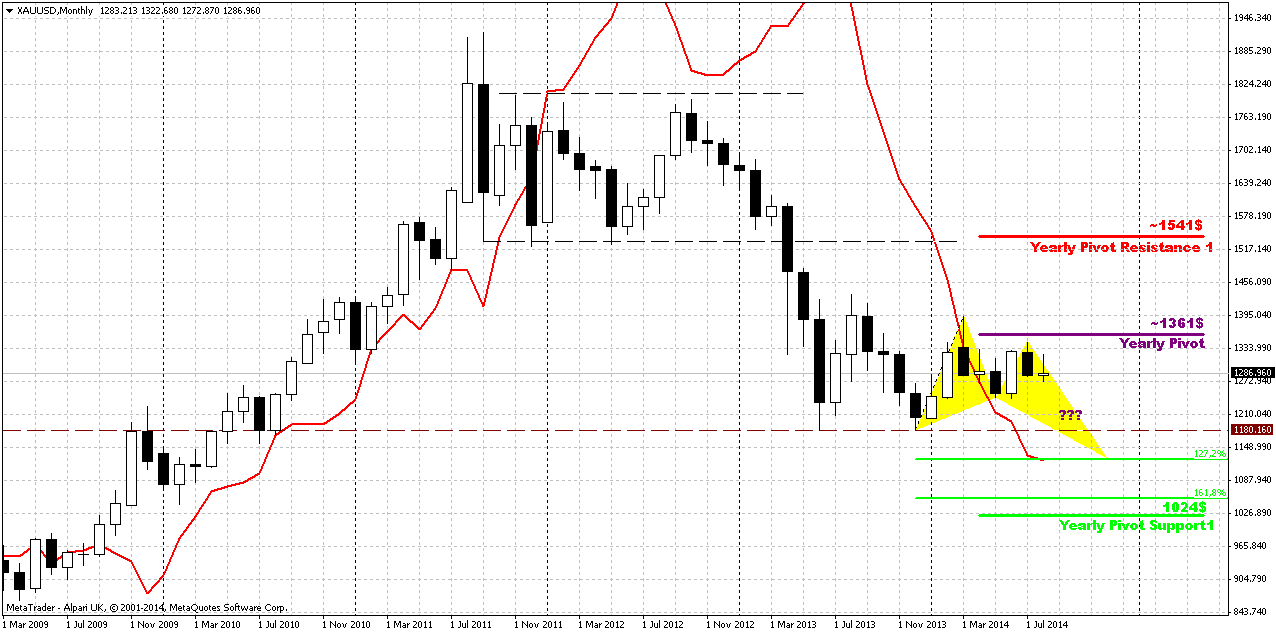
On recent week market has closed almost at the same price as week before and thus previous week has limited impact on monthly chart.
As we’ve mentioned previously price should pass solid distance to change situation drastically. it could change only if market will move above 1400 area. Recent rally that has started in July seems exhausted and looses pace fast. Even coming shift in seasonal trend does not fascinate traders much. Physical demand stands weak, dollar strong, inflation weak and talks around rate hiking also does not add optimism to gold.
Since currently August mostly is an inside month for July our former analysis is still working. Although investors have not got hawkish hints from Fed and recent NFP data was slightly lower than analysts poll, major factors are still valid - good economy data, that right now is confirmed by US companies earning reports, weak physical demand – all these moments prevent gold appreciation. Recent comments from spot gold traders and CFTC data put more questions rather then answers on degree of support gold by seasonal trend and geopolitical tensions. Technically gold still stands at very important level that at least theoretically could keep chances on upward rebound. If price will fail here – we probably will start to talk about bear trend again. Tendency could take shape of butterfly as I’ve drawn on the chart, especially because it agrees with bearish grabber target.
It is interesting that during recent rally market was not able to re-test Yearly Pivot and later has vanished our bullish weekly grabbers. This moments make difficult to count on upward reversal. Also we suspect that we could get bearish dynamic pressure here. As you can see trend has turned bullish, but gold does not show any upward action. Splash in July has faded fast. Mostly this pattern will depend on action in September-October. Thus, any solid plunge down here and taking 1240 lows will confirm it. In this case butterfly will become a reality. Finally, overall action since the beginning of the year mostly bearish. Take a look – in the beginning of the year market has tested YPP and failed, then continued move down. During recent attempt to move higher – has not even reached YPP again.
That’s being said, situation on the monthly chart does not suggest yet taking long-term positions on gold. Still, fundamental picture is moderately bearish in long-term. Possible sanctions from EU and US could hurt their own economies as well, especially EU. Many analysts already have started to talk about it. It means that economies will start to loose upside momentum and inflation will remain anemic. In such situations investors mostly invest in interest-bear assets, such as bonds. Approximately the same comments we saw for recent 1-2 months from physical gold traders.
Weekly
Recent week was inside one and does not care a lot of information. Although theoretical chances on upward action still exist as we’ve said this above and I even put this butterfly on chart, but, to be honest, guys, recent action brings more and more bearish signs.
Let’s follow through recent action:
Upward move from 1240 to 1340 was really nice. This has let reasons to speak about possible break on gold market. At the same time as we’ve mentioned many times – growth mostly was based on geopolitical reasons and had no support from real purchases.
When retracement has started and market has formed three in row bullish grabbers - that was normal - reasonable retracement out from 1333 Fib resistance. Bu later as you can see situation drastically has changed. Bullish trend, price above MPP and three in a row bullish grabbers has shifted to bearish trend, price has closed below MPP and grabbers were vanished.
On passed week, although it was rather small – price again has closed below MPP, CFTC data declares massive closing of longs and bounce up from 1270 mostly reminds some fake rather than real bullish challenge.
Gathering all this stuff together we come to conclusion that market has small chances to hold above 1270 and we should be ready for action to 1240 lows.
On previous week we mostly have spoken on 1270 level as important. Recent action and market mechanics significantly diminished importance of this level. Recent price behavior points on inability of the market jump out from this support.
For weekly chart crucial level will be 1240. Breaking through it will lead to solid consequences, such as – moving below MPS1, erasing of butterfly and solid confirmation of possible downward AB=CD pattern and in perspective monthly butterfly.
Following strictly to DiNapoli method we should search possibility to take short position, because we do not have bullish directional patterns here and trend as on monthly as on weekly stands bearish.
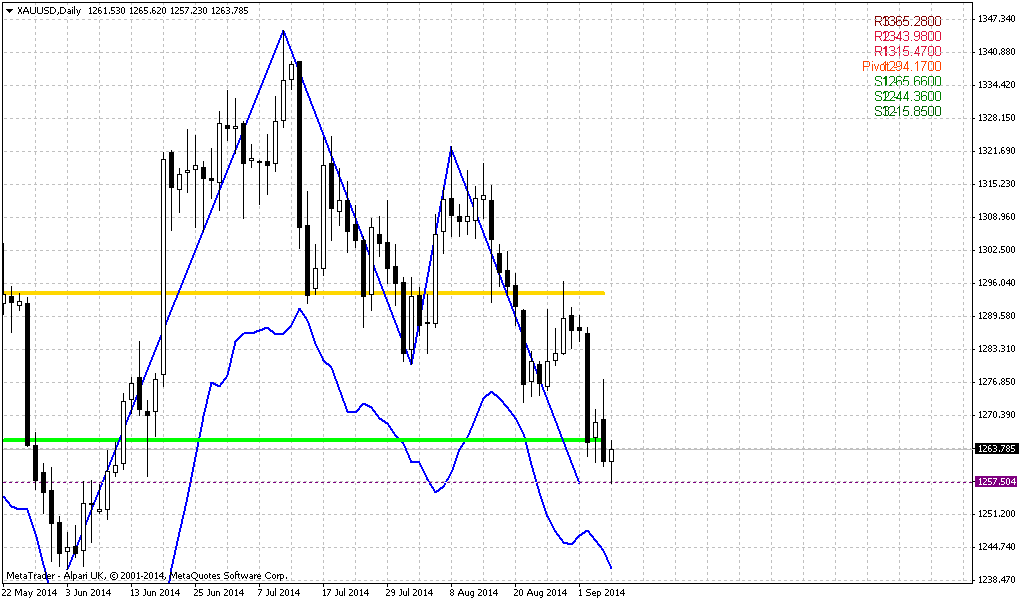
Daily
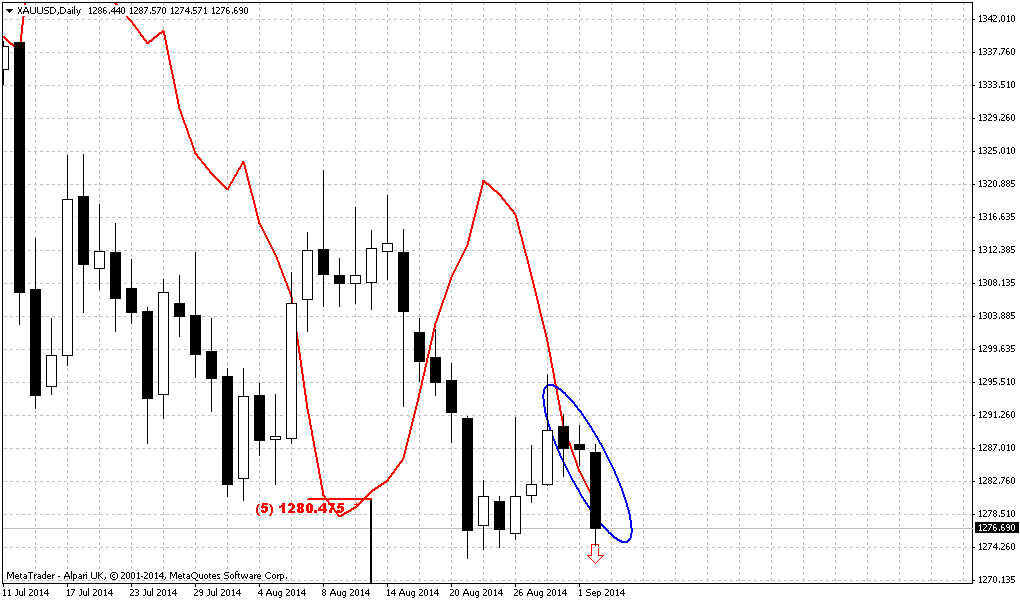
Daily trend holds bearish. Here we also can see how heavy market was with its attempts to bounce from 1270 Fib support level. Recent action looks more like bearish flag than upward reversal action.
Meantime here we need to recall our Friday’s conversation. In daily update we said – watch for possible grabber. It could give final confirmation of gold’s inability to hold on 1270 and will open road to downward action. This is our pattern and it has been confirmed. Now we have daily bearish grabber. It minimum target 1273 lows, invalidation point – top of grabber ~1291.50
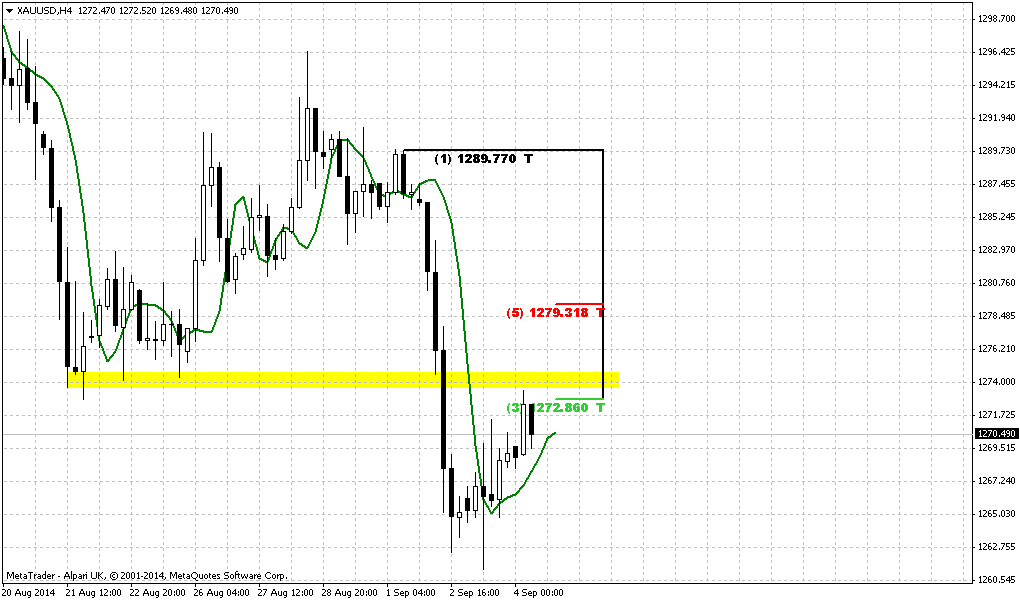
4-hour
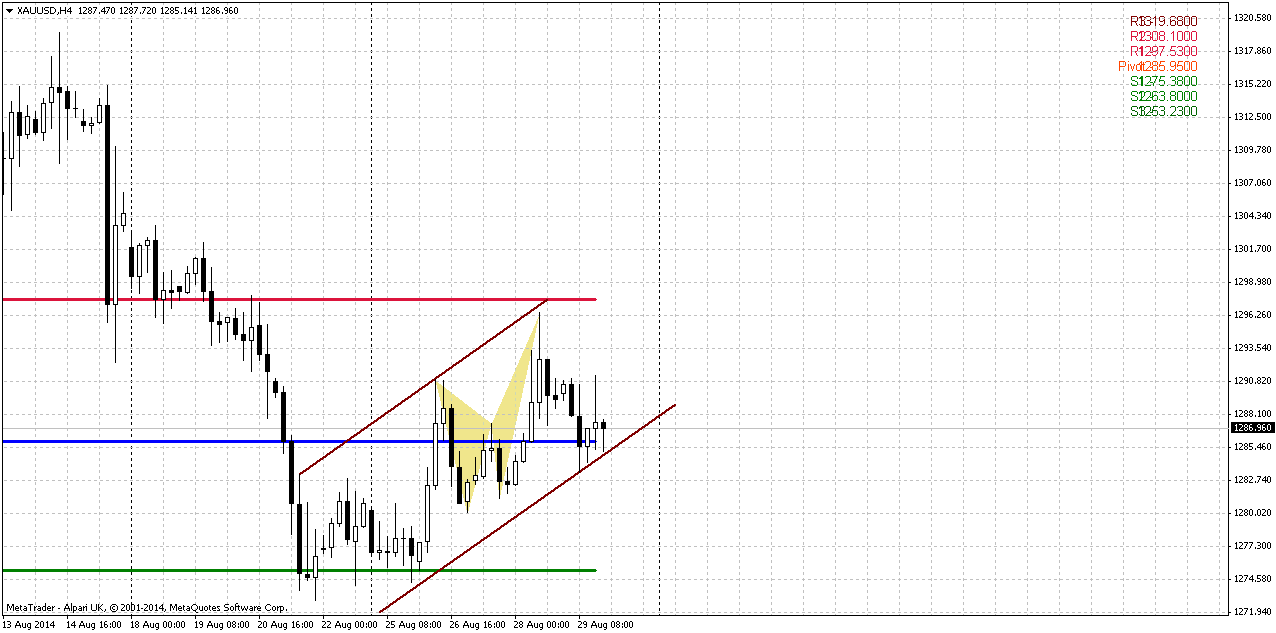
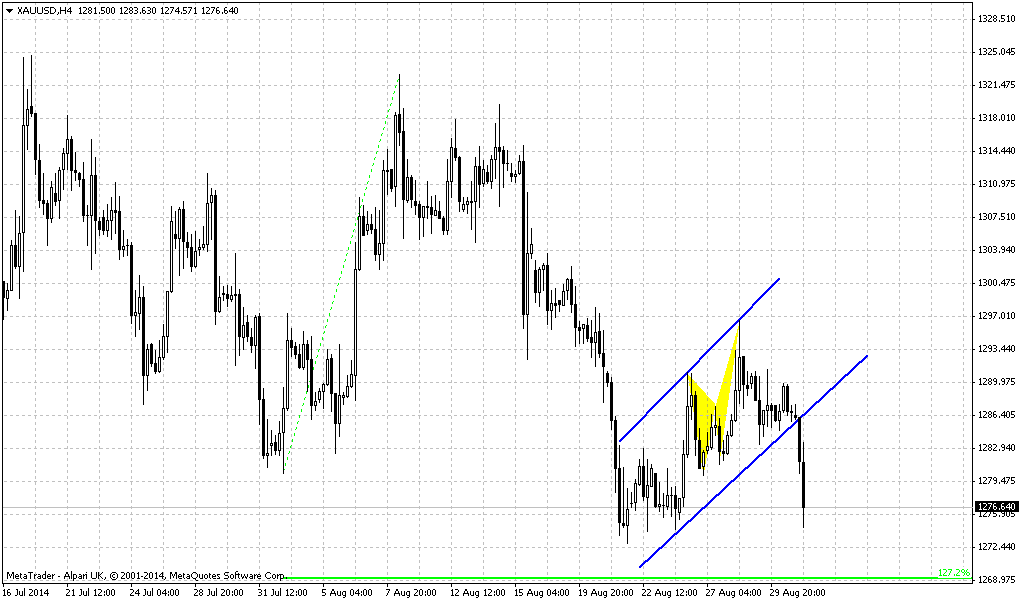
Trend here is bearish as well. Here is our flag pattern. Since market has formed butterfly inside the flag and even completed AB=CD – this also could be treated as “222” Sell pattern here. Market should open somewhere around WPP on next week. Market action itself does not remind thrusting impluse action. It mostly looks like retracement. Based on daily grabber – we’re mostly interested in recent swing down as body of the grabber.
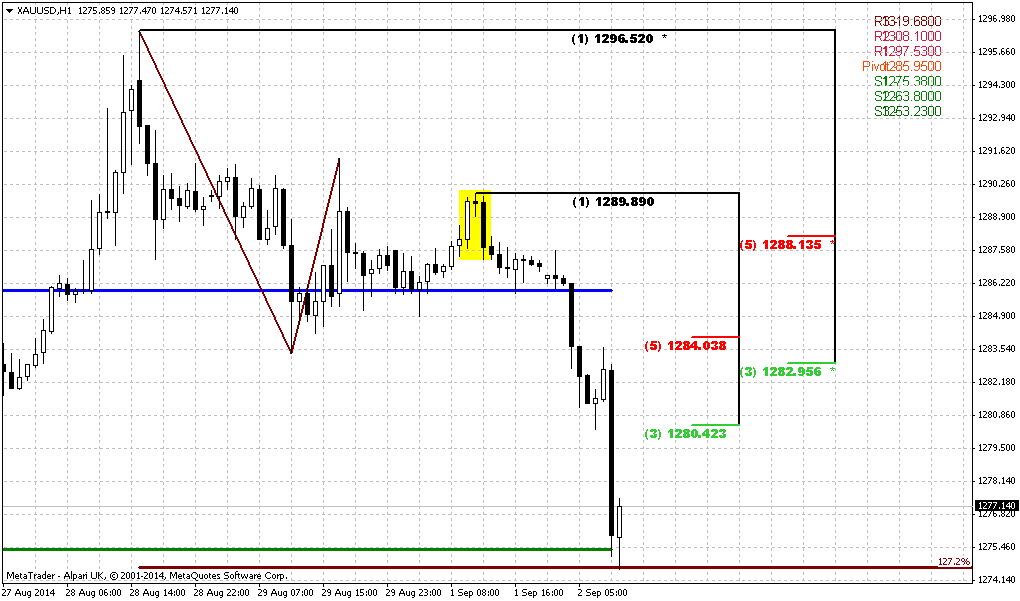
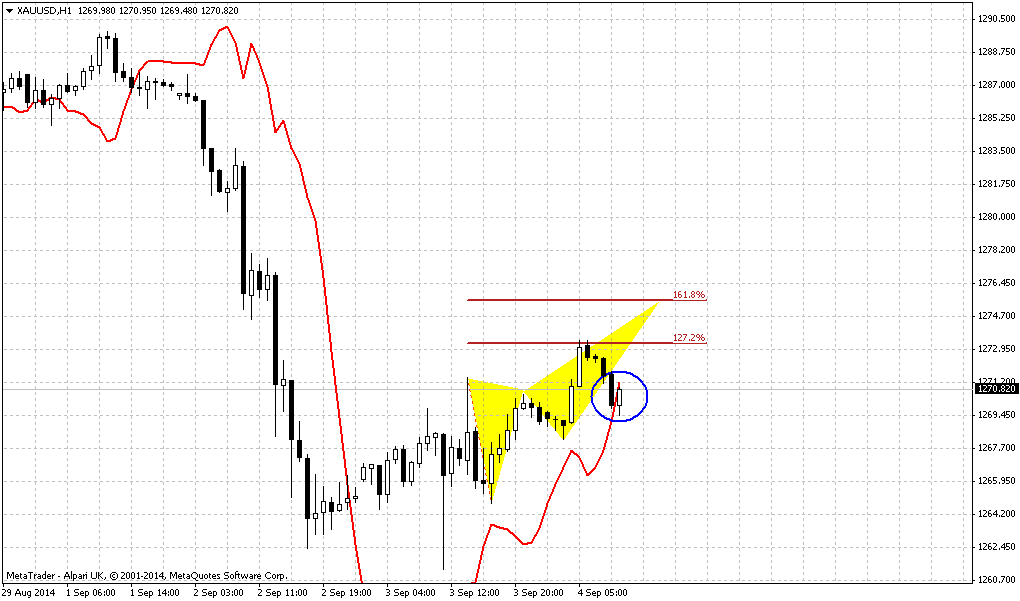
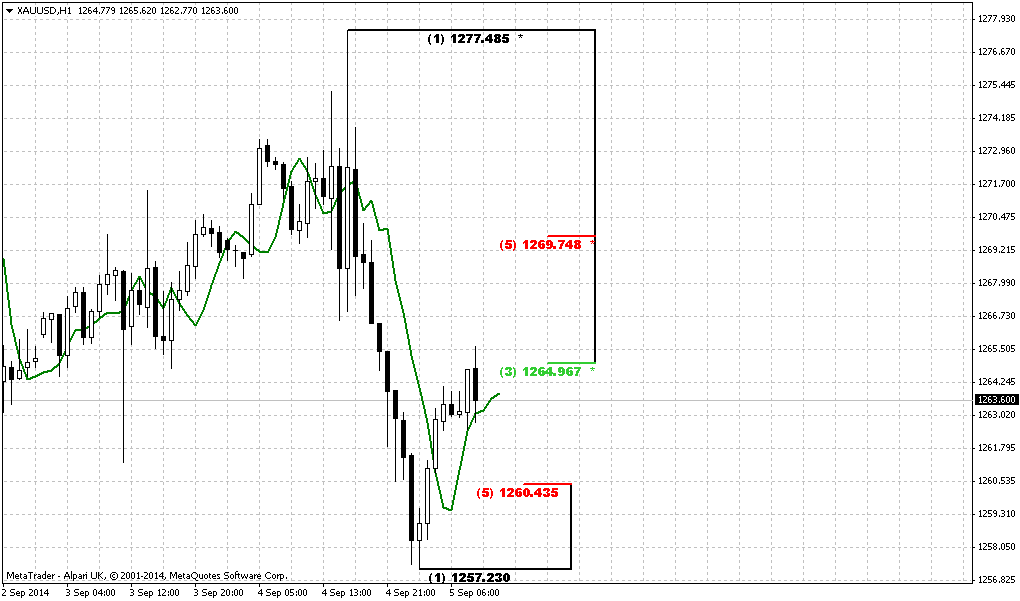
1-hour
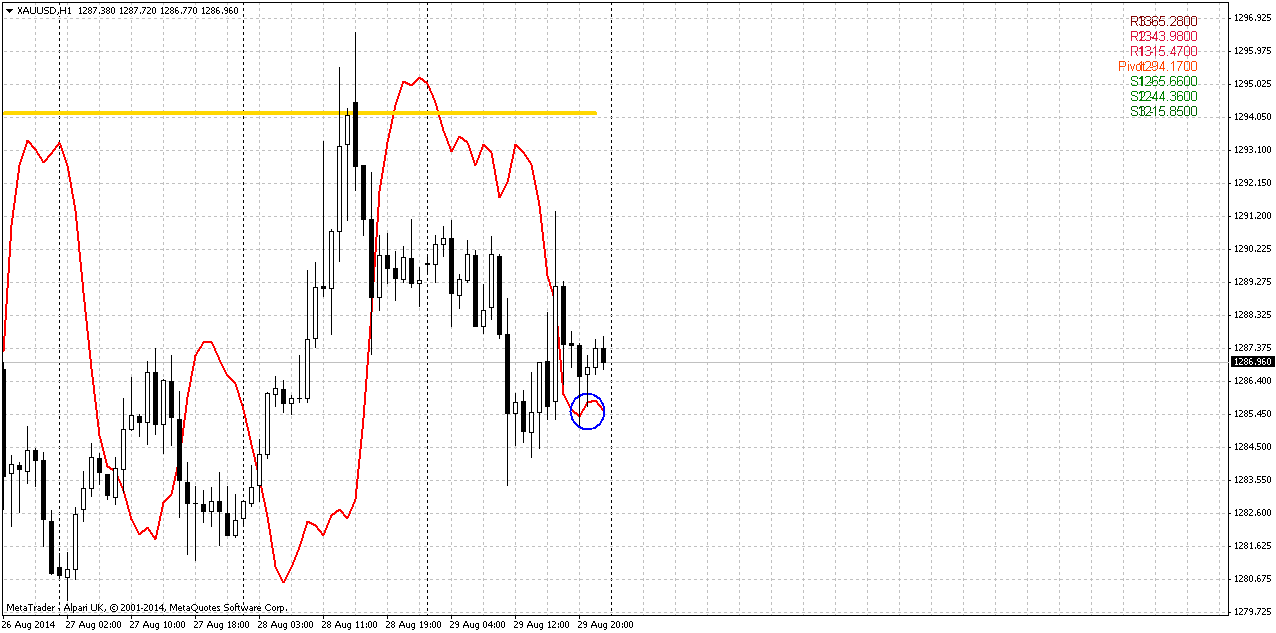
But as you will see on hourly chart here is one trick exists. Pay attention that new untouched September monthly pivot stands slightly above of grabber’s swing. We know that any market gravitates to pivots and tries to test them within a period.
Second moment here – couple of small bullish grabbers that suggest taking out of 1291 tops, i.e. grabbers top. Combining these moments points on situation when market could form some AB=CD up, deep retracement that will lead price to MPP. This is the risk for the grabber. It would be nice if price will erase hourly grabbers and market will continue move down right from current levels...
Conclusion:
Situation on gold market remains sophisticated. Due bearish moments, such as bullish USD sentiment, lack of physical demand, gold has re-established recently downward action. Recent action shows more and more bearish signs as well as fundamental data and overall market sentiment. Only geopolitical events could bring some surprise on market. If gold will fail to hold above 1270, then we will start to speak about 1240 levels probably.
Right now we’ve got bearish daily pattern that could become a trigger for 1240 action and we will try to work with it in short-term perspective.
The technical portion of Sive's analysis owes a great deal to Joe DiNapoli's methods, and uses a number of Joe's proprietary indicators. Please note that Sive's analysis is his own view of the market and is not endorsed by Joe DiNapoli or any related companies.
Nothing really drastical has happened since Friday, thus our fundamental part of comments will be short. In general we’ve placed daily news and rumors updates so and cover fundamental picture well. One thing that we want to do right here is to take a look at recent CFTC data. Currently it seems very important. If you remember from technical point of view we still had some concerns on possible upward action, because technical picture does not exclude this possibility yet.
Thus, CFTC data shows that in reality there are not many chances on this possible upward bounce. We do not know what will happen in geopolitical tensions because EU still wants to start some more sanctions within next week, while D. Cameron wants to cut Russia off from SWIFT banking system. But we do not know what particularly will happen.
Focusing only on financial situation due CFTC recent report shows very important issue – Open Interest has shown solid plunge down that means contraction of position on gold market. Simultaneously Net long position also has shown solid drop. Combining these two moments we can come to conclusion that traders close long positions and it means that they do not believe much in soon growth on gold market. Hence we have to be extra careful with any bullish technical picture that could appear on gold market on daily and higher time frames.
SPDR fund storage was flat on current week at 795 tonnes, but in general has decreased for 5 tonnes in August and returned to level of July. Still we have to acknowledge that this is not big volatility for the fund.
On recent week market has closed almost at the same price as week before and thus previous week has limited impact on monthly chart.
As we’ve mentioned previously price should pass solid distance to change situation drastically. it could change only if market will move above 1400 area. Recent rally that has started in July seems exhausted and looses pace fast. Even coming shift in seasonal trend does not fascinate traders much. Physical demand stands weak, dollar strong, inflation weak and talks around rate hiking also does not add optimism to gold.
Since currently August mostly is an inside month for July our former analysis is still working. Although investors have not got hawkish hints from Fed and recent NFP data was slightly lower than analysts poll, major factors are still valid - good economy data, that right now is confirmed by US companies earning reports, weak physical demand – all these moments prevent gold appreciation. Recent comments from spot gold traders and CFTC data put more questions rather then answers on degree of support gold by seasonal trend and geopolitical tensions. Technically gold still stands at very important level that at least theoretically could keep chances on upward rebound. If price will fail here – we probably will start to talk about bear trend again. Tendency could take shape of butterfly as I’ve drawn on the chart, especially because it agrees with bearish grabber target.
It is interesting that during recent rally market was not able to re-test Yearly Pivot and later has vanished our bullish weekly grabbers. This moments make difficult to count on upward reversal. Also we suspect that we could get bearish dynamic pressure here. As you can see trend has turned bullish, but gold does not show any upward action. Splash in July has faded fast. Mostly this pattern will depend on action in September-October. Thus, any solid plunge down here and taking 1240 lows will confirm it. In this case butterfly will become a reality. Finally, overall action since the beginning of the year mostly bearish. Take a look – in the beginning of the year market has tested YPP and failed, then continued move down. During recent attempt to move higher – has not even reached YPP again.
That’s being said, situation on the monthly chart does not suggest yet taking long-term positions on gold. Still, fundamental picture is moderately bearish in long-term. Possible sanctions from EU and US could hurt their own economies as well, especially EU. Many analysts already have started to talk about it. It means that economies will start to loose upside momentum and inflation will remain anemic. In such situations investors mostly invest in interest-bear assets, such as bonds. Approximately the same comments we saw for recent 1-2 months from physical gold traders.
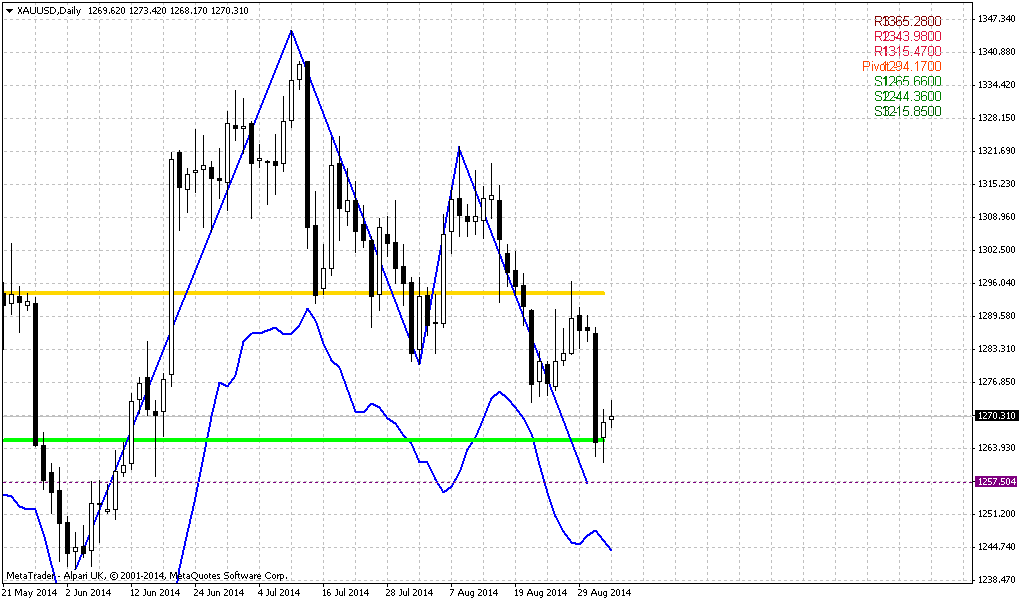
Weekly
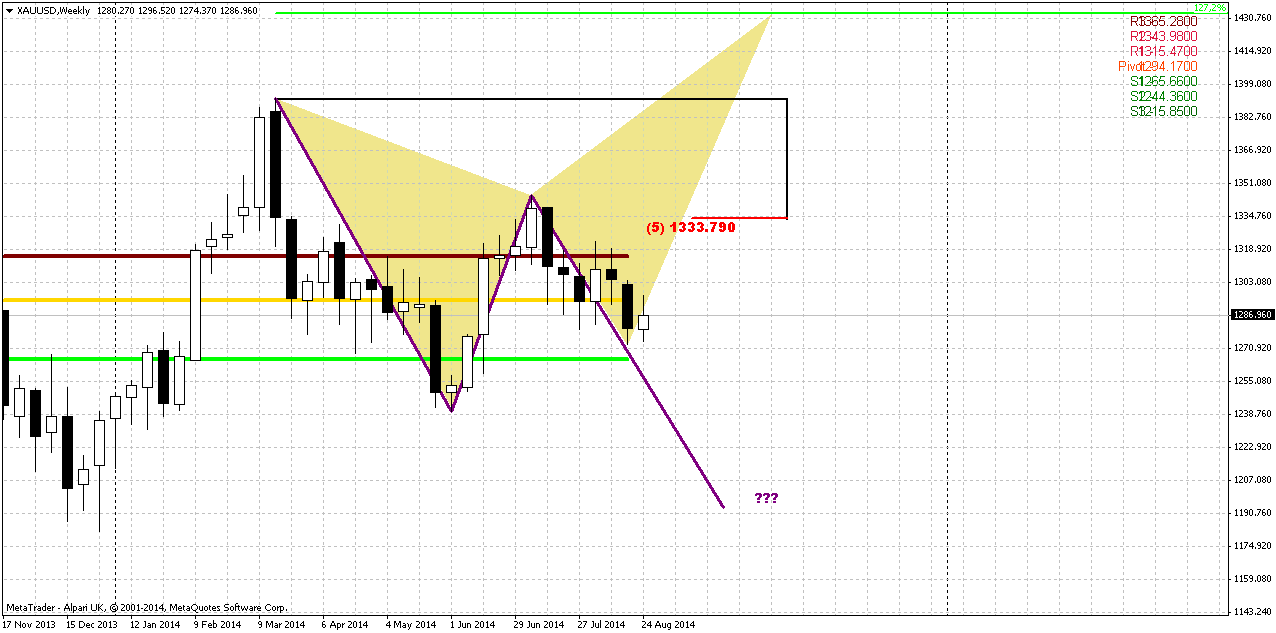
Recent week was inside one and does not care a lot of information. Although theoretical chances on upward action still exist as we’ve said this above and I even put this butterfly on chart, but, to be honest, guys, recent action brings more and more bearish signs.
Let’s follow through recent action:
Upward move from 1240 to 1340 was really nice. This has let reasons to speak about possible break on gold market. At the same time as we’ve mentioned many times – growth mostly was based on geopolitical reasons and had no support from real purchases.
When retracement has started and market has formed three in row bullish grabbers - that was normal - reasonable retracement out from 1333 Fib resistance. Bu later as you can see situation drastically has changed. Bullish trend, price above MPP and three in a row bullish grabbers has shifted to bearish trend, price has closed below MPP and grabbers were vanished.
On passed week, although it was rather small – price again has closed below MPP, CFTC data declares massive closing of longs and bounce up from 1270 mostly reminds some fake rather than real bullish challenge.
Gathering all this stuff together we come to conclusion that market has small chances to hold above 1270 and we should be ready for action to 1240 lows.
On previous week we mostly have spoken on 1270 level as important. Recent action and market mechanics significantly diminished importance of this level. Recent price behavior points on inability of the market jump out from this support.
For weekly chart crucial level will be 1240. Breaking through it will lead to solid consequences, such as – moving below MPS1, erasing of butterfly and solid confirmation of possible downward AB=CD pattern and in perspective monthly butterfly.
Following strictly to DiNapoli method we should search possibility to take short position, because we do not have bullish directional patterns here and trend as on monthly as on weekly stands bearish.
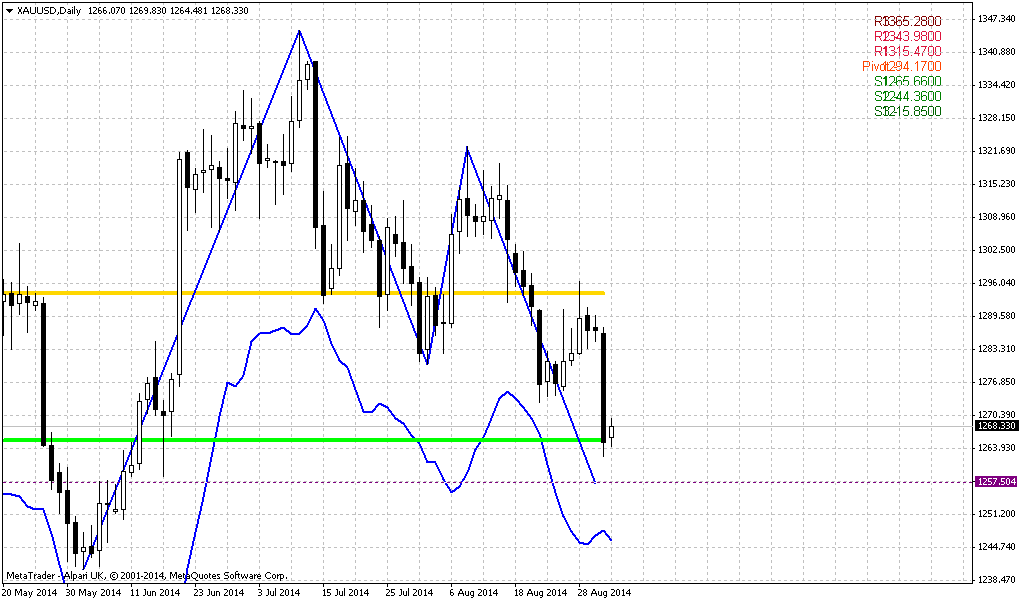
Daily
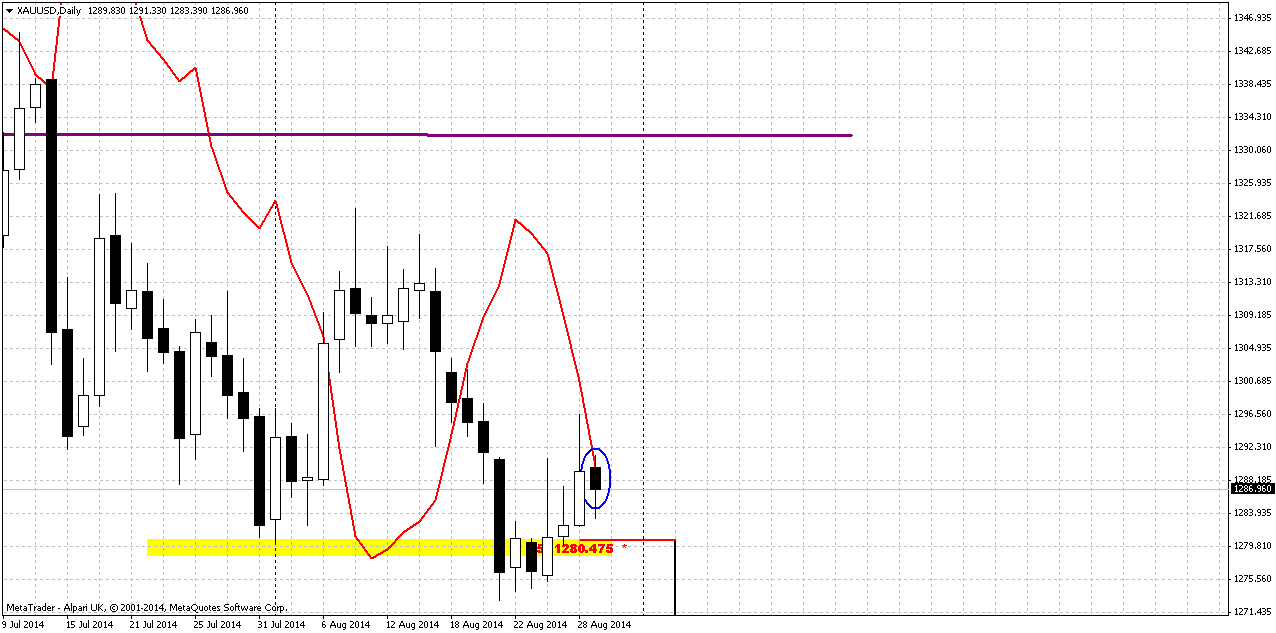
Daily trend holds bearish. Here we also can see how heavy market was with its attempts to bounce from 1270 Fib support level. Recent action looks more like bearish flag than upward reversal action.
Meantime here we need to recall our Friday’s conversation. In daily update we said – watch for possible grabber. It could give final confirmation of gold’s inability to hold on 1270 and will open road to downward action. This is our pattern and it has been confirmed. Now we have daily bearish grabber. It minimum target 1273 lows, invalidation point – top of grabber ~1291.50
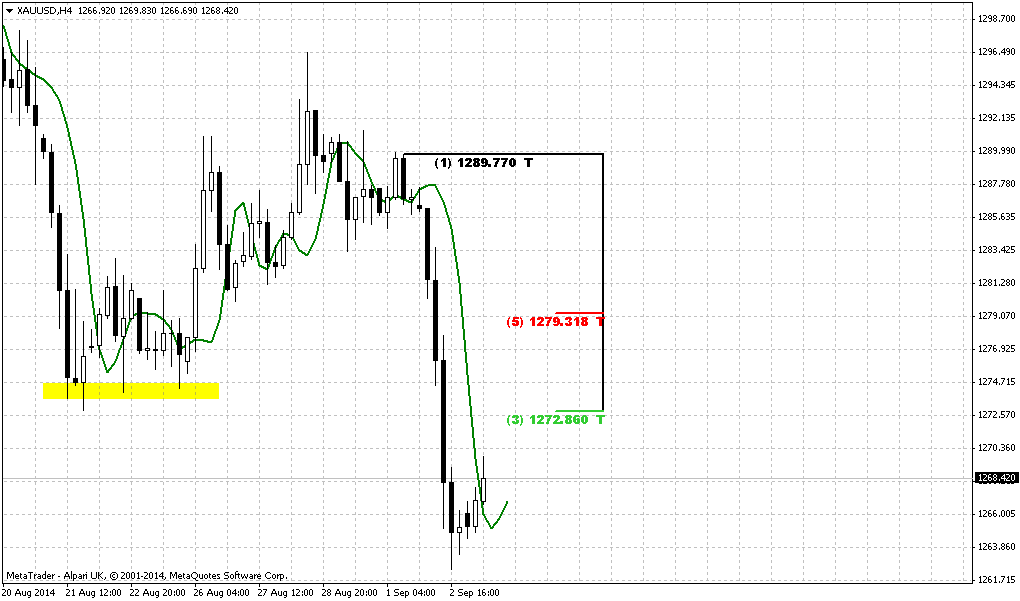
4-hour
Trend here is bearish as well. Here is our flag pattern. Since market has formed butterfly inside the flag and even completed AB=CD – this also could be treated as “222” Sell pattern here. Market should open somewhere around WPP on next week. Market action itself does not remind thrusting impluse action. It mostly looks like retracement. Based on daily grabber – we’re mostly interested in recent swing down as body of the grabber.
1-hour
But as you will see on hourly chart here is one trick exists. Pay attention that new untouched September monthly pivot stands slightly above of grabber’s swing. We know that any market gravitates to pivots and tries to test them within a period.
Second moment here – couple of small bullish grabbers that suggest taking out of 1291 tops, i.e. grabbers top. Combining these moments points on situation when market could form some AB=CD up, deep retracement that will lead price to MPP. This is the risk for the grabber. It would be nice if price will erase hourly grabbers and market will continue move down right from current levels...
Conclusion:
Situation on gold market remains sophisticated. Due bearish moments, such as bullish USD sentiment, lack of physical demand, gold has re-established recently downward action. Recent action shows more and more bearish signs as well as fundamental data and overall market sentiment. Only geopolitical events could bring some surprise on market. If gold will fail to hold above 1270, then we will start to speak about 1240 levels probably.
Right now we’ve got bearish daily pattern that could become a trigger for 1240 action and we will try to work with it in short-term perspective.
The technical portion of Sive's analysis owes a great deal to Joe DiNapoli's methods, and uses a number of Joe's proprietary indicators. Please note that Sive's analysis is his own view of the market and is not endorsed by Joe DiNapoli or any related companies.
")