Sive Morten
Special Consultant to the FPA
- Messages
- 18,699
Fundamentals
Weekly Gold Tading Report prepared by Sive Morten exclusively for ForexPeaceArmy.com
According to Reuters news Gold fell 0.8 percent on Friday to its lowest price since January, and silver slumped 3 percent to a four-year low as the dollar surged on bets that U.S. interest rates could rise sooner than expected.
"It's the same story since last week. Gold is under pressure with the dollar at an extremely lofty level, U.S. equities at all-time high, and expectations that U.S. interest rates will rise eventually," said David Meger, director of metals trading at brokerage Vision Financial.
Economic optimism has sapped gold's safe-haven appeal. U.S. economic activity rose less than expected in August, but was still consistent with a moderate expansion, The Conference Board said on Friday.
As you can see there is not much news on passed week on gold. What is really interesting right now is CFTC data.
 Source: CFTC, Reuters
Here we see significant growth in Open Interest for the second consecutive week and drop in Net Long position. “Net Long” means difference between longs and shorts. Hence, decreasing of Net long means either closing longs or opening shorts. But as we see simultaneous growth in Open Interest – it means new positions were opened and these positions probably short. This tells that bearish sentiment still strong and has got new support by new short positions on recent week. Hence, we probably should be ready for more achievements to the downside.
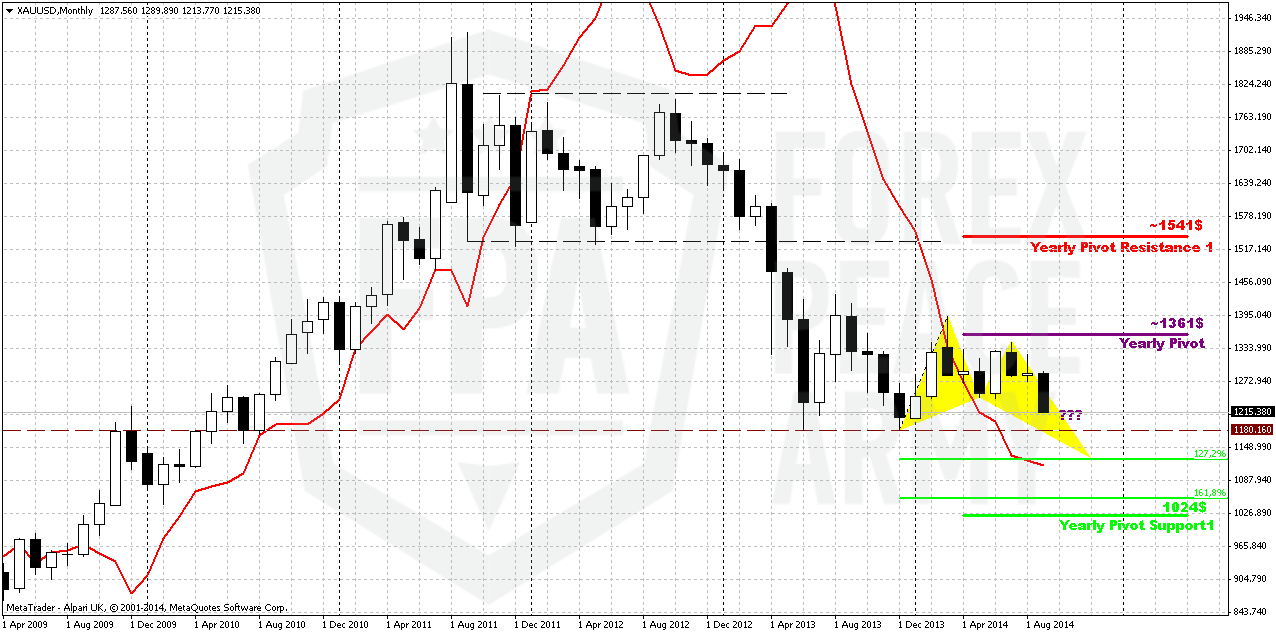
Monthly
As we’ve mentioned previously price should pass solid distance to change situation drastically and currently we do not see any signs how it could happen. Still, theoretically “the return point” is 1400 area. Recent rally that has started in July totally vanished and market right now stands even below its’ bottom. Even coming shift in seasonal trend does not fascinate traders much. Physical demand stands weak, dollar strong, inflation weak and talks around rate hiking also does not add optimism to gold. Comments from physical traders on physical demand has appeared to be only comments. First, they told that demand grows below 1330, then 1300, then 1240, now speeches promise demand around 1180, let’s see.
You probably already understand that primary question on big picture – how deep market could fall. Whether price will break 1180? Here I would like to remind pattern from which our gold analysis has started – Volatility breakout when we said that some 0.618 AB-CD down should happen. And what do we see right now... Pay attention that retracement up to 1400 was small, just 3/8 Fib level. It points on strength of the bears. Thus, following this logic – market should form 1. 618 Butterfly because it’s target coincides with AB-CD target. We will not promise reaching of 1025-1050 area definitely (although this is logical – action to YPS1) but chances that gold will break through 1180 seem significant, especially on a background of recent CFTC data.
Major factors are still valid - good economy data, that right now is confirmed by US companies earning reports, weak physical demand – all these moments prevent gold appreciation. As September bearish intentions look strong - tendency could take shape of butterfly as I’ve drawn on the chart, especially because it agrees with bearish grabber target.
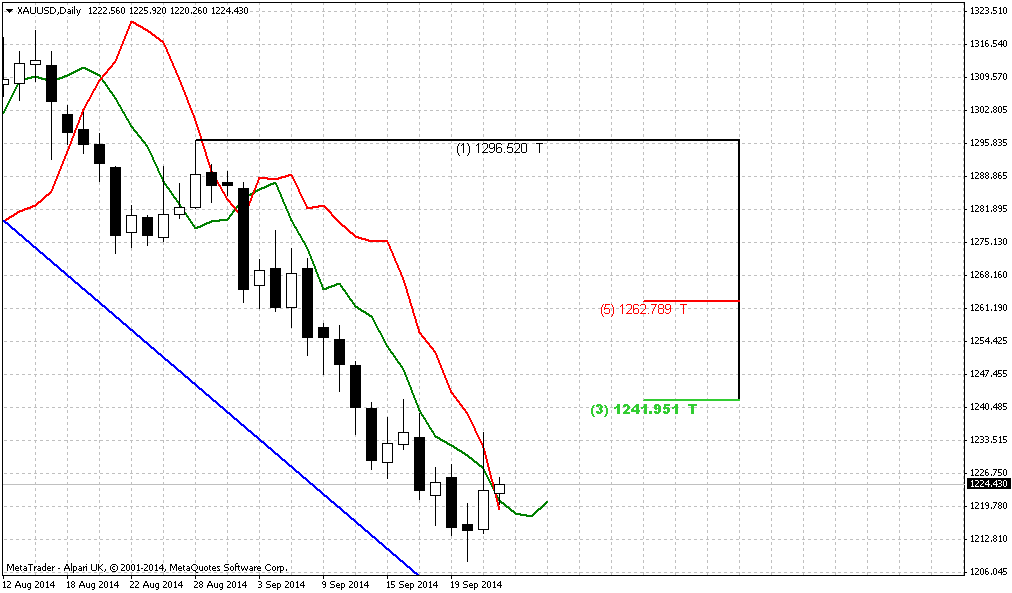
It is interesting that during recent rally market was not able to re-test Yearly Pivot and later has vanished our bullish weekly grabbers. This moments make difficult to count on upward reversal. Also we suspect that we could get bearish dynamic pressure here and probably already getting it. As you can see trend has turned bullish, but gold does not show any upward action. Splash in July has faded fast. Mostly this pattern will depend on action in September-October. Plunge down here and taking 1240 lows confirms it. Finally, overall action since the beginning of the year mostly bearish. Take a look – in the beginning of the year market has tested YPP and failed, then continued move down. During recent attempt to move higher – has not even reached YPP again.
That’s being said, situation on the monthly chart does not suggest yet taking long-term long positions on gold. Fundamental picture is moderately bearish in long-term. Possible sanctions from EU and US could hurt their own economies as well, especially EU. Many analysts already have started to talk about it. It means that economies will start to loose upside momentum and inflation will remain anemic. In such situations investors mostly invest in interest-bear assets, such as bonds. Approximately the same comments we saw for recent 1-2 months from physical gold traders.
On monthly chart we have chain of targets. First one stands at former lows at 1180. Next one is 1125$ - butterfly 1.27 target and then ultimate combination of 1.618 target and YPS1 around 1020-1050 area. 1180 seems most probable not only because it stands closer but also because this is the target of the grabber and bearish dynamic pressure, but some patterns and details do not exclude even reaching of 1025-1050 area.
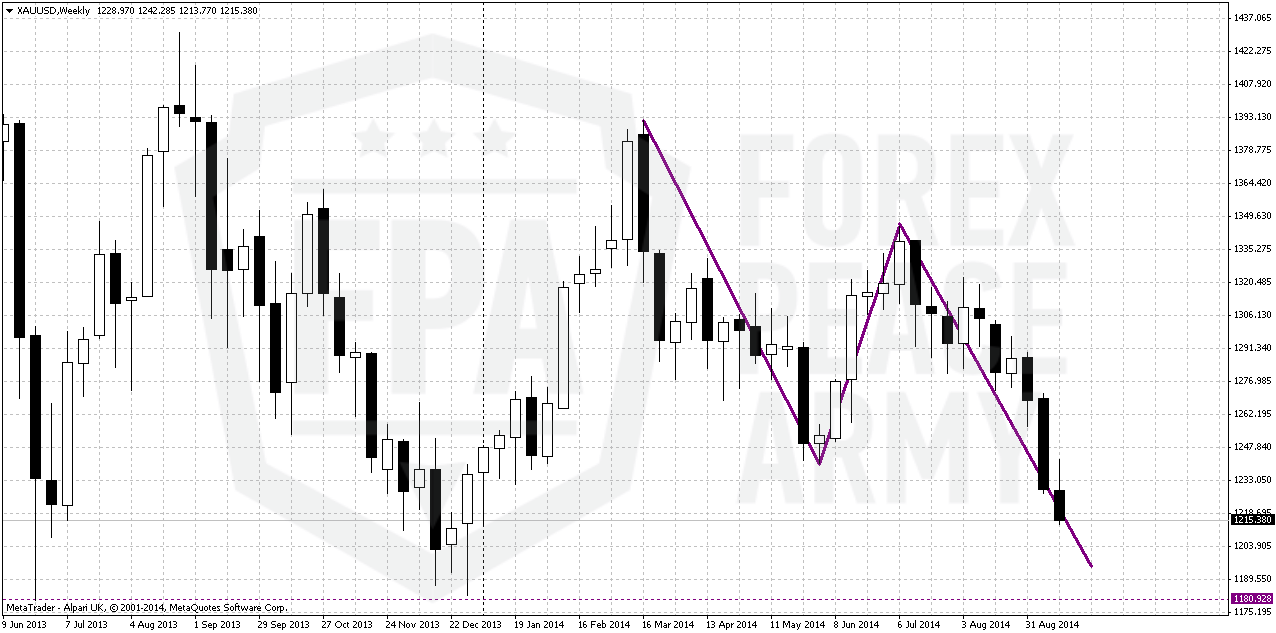
Weekly
Earlier we have shown (and not once) why we think that market almost has no chances to reverse up. Explanation comes from market mechanics:
Upward move from 1240 to 1340 was really nice. This has let reasons to speak about possible break on gold market. At the same time as we’ve mentioned many times – growth mostly was based on geopolitical reasons and had no support from real purchases.
When retracement has started and market has formed three in row bullish grabbers - that was normal - reasonable retracement out from 1333 Fib resistance. Bu later as you can see situation drastically has changed. Bullish trend, price above MPP and three in a row bullish grabbers has shifted to bearish trend, price has closed below MPP and grabbers were vanished.
Bounce up from 1270 two weeks ago mostly reminds some fake rather than real bullish challenge.
Price has closed below MPS1, CFTC data declares solid closing of longs
On previous week we’ve got continuation and more confirmation of bearish power. Thus, we even do not need any pivots here since market has broken them all. Gold also has stably close below 1240 and this was not a W&R, this was real breakout. Moving below 1240 has destroyed even theoretical chances on upside butterfly that we’ve discussed on previous week.
Gathering all this stuff together we come to conclusion that market has small chances to hold around and we should be ready for action to 1180 lows. This will be the journey of coming week probably.
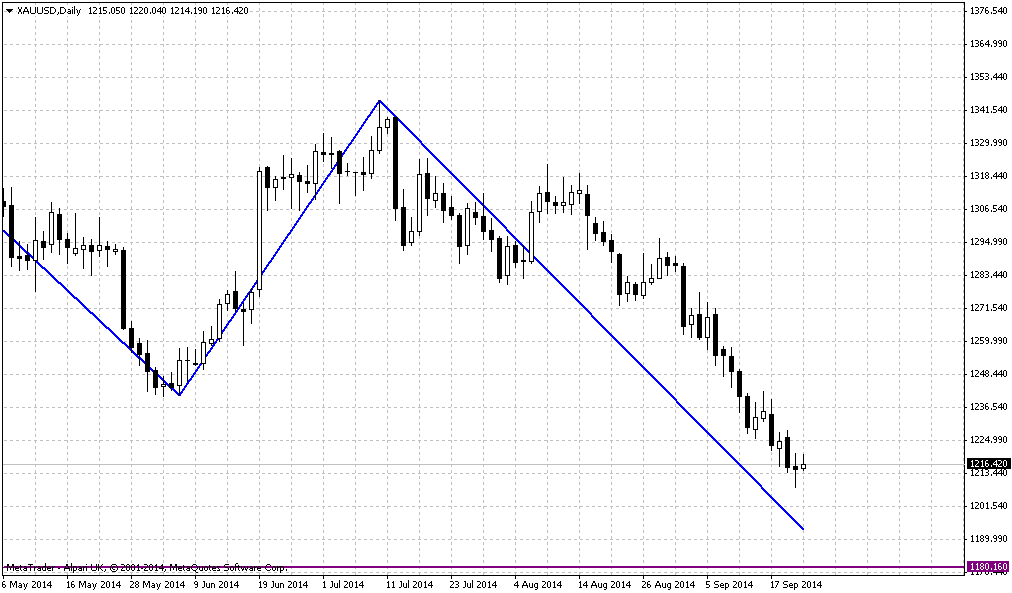
Today we do not have any important Fib levels on weekly chart, we do not need pivots, we know that trend is bearish and market right now is not at oversold. That’s why today picture of gold market is extremely simple:
Yes, we just have AB=CD pattern. And since price already has passed 0.618 target it has no choice but just complete it. AB=CD target stands accurately around 1180 lows, but as we have grabber as well – most probably that gold will wash it out. Besides, this is gold’s habit either. Hence our next destination point here is 1180 lows.
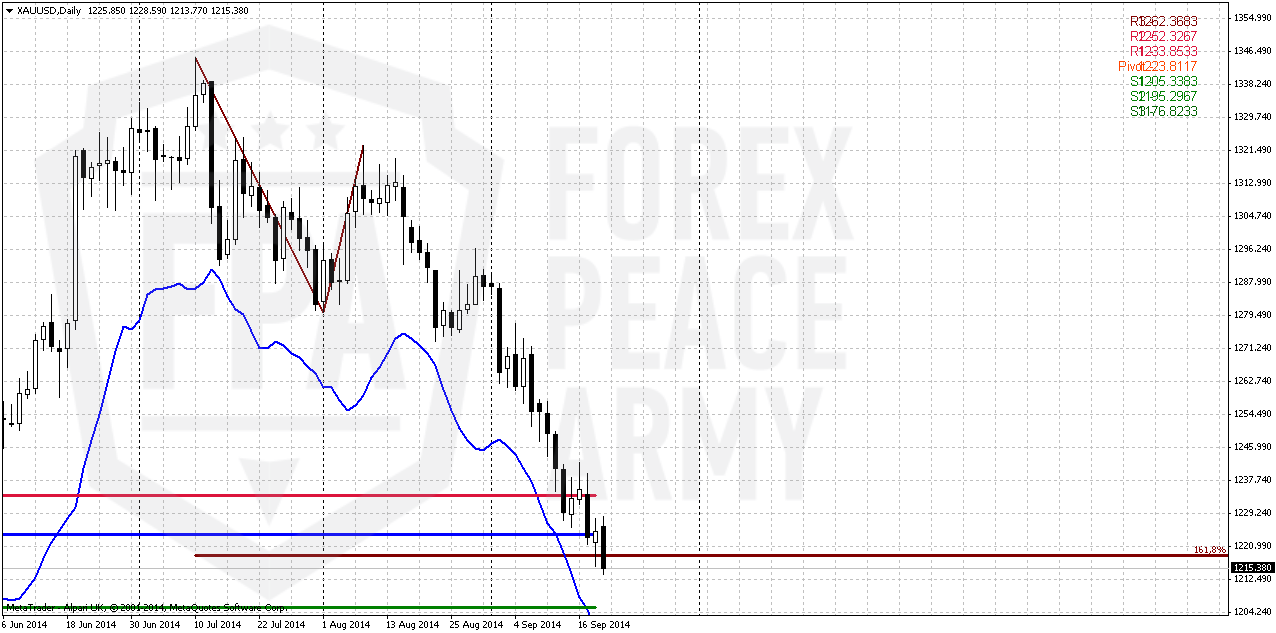
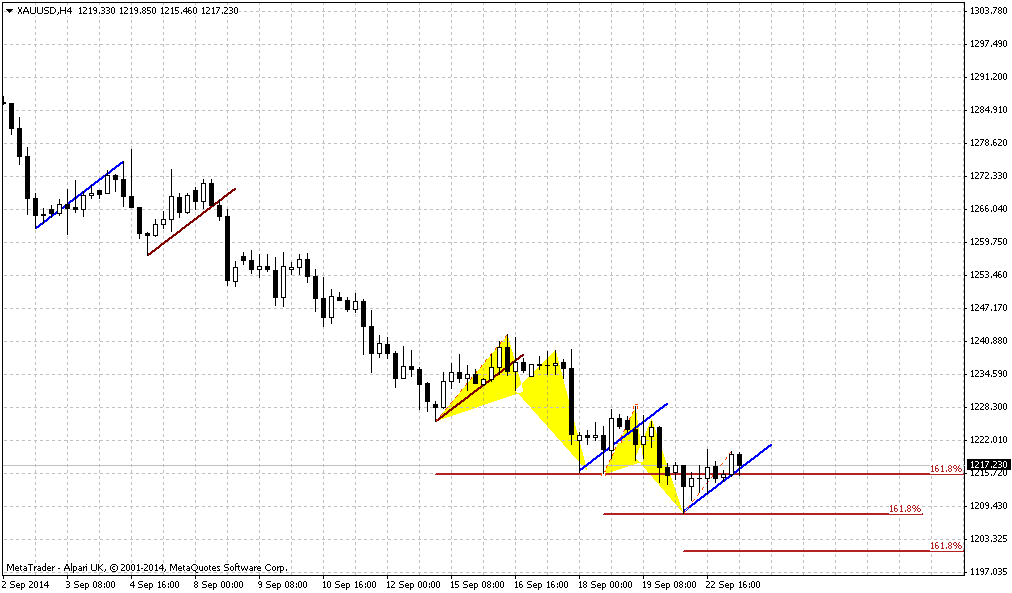
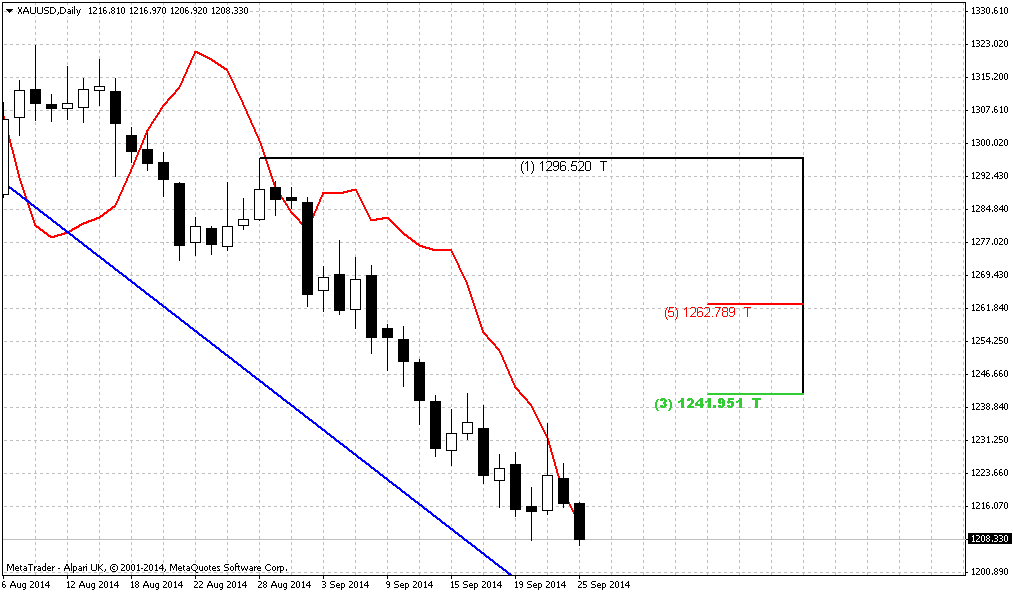
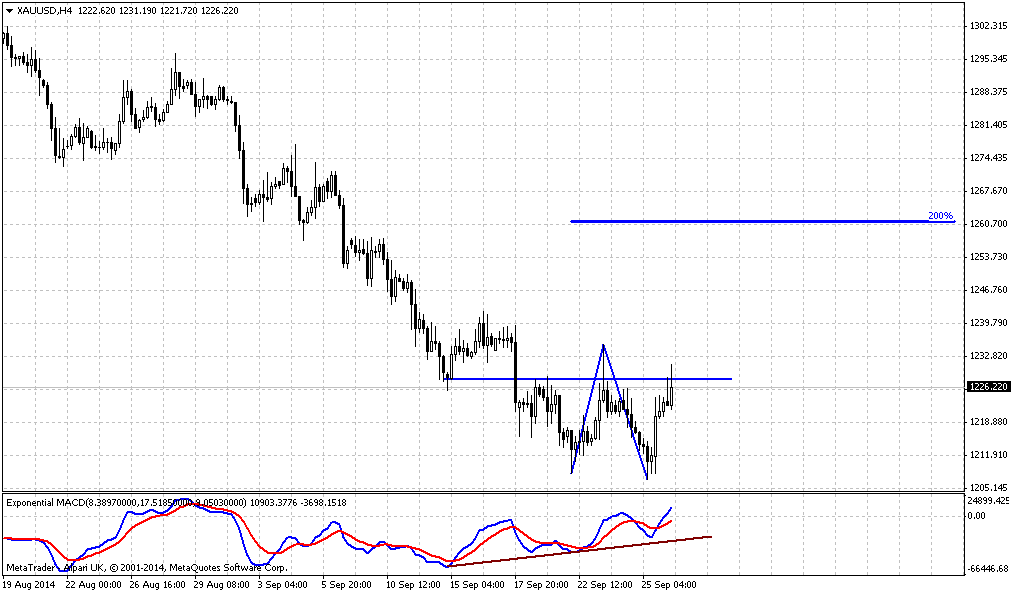
Daily
This is really exceptional week, because as on EUR as we’ve discussed yesterday as on gold – daily chart is not very useful. On daily gold we do not have any patterns by far. But still, couple of moments are worthy of our attention. First, take a look that market closed below hammer pattern, that in turn was a moment of completion of AB=CD 1.618 target. At first glance, may be price stands just slightly lower, but this could be sign of failure. If market will not show any reaction and it has not done it on Thursday – it will show how market weak is and encourage bears on reaching lower levels.
Second – here we have nice thrust down. If we will get any bounce up from 1180 area – it could be accompanied by some DiNapoli pattern.
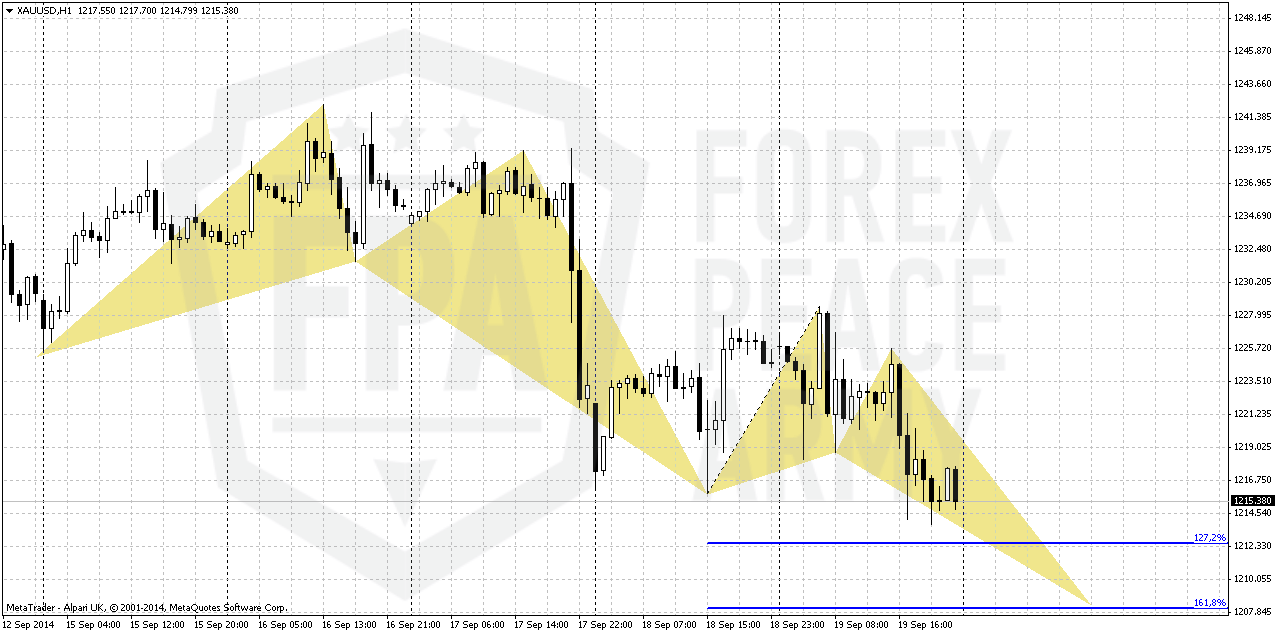
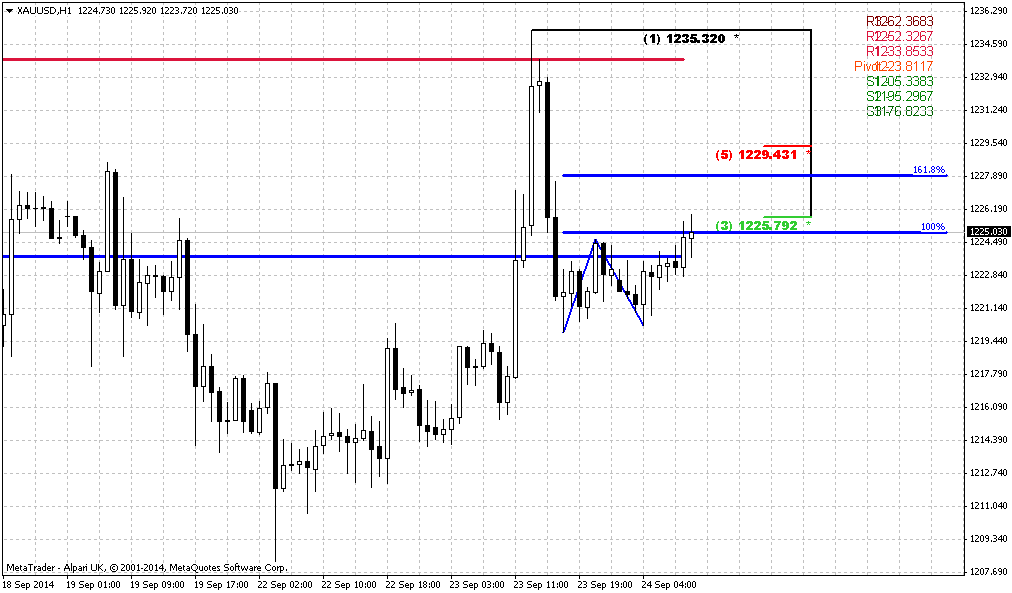
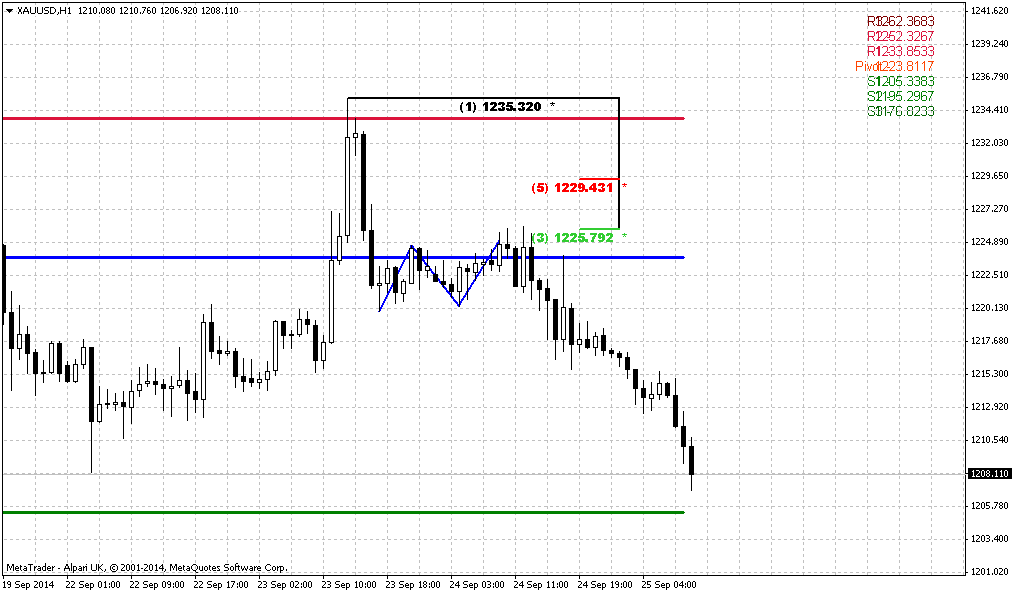
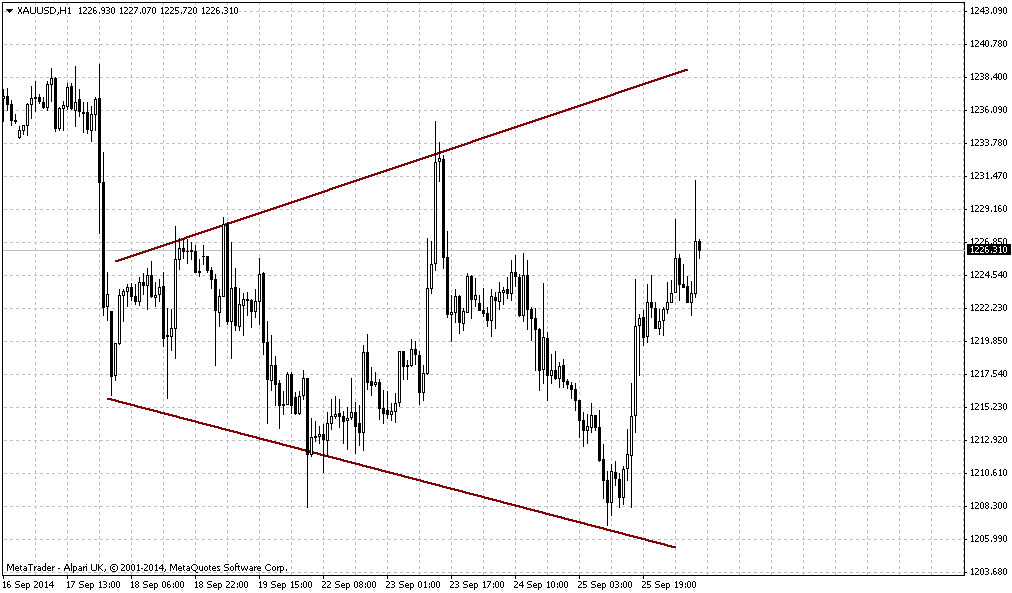
1-hour
On hourly chart we see consequence of two butterflies. First one we’ve discussed already and it was completed on previous week. Now we have another one but smaller scale. Still, as weekly target stands at 1197 and in general we expect even reaching of 1180 – hardly this small butterfly will be reversal one. Most probable that market also will show some minor reaction to complete this pattern. Major things probably will happen after 1180 will be hit.
Conclusion:
Situation on gold market remains sophisticated. Due bearish moments, such as bullish USD sentiment, lack of physical demand, gold has re-established recently downward action. Recent action shows more and more bearish signs as well as fundamental data and overall market sentiment. On a way down market could pass through multiple target and closest one is 1180$. We even have setup on big picture that suggests moving to 1025-1050 area.
In short term perspective we should wait for reaching of 1180 area first. There some signs should come – whether gold will go lower or not.
The technical portion of Sive's analysis owes a great deal to Joe DiNapoli's methods, and uses a number of Joe's proprietary indicators. Please note that Sive's analysis is his own view of the market and is not endorsed by Joe DiNapoli or any related companies.
Weekly Gold Tading Report prepared by Sive Morten exclusively for ForexPeaceArmy.com
According to Reuters news Gold fell 0.8 percent on Friday to its lowest price since January, and silver slumped 3 percent to a four-year low as the dollar surged on bets that U.S. interest rates could rise sooner than expected.
"It's the same story since last week. Gold is under pressure with the dollar at an extremely lofty level, U.S. equities at all-time high, and expectations that U.S. interest rates will rise eventually," said David Meger, director of metals trading at brokerage Vision Financial.
Economic optimism has sapped gold's safe-haven appeal. U.S. economic activity rose less than expected in August, but was still consistent with a moderate expansion, The Conference Board said on Friday.
As you can see there is not much news on passed week on gold. What is really interesting right now is CFTC data.
Here we see significant growth in Open Interest for the second consecutive week and drop in Net Long position. “Net Long” means difference between longs and shorts. Hence, decreasing of Net long means either closing longs or opening shorts. But as we see simultaneous growth in Open Interest – it means new positions were opened and these positions probably short. This tells that bearish sentiment still strong and has got new support by new short positions on recent week. Hence, we probably should be ready for more achievements to the downside.
Monthly
As we’ve mentioned previously price should pass solid distance to change situation drastically and currently we do not see any signs how it could happen. Still, theoretically “the return point” is 1400 area. Recent rally that has started in July totally vanished and market right now stands even below its’ bottom. Even coming shift in seasonal trend does not fascinate traders much. Physical demand stands weak, dollar strong, inflation weak and talks around rate hiking also does not add optimism to gold. Comments from physical traders on physical demand has appeared to be only comments. First, they told that demand grows below 1330, then 1300, then 1240, now speeches promise demand around 1180, let’s see.
You probably already understand that primary question on big picture – how deep market could fall. Whether price will break 1180? Here I would like to remind pattern from which our gold analysis has started – Volatility breakout when we said that some 0.618 AB-CD down should happen. And what do we see right now... Pay attention that retracement up to 1400 was small, just 3/8 Fib level. It points on strength of the bears. Thus, following this logic – market should form 1. 618 Butterfly because it’s target coincides with AB-CD target. We will not promise reaching of 1025-1050 area definitely (although this is logical – action to YPS1) but chances that gold will break through 1180 seem significant, especially on a background of recent CFTC data.
Major factors are still valid - good economy data, that right now is confirmed by US companies earning reports, weak physical demand – all these moments prevent gold appreciation. As September bearish intentions look strong - tendency could take shape of butterfly as I’ve drawn on the chart, especially because it agrees with bearish grabber target.
It is interesting that during recent rally market was not able to re-test Yearly Pivot and later has vanished our bullish weekly grabbers. This moments make difficult to count on upward reversal. Also we suspect that we could get bearish dynamic pressure here and probably already getting it. As you can see trend has turned bullish, but gold does not show any upward action. Splash in July has faded fast. Mostly this pattern will depend on action in September-October. Plunge down here and taking 1240 lows confirms it. Finally, overall action since the beginning of the year mostly bearish. Take a look – in the beginning of the year market has tested YPP and failed, then continued move down. During recent attempt to move higher – has not even reached YPP again.
That’s being said, situation on the monthly chart does not suggest yet taking long-term long positions on gold. Fundamental picture is moderately bearish in long-term. Possible sanctions from EU and US could hurt their own economies as well, especially EU. Many analysts already have started to talk about it. It means that economies will start to loose upside momentum and inflation will remain anemic. In such situations investors mostly invest in interest-bear assets, such as bonds. Approximately the same comments we saw for recent 1-2 months from physical gold traders.
On monthly chart we have chain of targets. First one stands at former lows at 1180. Next one is 1125$ - butterfly 1.27 target and then ultimate combination of 1.618 target and YPS1 around 1020-1050 area. 1180 seems most probable not only because it stands closer but also because this is the target of the grabber and bearish dynamic pressure, but some patterns and details do not exclude even reaching of 1025-1050 area.
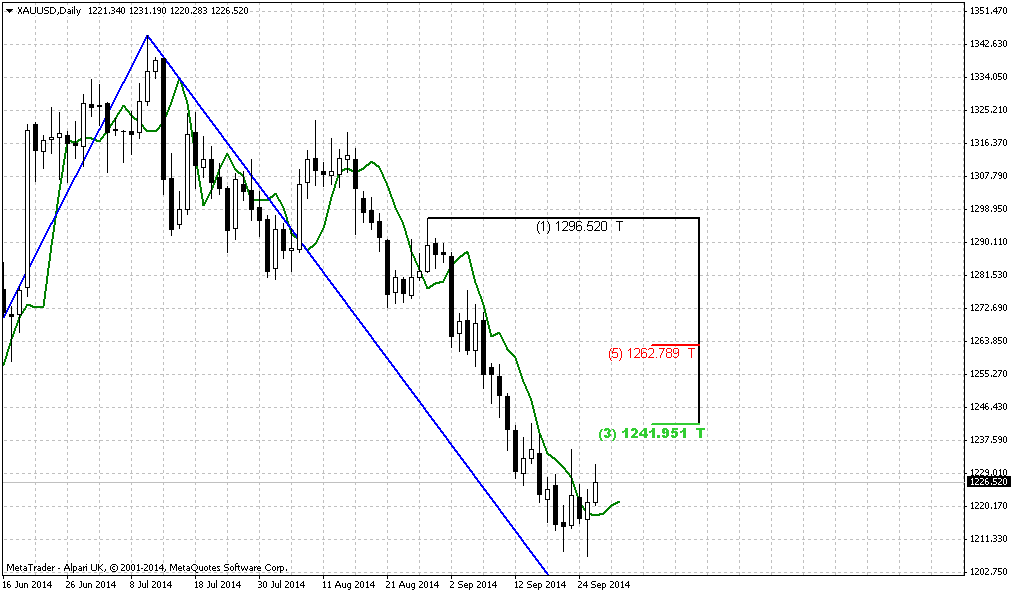
Weekly
Earlier we have shown (and not once) why we think that market almost has no chances to reverse up. Explanation comes from market mechanics:
Upward move from 1240 to 1340 was really nice. This has let reasons to speak about possible break on gold market. At the same time as we’ve mentioned many times – growth mostly was based on geopolitical reasons and had no support from real purchases.
When retracement has started and market has formed three in row bullish grabbers - that was normal - reasonable retracement out from 1333 Fib resistance. Bu later as you can see situation drastically has changed. Bullish trend, price above MPP and three in a row bullish grabbers has shifted to bearish trend, price has closed below MPP and grabbers were vanished.
Bounce up from 1270 two weeks ago mostly reminds some fake rather than real bullish challenge.
Price has closed below MPS1, CFTC data declares solid closing of longs
On previous week we’ve got continuation and more confirmation of bearish power. Thus, we even do not need any pivots here since market has broken them all. Gold also has stably close below 1240 and this was not a W&R, this was real breakout. Moving below 1240 has destroyed even theoretical chances on upside butterfly that we’ve discussed on previous week.
Gathering all this stuff together we come to conclusion that market has small chances to hold around and we should be ready for action to 1180 lows. This will be the journey of coming week probably.
Today we do not have any important Fib levels on weekly chart, we do not need pivots, we know that trend is bearish and market right now is not at oversold. That’s why today picture of gold market is extremely simple:
Yes, we just have AB=CD pattern. And since price already has passed 0.618 target it has no choice but just complete it. AB=CD target stands accurately around 1180 lows, but as we have grabber as well – most probably that gold will wash it out. Besides, this is gold’s habit either. Hence our next destination point here is 1180 lows.
Daily
This is really exceptional week, because as on EUR as we’ve discussed yesterday as on gold – daily chart is not very useful. On daily gold we do not have any patterns by far. But still, couple of moments are worthy of our attention. First, take a look that market closed below hammer pattern, that in turn was a moment of completion of AB=CD 1.618 target. At first glance, may be price stands just slightly lower, but this could be sign of failure. If market will not show any reaction and it has not done it on Thursday – it will show how market weak is and encourage bears on reaching lower levels.
Second – here we have nice thrust down. If we will get any bounce up from 1180 area – it could be accompanied by some DiNapoli pattern.
1-hour
On hourly chart we see consequence of two butterflies. First one we’ve discussed already and it was completed on previous week. Now we have another one but smaller scale. Still, as weekly target stands at 1197 and in general we expect even reaching of 1180 – hardly this small butterfly will be reversal one. Most probable that market also will show some minor reaction to complete this pattern. Major things probably will happen after 1180 will be hit.
Conclusion:
Situation on gold market remains sophisticated. Due bearish moments, such as bullish USD sentiment, lack of physical demand, gold has re-established recently downward action. Recent action shows more and more bearish signs as well as fundamental data and overall market sentiment. On a way down market could pass through multiple target and closest one is 1180$. We even have setup on big picture that suggests moving to 1025-1050 area.
In short term perspective we should wait for reaching of 1180 area first. There some signs should come – whether gold will go lower or not.
The technical portion of Sive's analysis owes a great deal to Joe DiNapoli's methods, and uses a number of Joe's proprietary indicators. Please note that Sive's analysis is his own view of the market and is not endorsed by Joe DiNapoli or any related companies.
") Paul
Paul
