Sive Morten
Special Consultant to the FPA
- Messages
- 18,706
Fundamentals
As we mostly have done with explanation our long-term view within few previous reports, now we take a look at short-term picture and driving factors that could impact on gold market on coming week.
In two words long-term view suggests downside continuation within a year or so, while US will keep high rates of GDP and Fed will keep hawkish policy and reversal later, closer to 2020, because by Fathom consulting view world could meet global crisis. Fathom is reliable source and we can't just ignore this scenario.
In shorter term, as Reuters reports, gold prices fell more than 1 percent on Friday as the dollar firmed against the British sterling and the euro after British Prime Minister Theresa May said the European Union must supply an alternative Brexit proposal.
China’s moves to boost domestic consumption also helped bolster the dollar rally driven by investor bets that the latest U.S.-China trade salvoes were unlikely to dent global growth. The dollar’s status as the chief reserve currency makes it the prime beneficiary of U.S.-China trade conflict, with the United States seen as having less to lose.
“A big selloff in the pound and euro sent the dollar sharply higher. And gold, being dollar-denominated, fell as a result of that,” said FOREX.com analyst Fawad Razaqzada.
Investors await next week’s Federal Reserve meeting, where the U.S. central bank is widely expected to raise benchmark interest rates. Higher U.S. interest rates tend to make gold less attractive since it does not pay interest and costs money to store and insure.
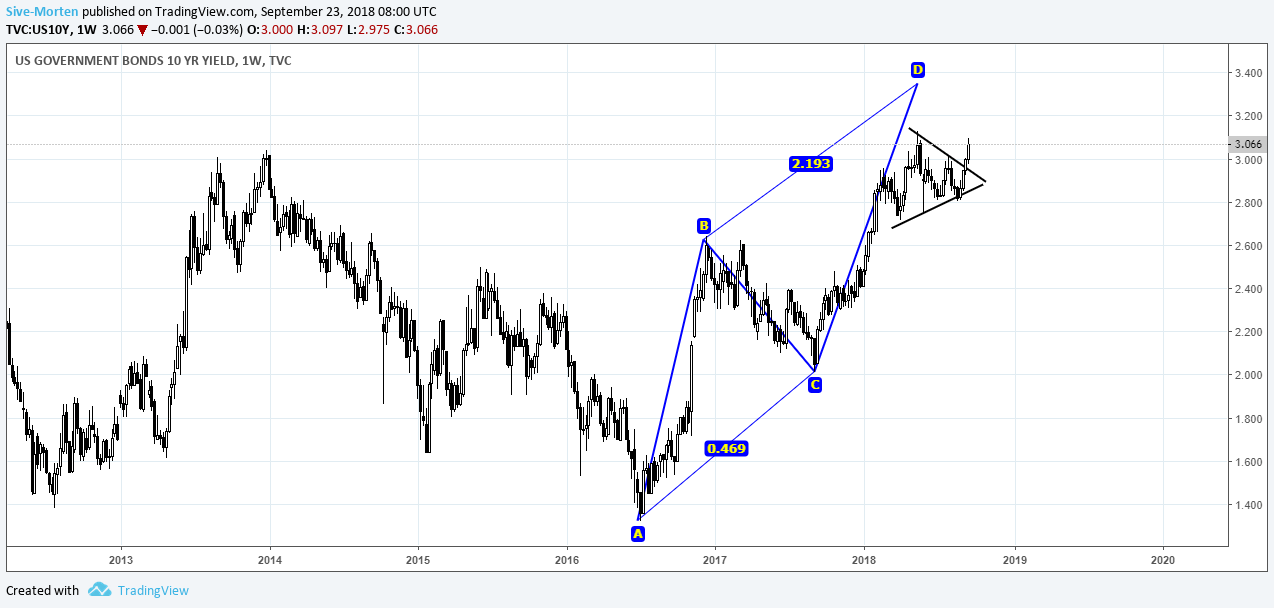
I also suggest that last week major driving factor for gold was US interest rates. Indeed, 10-year rate has moved above psychological 3.0% area again, breaking pennant pattern up:
It is done question about rate increase next week. But probability is high for 4th rate increase in December as well - it stands now around 78%, based on CME Fed Watch Tool.
COT Report
Recent CFTC data shows that investors reluctantly react on price action on gold market. This moment confirms that current upside action mostly is treated as retracement. We do not see big changes in net position and open interest.
 Source: CFTC.gov
Charting by Investing.com
Technical
Monthly
On monthly chart we keep our long-term technical scenario, that could be realized. this is not single possible scenario, but currently it seems as very probable. We will keep it intact for awhile, because it illustrates our fundamental expectations on gold market.
Here we try to involve fundamental view in technical analysis, trying to combine patterns with real fundamental situation on gold. So, we will take broader view.
If you follow our weekly updates, you should remember our explanation and why we think that gold inability to break through 1380 resistance should be treated as bulls' defeat and gold failure. This is important in outlook of longer-term perspective.
Fundamental picture suggests two major things. In shorter-term US will keep dominate role in the world, because indirectly it controls EU economy as major EU companies have significant part of their business in US, or on US territory, US dollar is still world major currency and, as we've estimated above, China starts to show signs of chilling their economy. US economy itself feels good. D. Trump by restructuring of political role of US on international arena will safe a lot of "unnecessary" spending, such as revolutions, different programs of opposition financing, military spending of different kind. This should improve US budget, reduce deficit, which also will work on support of US economy.
Second important issue, this long-term relations that stand for decades start changing. Both of these moments, putting together, lead us to following conclusion. Within few years, 2-3 probably gold will remain under pressure of positive interest rates cycle. While gradually, when breaking of long-term economic relations will be seen brighter and brighter and impact not only China, EU but US as well - this will be turning point for the gold, or slightly before that. Because any global crush of any kind triggers demand for gold. That is what we see from fundamentals.
It could look unbelievable, but technical picture shows approximately the same. Failure of 1380 upside breakout confirms our idea of 2-3 years of US and US Dollar domination. But at the same time gold should show preparation to reversal, and here it is. One of the scenarios that might be formed here is big 1.618 butterfly, which is bullish reversal pattern. It has 1.618 target right around gold price, which is corresponds to extraction spending approximately. So, it is long-term breakeven point.
Finally, butterfly could become large reverse H&S pattern around all time 5/8 Fib support and ~40% of this pattern could be seen on the market. What we see on the chart nicely corresponds to current fundamental background.
Of course, political life is not static, and it could show fast turns. But right now, everything looks very harmonic.
Here we also have mentioned huge demand on gold from emerging countries - China, Russia and Turkey. Developed countries repatriate gold from US. It means that everybody prepares to something, which should significantly increase demand for a gold.
So, that's is our long-term view. There is softer scenario of "222" Buy pattern instead of butterfly exists, but which one will happen in reality is impossible to say right now and we will keep an eye on both.

Weekly
Last week, guys, we've missed a bit with grabber, because retail broker has shown it on its chart, but in reality grabber was not confirmed by gold futures price.
Today, we have mirror situation. FX broker shows no grabber, but I have checked CME gold futures, and we have one as on October contract as on continuous futures. It means that here we could repeat the same analysis, as for previous week. Besides, market stands at the same price area as last week.
Weekly price action mostly stands inside the range of long August candle, when gold has hit weekly oversold. Since then we watch for patterns here and upside bounce to at least 3/8 resistance area of 1238$, which seems normal pullback in such conditions.
Despite our long term bearish trend on gold, it can't show straight down action without any pauses. And we think that one of these stops we have right now. Although the scale of this "pause" looks impressive 50-70$ per contract bounce, on weekly chart this is just 3/8 pullback, which seems normal when market hits oversold and YPS1 areas. Thus, on weekly we still watch for our directional pattern, based on the thrust down.
Weekly time frame is the one that gives us the vision for few weeks. In a longer-term view we still have large AB=CD pattern with OP around 1113 area. Sooner or later but probably it should be reached. Just because gold has dropped easily through 1215 major support and has not stopped at 1180 YPS1 but collapsed right to 1160. So, now price action stands between COP and OP target. Usually in such placement, price gravitates to OP, because in fact, it has no strong support lower, its a free space. And the only thing that keeps gold from disaster is Oversold condition, which important for us in short-term view.
Oversold suggests upside bounce at least to 3/8 resistance area - 1238$. It looks far on weekly chart, but in reality, this is just 30% and common response to reaching of OS. Since our major direction is down - we're mostly looking for chances to go short here, and upside bounce to Fib level could give us B&B "Sell". That's particular the pattern that we will be watching for here. Currently we have shape of engulfing price action and retracement back inside its body is common practice. But this pattern has not even started, as we have no close above 3x3 DMA yet.
In shorter-term we've got a new input here - bearish grabber. It doesn't cancel scenario with upside bounce (although it could), but significantly changes possible price shape. Thus, it suggests taking out of recent lows and drop to MPS1. It means that we will have to turn in favor of Double bottom pattern on daily chart rather than simple AB=CD.

Daily
Now we need to take a look at lower time frames through the prism of weekly grabber pattern. The one thing that stands absolutely clear is the recent top. While price stands below it, we have bearish context, because weekly grabber is valid. It doesn't mean that we cancel our scenario with higher upside retracement. It just mean that weekly grabber probably will change the shape of price action and particular pattern that could push gold there, to 1240 area. For instance, it could be DRPO "Buy" on weekly chart...
As last week as this one we have bearish MACD divergence. Taking in consideration weekly bearish grabber, our context turns bearish, which makes rather dangerous any attempt to go long. It means that bulls should wait when weekly grabber will either worked out or cancelled. And when clear bullish pattern will be formed here, on daily. Situation becomes attractive for intraday bears.

Intraday
So, our Friday setup has worked very well. I could say that drop was even stronger than we thought. On 4H chart market is forming wide triangle. Here guys, we meet uncertainty and it relates to Fed meeting. Rate increase will not become a surprise, but what Jay Powell will tell on assessment of perspective - that is what really matters.
Still, to be honest, taking in consideration fundamental background, chances on dovish comments are low to my mind.

That's being said, we've come to conclusion that it's not time to go long, at least until former top is intact. Hence, the one direction that we take in consideration is short entry. Current price level is too far from the top and potential stop placement area. It means that we can't go short here anyway and need some more attractive, higher levels for entry. Personally I would watch for something like this - upside AB=CD bounce and "222" Sell":

Conclusion
In long-term analysis we see thrilling agreement of fundamental and technical pictures, which should be interesting to watch within few years.
Shorter-term setup has changed to bearish, as weekly bearish grabber has been formed. It makes very dangerous any attempt to go long on daily and intraday charts.
The technical portion of Sive's analysis owes a great deal to Joe DiNapoli's methods, and uses a number of Joe's proprietary indicators. Please note that Sive's analysis is his own view of the market and is not endorsed by Joe DiNapoli or any related companies.
As we mostly have done with explanation our long-term view within few previous reports, now we take a look at short-term picture and driving factors that could impact on gold market on coming week.
In two words long-term view suggests downside continuation within a year or so, while US will keep high rates of GDP and Fed will keep hawkish policy and reversal later, closer to 2020, because by Fathom consulting view world could meet global crisis. Fathom is reliable source and we can't just ignore this scenario.
In shorter term, as Reuters reports, gold prices fell more than 1 percent on Friday as the dollar firmed against the British sterling and the euro after British Prime Minister Theresa May said the European Union must supply an alternative Brexit proposal.
China’s moves to boost domestic consumption also helped bolster the dollar rally driven by investor bets that the latest U.S.-China trade salvoes were unlikely to dent global growth. The dollar’s status as the chief reserve currency makes it the prime beneficiary of U.S.-China trade conflict, with the United States seen as having less to lose.
“A big selloff in the pound and euro sent the dollar sharply higher. And gold, being dollar-denominated, fell as a result of that,” said FOREX.com analyst Fawad Razaqzada.
Investors await next week’s Federal Reserve meeting, where the U.S. central bank is widely expected to raise benchmark interest rates. Higher U.S. interest rates tend to make gold less attractive since it does not pay interest and costs money to store and insure.
I also suggest that last week major driving factor for gold was US interest rates. Indeed, 10-year rate has moved above psychological 3.0% area again, breaking pennant pattern up:
It is done question about rate increase next week. But probability is high for 4th rate increase in December as well - it stands now around 78%, based on CME Fed Watch Tool.
COT Report
Recent CFTC data shows that investors reluctantly react on price action on gold market. This moment confirms that current upside action mostly is treated as retracement. We do not see big changes in net position and open interest.
Charting by Investing.com
Technical
Monthly
On monthly chart we keep our long-term technical scenario, that could be realized. this is not single possible scenario, but currently it seems as very probable. We will keep it intact for awhile, because it illustrates our fundamental expectations on gold market.
Here we try to involve fundamental view in technical analysis, trying to combine patterns with real fundamental situation on gold. So, we will take broader view.
If you follow our weekly updates, you should remember our explanation and why we think that gold inability to break through 1380 resistance should be treated as bulls' defeat and gold failure. This is important in outlook of longer-term perspective.
Fundamental picture suggests two major things. In shorter-term US will keep dominate role in the world, because indirectly it controls EU economy as major EU companies have significant part of their business in US, or on US territory, US dollar is still world major currency and, as we've estimated above, China starts to show signs of chilling their economy. US economy itself feels good. D. Trump by restructuring of political role of US on international arena will safe a lot of "unnecessary" spending, such as revolutions, different programs of opposition financing, military spending of different kind. This should improve US budget, reduce deficit, which also will work on support of US economy.
Second important issue, this long-term relations that stand for decades start changing. Both of these moments, putting together, lead us to following conclusion. Within few years, 2-3 probably gold will remain under pressure of positive interest rates cycle. While gradually, when breaking of long-term economic relations will be seen brighter and brighter and impact not only China, EU but US as well - this will be turning point for the gold, or slightly before that. Because any global crush of any kind triggers demand for gold. That is what we see from fundamentals.
It could look unbelievable, but technical picture shows approximately the same. Failure of 1380 upside breakout confirms our idea of 2-3 years of US and US Dollar domination. But at the same time gold should show preparation to reversal, and here it is. One of the scenarios that might be formed here is big 1.618 butterfly, which is bullish reversal pattern. It has 1.618 target right around gold price, which is corresponds to extraction spending approximately. So, it is long-term breakeven point.
Finally, butterfly could become large reverse H&S pattern around all time 5/8 Fib support and ~40% of this pattern could be seen on the market. What we see on the chart nicely corresponds to current fundamental background.
Of course, political life is not static, and it could show fast turns. But right now, everything looks very harmonic.
Here we also have mentioned huge demand on gold from emerging countries - China, Russia and Turkey. Developed countries repatriate gold from US. It means that everybody prepares to something, which should significantly increase demand for a gold.
So, that's is our long-term view. There is softer scenario of "222" Buy pattern instead of butterfly exists, but which one will happen in reality is impossible to say right now and we will keep an eye on both.
Weekly
Last week, guys, we've missed a bit with grabber, because retail broker has shown it on its chart, but in reality grabber was not confirmed by gold futures price.
Today, we have mirror situation. FX broker shows no grabber, but I have checked CME gold futures, and we have one as on October contract as on continuous futures. It means that here we could repeat the same analysis, as for previous week. Besides, market stands at the same price area as last week.
Weekly price action mostly stands inside the range of long August candle, when gold has hit weekly oversold. Since then we watch for patterns here and upside bounce to at least 3/8 resistance area of 1238$, which seems normal pullback in such conditions.
Despite our long term bearish trend on gold, it can't show straight down action without any pauses. And we think that one of these stops we have right now. Although the scale of this "pause" looks impressive 50-70$ per contract bounce, on weekly chart this is just 3/8 pullback, which seems normal when market hits oversold and YPS1 areas. Thus, on weekly we still watch for our directional pattern, based on the thrust down.
Weekly time frame is the one that gives us the vision for few weeks. In a longer-term view we still have large AB=CD pattern with OP around 1113 area. Sooner or later but probably it should be reached. Just because gold has dropped easily through 1215 major support and has not stopped at 1180 YPS1 but collapsed right to 1160. So, now price action stands between COP and OP target. Usually in such placement, price gravitates to OP, because in fact, it has no strong support lower, its a free space. And the only thing that keeps gold from disaster is Oversold condition, which important for us in short-term view.
Oversold suggests upside bounce at least to 3/8 resistance area - 1238$. It looks far on weekly chart, but in reality, this is just 30% and common response to reaching of OS. Since our major direction is down - we're mostly looking for chances to go short here, and upside bounce to Fib level could give us B&B "Sell". That's particular the pattern that we will be watching for here. Currently we have shape of engulfing price action and retracement back inside its body is common practice. But this pattern has not even started, as we have no close above 3x3 DMA yet.
In shorter-term we've got a new input here - bearish grabber. It doesn't cancel scenario with upside bounce (although it could), but significantly changes possible price shape. Thus, it suggests taking out of recent lows and drop to MPS1. It means that we will have to turn in favor of Double bottom pattern on daily chart rather than simple AB=CD.
Daily
Now we need to take a look at lower time frames through the prism of weekly grabber pattern. The one thing that stands absolutely clear is the recent top. While price stands below it, we have bearish context, because weekly grabber is valid. It doesn't mean that we cancel our scenario with higher upside retracement. It just mean that weekly grabber probably will change the shape of price action and particular pattern that could push gold there, to 1240 area. For instance, it could be DRPO "Buy" on weekly chart...
As last week as this one we have bearish MACD divergence. Taking in consideration weekly bearish grabber, our context turns bearish, which makes rather dangerous any attempt to go long. It means that bulls should wait when weekly grabber will either worked out or cancelled. And when clear bullish pattern will be formed here, on daily. Situation becomes attractive for intraday bears.
Intraday
So, our Friday setup has worked very well. I could say that drop was even stronger than we thought. On 4H chart market is forming wide triangle. Here guys, we meet uncertainty and it relates to Fed meeting. Rate increase will not become a surprise, but what Jay Powell will tell on assessment of perspective - that is what really matters.
Still, to be honest, taking in consideration fundamental background, chances on dovish comments are low to my mind.
That's being said, we've come to conclusion that it's not time to go long, at least until former top is intact. Hence, the one direction that we take in consideration is short entry. Current price level is too far from the top and potential stop placement area. It means that we can't go short here anyway and need some more attractive, higher levels for entry. Personally I would watch for something like this - upside AB=CD bounce and "222" Sell":
Conclusion
In long-term analysis we see thrilling agreement of fundamental and technical pictures, which should be interesting to watch within few years.
Shorter-term setup has changed to bearish, as weekly bearish grabber has been formed. It makes very dangerous any attempt to go long on daily and intraday charts.
The technical portion of Sive's analysis owes a great deal to Joe DiNapoli's methods, and uses a number of Joe's proprietary indicators. Please note that Sive's analysis is his own view of the market and is not endorsed by Joe DiNapoli or any related companies.